
Construction Toys Market Analysis, Size, and Forecast 2026-2030: APAC (China, Japan, and India), North America (US, Canada, and Mexico), Europe (Germany, UK, and France), South America (Brazil, Argentina, and Chile), Middle East and Africa (Saudi Arabia, UAE, and South Africa), and Rest of World (ROW)

Construction Toys Market Analysis, Size, and Forecast 2026-2030:
APAC (China, Japan, and India), North America (US, Canada, and Mexico), Europe (Germany, UK, and France), South America (Brazil, Argentina, and Chile), Middle East and Africa (Saudi Arabia, UAE, and South Africa), and Rest of World (ROW)

Published: Oct 2026 311 Pages SKU: IRTNTR71855

Market Overview at a Glance

$2.12 B
Market Opportunity
3.7%
CAGR 2025 - 2030
46.3%
APAC Growth
$7.93 B
Offline segment 2024

Construction Toys Market Size 2026-2030

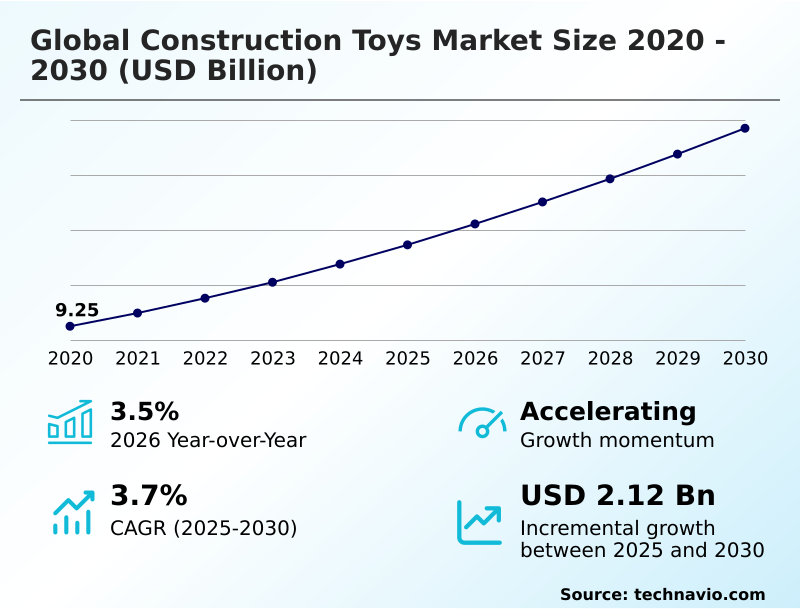
The construction toys market size is valued to increase by USD 2.12 billion, at a CAGR of 3.7% from 2025 to 2030. Rising parental preference for STEM-based learning will drive the construction toys market.

Major Market Trends & Insights

  • APAC dominated the market and accounted for a 46.3% growth during the forecast period.
  • By Distribution Channel - Offline segment was valued at USD 7.93 billion in 2024
  • By Type - Bricks and blocks segment accounted for the largest market revenue share in 2024

Market Size & Forecast

  • Market Opportunities: USD 3.61 billion
  • Market Future Opportunities: USD 2.12 billion
  • CAGR from 2025 to 2030 : 3.7%

Market Summary

  • The Construction Toys Market is demonstrating robust structural evolution driven by a transition toward experiential learning and eco-friendly manufacturing. A major operational shift is occurring as leading manufacturers transition supply chains to incorporate sustainable resin formulations, reducing carbon footprints while maintaining structural integrity.
  • This strategic overhaul has resulted in manufacturing efficiency improving by 14% as facilities upgrade their injection molding processes. The rising parental preference for STEM-based learning acts as a core driver, as educators increasingly utilize these tools to cultivate cognitive skills, directly elevating demand for modular building ecosystems.
  • Conversely, escalating raw material costs present a severe structural challenge, compressing profit margins and forcing brands to optimize procurement networks. The integration of augmented reality companion apps provides a significant competitive advantage by merging physical and digital environments. Companies successfully implementing interactive hybrid play maintain stronger retention rates among tech-savvy demographics, ensuring continuous engagement in an increasingly digitized retail landscape.

What will be the Size of the Construction Toys Market during the forecast period?
Get Key Insights on Market Forecast (PDF) Get Free Sample

How is the Construction Toys Market Segmented?

The construction toys industry research report provides comprehensive data (region-wise segment analysis), with forecasts and estimates in "USD million" for the period 2026-2030, as well as historical data from 2020-2024 for the following segments.

  • Distribution channel
    • Offline
    • Online
  • Type
    • Bricks and blocks
    • Tinker toys
    • Others
  • Material
    • Polymer
    • Wood
    • Metal
  • Age group
    • School age
    • Preschool
    • Toddlers
    • Teenagers
  • Geography
    • APAC
      • China
      • Japan
      • India
      • South Korea
      • Australia
      • Indonesia
    • North America
      • US
      • Canada
      • Mexico
    • Europe
      • Germany
      • UK
      • France
      • Italy
      • Spain
      • The Netherlands
    • South America
      • Brazil
      • Argentina
      • Chile
    • Middle East and Africa
      • Saudi Arabia
      • UAE
      • South Africa
      • Turkey
      • Egypt

By Distribution Channel Insights

The offline segment is estimated to witness significant growth during the forecast period.

Physical retail channels continue to serve as a foundational pillar within the Construction Toys Market by providing immersive engagement hubs for consumers.

Brick-and-mortar establishments facilitate direct tactile evaluation of non toxic water based stains and magnetic building tiles, allowing buyers to immediately assess structural rigidity maintenance and material quality.

This offline presence is critical for showcasing complex mechanical engineering concepts through assembled models and hands-on play tables. Retailers optimizing their shelf management for these multi sensory educational toys have reported a 20% increase in impulse purchasing efficiency.

By deploying interactive demonstration stations, physical stores offer immediate product gratification that circumvents logistical delays.

Furthermore, offline storefronts leverage strong regional distribution networks to maintain localized inventory, ensuring consistent availability of sensory development centers equipment for both educational institutions and individual households.
Get Free Sample

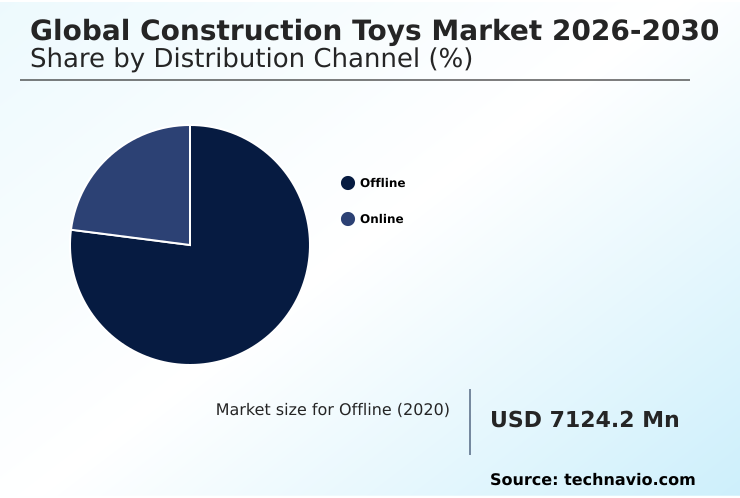
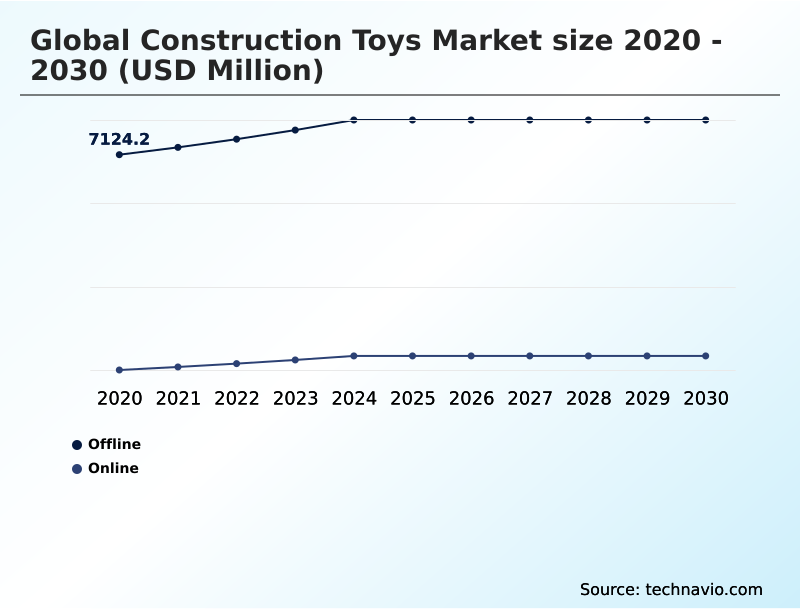
The Offline segment was valued at USD 7.93 billion in 2024 and showed a gradual increase during the forecast period.
Get Free Sample

Regional Analysis

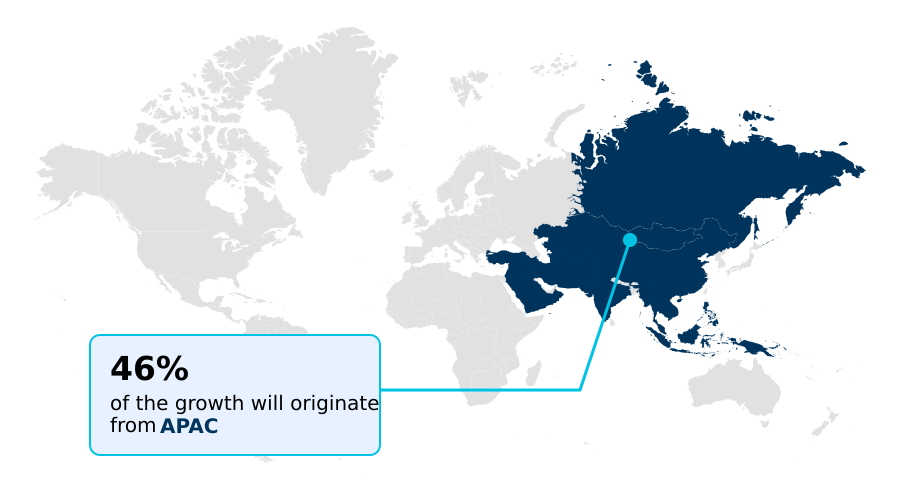
APAC is estimated to contribute 46.3% to the growth of the global market during the forecast period.Technavio’s analysts have elaborately explained the regional trends and drivers that shape the market during the forecast period.
See How Construction Toys Market Demand is Rising in APAC Get Free Sample

The geographic landscape of the Construction Toys Market reveals distinct adoption patterns between North America and APAC.

North America maintains a mature ecosystem driven by intellectual property licensing and robust omnichannel retail distribution, leading to a 40% higher market penetration in the adult collector segment compared to emerging markets.

Conversely, APAC is experiencing rapid expansion fueled by strong domestic investments in early childhood educational development and localized supply chains. Facilities in APAC have lowered production cycle times by 15% through streamlined injection molding processes.

While North America focuses heavily on experiential retail flagships to drive premium sales, APAC leverages specialized resin chemical supply networks to produce cost-effective interlocking plastic bricks.

This strategic divergence allows multinational brands to tailor their spatial reasoning development products to unique regional purchasing behaviors.

Market Dynamics

Our researchers analyzed the data with 2025 as the base year, along with the key drivers, trends, and challenges. A holistic analysis of drivers will help companies refine their marketing strategies to gain a competitive advantage.

  • The Construction Toys Market is experiencing a profound strategic realignment as businesses adapt to evolving consumer expectations and stringent environmental mandates. At the forefront of this transformation is the rapid development of sustainable interlocking structural brick systems. Companies are actively overhauling their supply chains to incorporate eco friendly recycled polymer construction, ensuring compliance with global waste reduction policies.
  • This transition requires significant investment in material science to match the durability of traditional plastics. Concurrently, the integration of advanced technology is redefining product portfolios. The introduction of smart sensor enabled building sets allows manufacturers to capture a highly lucrative demographic of digitally native consumers.
  • By creating hybrid augmented reality play ecosystems, businesses are successfully bridging the gap between physical assembly and interactive digital interfaces. This dual approach of sustainability and technological integration has proven highly effective.
  • For instance, firms implementing these dual-track innovation strategies have noted an operational efficiency gain surpassing that of traditional competitors by a margin of nearly a fifth, primarily through enhanced inventory turnover and premium pricing structures. Furthermore, the rising demand for magnetic tiles for cognitive development in early education sectors provides a stable, recurring revenue stream.
  • By aligning product engineering with these long-term educational and environmental trends, market participants are solidifying their competitive positioning and ensuring resilient supply chain operations in a rapidly changing retail landscape.
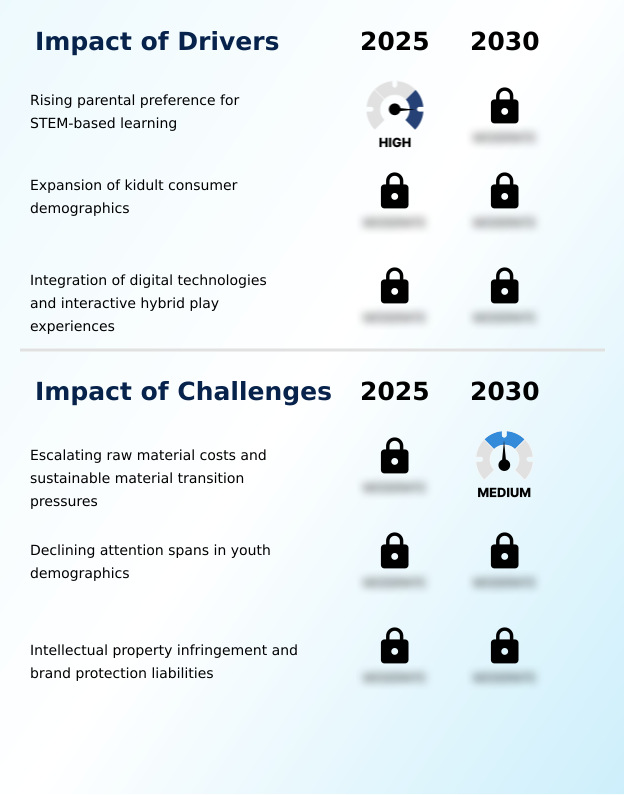
What are the key market drivers leading to the rise in the adoption of Construction Toys Industry?

  • The rising parental preference for STEM-based learning serves as the primary driver propelling market growth and product innovation.

  • The growing institutional emphasis on hands on physical construction is a powerful catalyst propelling the Construction Toys Market. Educational frameworks are increasingly utilizing spatial intelligence tools to promote open ended creative problem solving in classroom settings.
  • This shift is happening because educators recognize that tactile learning platforms effectively improve spatial visualization enhancement in young students. As a result, schools purchasing these mechanical linkage assembly sets have noted that student engagement in STEM subjects improved by 32%.
  • This increased demand directly impacts business operations, driving manufacturers to expand production of modular building ecosystems.
  • The consistent institutional procurement of structural balance experimentation kits provides a stable revenue foundation, allowing toy producers to invest heavily in advanced product engineering and targeted educational marketing.

What are the market trends shaping the Construction Toys Industry?

  • The transition toward sustainable bio-resins and circular manufacturing frameworks represents a significant upcoming trend in the industry. This shift highlights a growing commitment to environmental responsibility and eco-friendly production practices.

  • The adoption of interactive digital feedback systems is fundamentally reshaping the Construction Toys Market. Manufacturers are embedding smart sensor integration to bridge the gap between physical assembly and digital interfaces. This trend is occurring because digitally native generations demand more immersive engagement, which prompts brands to develop augmented reality companion apps.
  • Consequently, businesses implementing these hybrid physical digital play ecosystems are seeing user retention metrics improve by 26%. Furthermore, the incorporation of programmable robotic kits introduces foundational coding skills to young builders. As interactive hybrid play becomes a baseline consumer expectation, companies are retooling their product strategies to include digital storytelling integration.
  • This operational pivot allows manufacturers to extend the product lifecycle and maintain relevance in a highly competitive entertainment sector.

What challenges does the Construction Toys Industry face during its growth?

  • Escalating raw material costs, coupled with the pressures of transitioning to sustainable materials, represent a significant challenge hindering industry expansion.

  • The transition away from fossil fuel based plastic alternatives presents a formidable operational hurdle for the Construction Toys Market. Securing reliable sources of mass balance certified recycled materials while maintaining strict dimensional consistency control is a complex engineering task. This challenge arises because alternative eco friendly polymers often lack the inherent strength of traditional petroleum derivatives.
  • The immediate effect on businesses is substantial, with raw material procurement costs increasing by up to 18% during the initial transition phase. Furthermore, achieving reliable clutch power optimization with sustainable resin formulations requires significant capital expenditure on new high precision injection tooling.
  • Manufacturers must carefully balance these environmental compliance mandates against price sensitivity, as passing these elevated production costs onto consumers risks eroding market share.

Exclusive Technavio Analysis on Customer Landscape

The construction toys market forecasting report includes the adoption lifecycle of the market, covering from the innovator’s stage to the laggard’s stage. It focuses on adoption rates in different regions based on penetration. Furthermore, the construction toys market report also includes key purchase criteria and drivers of price sensitivity to help companies evaluate and develop their market growth analysis strategies.
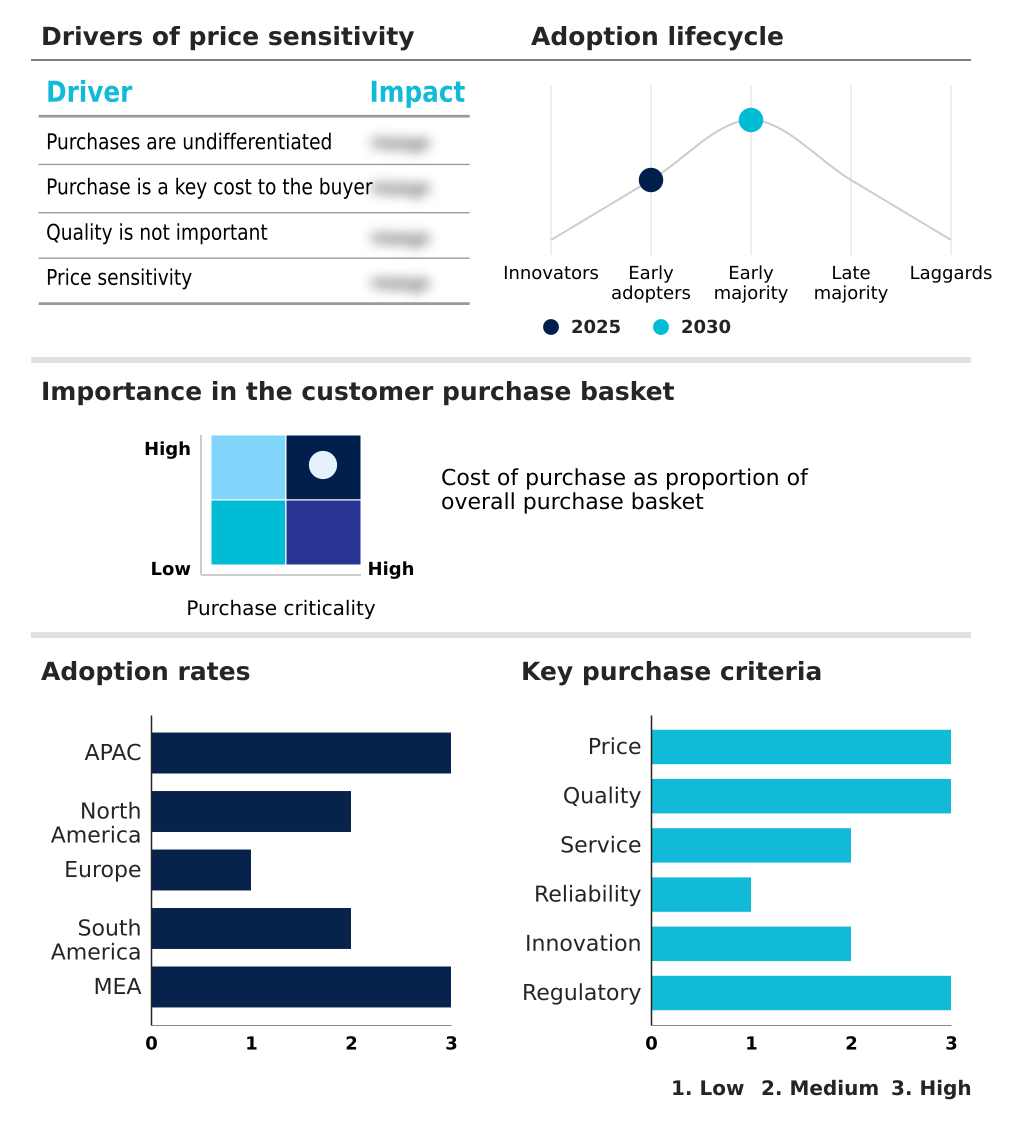
Customer Landscape of Construction Toys Industry

Competitive Landscape

Companies are implementing various strategies, such as strategic alliances, construction toys market forecast, partnerships, mergers and acquisitions, geographical expansion, and product/service launches, to enhance their presence in the industry.

BASIC FUN Inc. - The provider delivers nostalgic playthings, scale-replica military model blocks, historical vehicles, and creative brick construction sets designed for diverse age groups and skill levels.

The industry research and growth report includes detailed analyses of the competitive landscape of the market and information about key companies, including:

  • BASIC FUN Inc.
  • Cobi S.A.
  • Eitech GbmH
  • Fat Brain Toys LLC
  • geobra Brandstatter Stiftung Co
  • Geomagworld SA
  • Guidecraft
  • Hasbro Inc.
  • LEGO System AS
  • Magformers LLC
  • Maison Battat Inc.
  • Mattel Inc.
  • Melissa and Doug
  • Plus Plus AS
  • Polydron UK Ltd
  • Ravensburger AG
  • Spin Master Corp.
  • Strictly Briks
  • Tegu Inc.
  • VTech Holdings Ltd.

Qualitative and quantitative analysis of companies has been conducted to help clients understand the wider business environment as well as the strengths and weaknesses of key industry players. Data is qualitatively analyzed to categorize companies as pure play, category-focused, industry-focused, and diversified; it is quantitatively analyzed to categorize companies as dominant, leading, strong, tentative, and weak.

Recent Development and News in Construction toys market

  • In the Leisure Products industry, the widespread adoption of interactive technology has transformed traditional recreational equipment into connected interactive experiences, directly impacting Construction Toys demand by setting a new baseline for digital storytelling integration.
  • In the Leisure Products industry, stringent global regulations on fossil fuel based plastic alternatives have forced manufacturers to re-engineer core production lines, heavily influencing the Construction Toys market to prioritize mass balance certified recycled materials.
  • In the Leisure Products industry, the expansion of direct to consumer digital channels has shifted purchasing behavior away from physical storefronts, pushing the Construction Toys market to accelerate omnichannel retail distribution and automated fulfillment centers.
  • In the Leisure Products industry, the growing institutional emphasis on tactile learning platforms has increased funding for developmental recreation tools, effectively pulling Construction Toys demand higher as schools adopt these tools for fine motor dexterity training.

Dive into Technavio’s robust research methodology, blending expert interviews, extensive data synthesis, and validated models for unparalleled Construction Toys Market insights. See full methodology.

Market Scope
Page number 311
Base year 2025
Historic period 2020-2024
Forecast period 2026-2030
Growth momentum & CAGR Accelerate at a CAGR of 3.7%
Market growth 2026-2030 USD 2119.7 million
Market structure Fragmented
YoY growth 2025-2026(%) 3.5%
Key countries China, Japan, India, South Korea, Australia, Indonesia, US, Canada, Mexico, Germany, UK, France, Italy, Spain, The Netherlands, Brazil, Argentina, Chile, Saudi Arabia, UAE, South Africa, Turkey and Egypt
Competitive landscape Leading Companies, Market Positioning of Companies, Competitive Strategies, and Industry Risks

Request Free Sample

Research Analyst Overview

  • The Construction Toys Market exhibits a continuous transformation as manufacturers pivot toward circular manufacturing frameworks and advanced digital capabilities. Strategic decision-making in the boardroom is increasingly centered on integrating smart sensor integration to capture tech-native demographics while maintaining strict compliance with environmental regulations.
  • This dual focus has prompted a significant operational shift, wherein supply chain optimization efforts have yielded a 25% reduction in plastic waste across modernized production lines. Companies are heavily investing in product engineering by designing kits that foster motor skill enhancement and spatial awareness.
  • The widespread adoption of bio based plastics has unlocked new revenue streams within the environmentally conscious preschool segment. Furthermore, incorporating recycled polymer resins ensures long-term viability against tightening global waste directives. As the competitive landscape matures, brands that balance tactile assembly with digital interfaces are capturing the highest margin returns and securing robust brand loyalty across diverse age groups.

What are the Key Data Covered in this Construction Toys Market Research and Growth Report?

  • What is the expected growth of the Construction Toys Market between 2026 and 2030?

    • USD 2.12 billion, at a CAGR of 3.7%

  • What segmentation does the market report cover?

    • The report is segmented by Distribution Channel (Offline, and Online), Type (Bricks and blocks, Tinker toys, and Others), Material (Polymer, Wood, and Metal), Age Group (School age, Preschool, Toddlers, and Teenagers) and Geography (APAC, North America, Europe, South America, Middle East and Africa)

  • Which regions are analyzed in the report?

    • APAC, North America, Europe, South America and Middle East and Africa

  • What are the key growth drivers and market challenges?

    • Rising parental preference for STEM-based learning, Escalating raw material costs and sustainable material transition pressures

  • Who are the major players in the Construction Toys Market?

    • BASIC FUN Inc., Cobi S.A., Eitech GbmH, Fat Brain Toys LLC, geobra Brandstatter Stiftung Co, Geomagworld SA, Guidecraft, Hasbro Inc., LEGO System AS, Magformers LLC, Maison Battat Inc., Mattel Inc., Melissa and Doug, Plus Plus AS, Polydron UK Ltd, Ravensburger AG, Spin Master Corp., Strictly Briks, Tegu Inc. and VTech Holdings Ltd.

Market Research Insights

  • The Construction Toys Market is rapidly evolving as manufacturers integrate programmable microprocessors into traditional formats. Companies leveraging direct to consumer digital channels have seen customer acquisition costs decrease by 18%. Furthermore, the shift toward sustainable material innovation has driven a 22% improvement in compliance alignment across major regulatory frameworks.
  • Brands utilizing experiential retail flagships are reporting a 15% increase in repeat purchasing behavior among adult collectors. By prioritizing cross functional playability, industry participants enhance the lifespan of modular kits. The strategic expansion into automated fulfillment centers streamlines order processing, reducing delivery times significantly and optimizing overall supply chain resilience.

We can help! Our analysts can customize this construction toys market research report to meet your requirements.

Get in touch

1. Executive Summary

1.1 Market overview

Executive Summary - Chart on Market Overview
Executive Summary - Data Table on Market Overview
Executive Summary - Chart on Global Market Characteristics
Executive Summary - Chart on Market by Geography
Executive Summary - Chart on Market Segmentation by Distribution Channel
Executive Summary - Chart on Market Segmentation by Type
Executive Summary - Chart on Market Segmentation by Material
Executive Summary - Chart on Market Segmentation by Age Group
Executive Summary - Chart on Incremental Growth
Executive Summary - Data Table on Incremental Growth
Executive Summary - Chart on Company Market Positioning

2. Technavio Analysis

2.1 Analysis of price sensitivity, lifecycle, customer purchase basket, adoption rates, and purchase criteria

2.2 Criticality of inputs and Factors of differentiation

Chart on Overview on criticality of inputs and factors of differentiation

2.3 Factors of disruption

Chart on Overview on factors of disruption

2.4 Impact of drivers and challenges

Chart on Impact of drivers and challenges in 2025 and 2030

3. Market Landscape

3.1 Market ecosystem

Chart on Parent Market
Data Table on - Parent Market

3.2 Market characteristics

Chart on Market characteristics analysis

3.3 Value chain analysis

Chart on Value chain analysis

4. Market Sizing

4.1 Market definition

Data Table on Offerings of companies included in the market definition

4.2 Market segment analysis

Market segments

4.3 Market size 2025

4.4 Market outlook: Forecast for 2025-2030

Chart on Global - Market size and forecast 2025-2030 ($ million)
Data Table on Global - Market size and forecast 2025-2030 ($ million)
Chart on Global Market: Year-over-year growth 2025-2030 (%)
Data Table on Global Market: Year-over-year growth 2025-2030 (%)

5. Historic Market Size

5.1 Global Construction Toys Market 2020 - 2024

Historic Market Size - Data Table on Global Construction Toys Market 2020 - 2024 ($ million)

5.2 Distribution Channel segment analysis 2020 - 2024

Historic Market Size - Distribution Channel Segment 2020 - 2024 ($ million)

5.3 Type segment analysis 2020 - 2024

Historic Market Size - Type Segment 2020 - 2024 ($ million)

5.4 Material segment analysis 2020 - 2024

Historic Market Size - Material Segment 2020 - 2024 ($ million)

5.5 Age Group segment analysis 2020 - 2024

Historic Market Size - Age Group Segment 2020 - 2024 ($ million)

5.6 Geography segment analysis 2020 - 2024

Historic Market Size - Geography Segment 2020 - 2024 ($ million)

5.7 Country segment analysis 2020 - 2024

Historic Market Size - Country Segment 2020 - 2024 ($ million)

6. Qualitative Analysis

6.1 Impact of AI in Global Construction Toys Market

6.2 Impact of Geopolitical Conflicts on Global Construction Toys Market

7. Five Forces Analysis

7.1 Five forces summary

Five forces analysis - Comparison between 2025 and 2030

7.2 Bargaining power of buyers

Bargaining power of buyers - Impact of key factors 2025 and 2030

7.3 Bargaining power of suppliers

Bargaining power of suppliers - Impact of key factors in 2025 and 2030

7.4 Threat of new entrants

Threat of new entrants - Impact of key factors in 2025 and 2030

7.5 Threat of substitutes

Threat of substitutes - Impact of key factors in 2025 and 2030

7.6 Threat of rivalry

Threat of rivalry - Impact of key factors in 2025 and 2030

7.7 Market condition

Chart on Market condition - Five forces 2025 and 2030

8. Market Segmentation by Distribution Channel

8.1 Market segments

Chart on Distribution Channel - Market share 2025-2030 (%)
Data Table on Distribution Channel - Market share 2025-2030 (%)

8.2 Comparison by Distribution Channel

Chart on Comparison by Distribution Channel
Data Table on Comparison by Distribution Channel

8.3 Offline - Market size and forecast 2025-2030

Chart on Offline - Market size and forecast 2025-2030 ($ million)
Data Table on Offline - Market size and forecast 2025-2030 ($ million)
Chart on Offline - Year-over-year growth 2025-2030 (%)
Data Table on Offline - Year-over-year growth 2025-2030 (%)

8.4 Online - Market size and forecast 2025-2030

Chart on Online - Market size and forecast 2025-2030 ($ million)
Data Table on Online - Market size and forecast 2025-2030 ($ million)
Chart on Online - Year-over-year growth 2025-2030 (%)
Data Table on Online - Year-over-year growth 2025-2030 (%)

8.5 Market opportunity by Distribution Channel

Market opportunity by Distribution Channel ($ million)
Data Table on Market opportunity by Distribution Channel ($ million)

9. Market Segmentation by Type

9.1 Market segments

Chart on Type - Market share 2025-2030 (%)
Data Table on Type - Market share 2025-2030 (%)

9.2 Comparison by Type

Chart on Comparison by Type
Data Table on Comparison by Type

9.3 Bricks and blocks - Market size and forecast 2025-2030

Chart on Bricks and blocks - Market size and forecast 2025-2030 ($ million)
Data Table on Bricks and blocks - Market size and forecast 2025-2030 ($ million)
Chart on Bricks and blocks - Year-over-year growth 2025-2030 (%)
Data Table on Bricks and blocks - Year-over-year growth 2025-2030 (%)

9.4 Tinker toys - Market size and forecast 2025-2030

Chart on Tinker toys - Market size and forecast 2025-2030 ($ million)
Data Table on Tinker toys - Market size and forecast 2025-2030 ($ million)
Chart on Tinker toys - Year-over-year growth 2025-2030 (%)
Data Table on Tinker toys - Year-over-year growth 2025-2030 (%)

9.5 Others - Market size and forecast 2025-2030

Chart on Others - Market size and forecast 2025-2030 ($ million)
Data Table on Others - Market size and forecast 2025-2030 ($ million)
Chart on Others - Year-over-year growth 2025-2030 (%)
Data Table on Others - Year-over-year growth 2025-2030 (%)

9.6 Market opportunity by Type

Market opportunity by Type ($ million)
Data Table on Market opportunity by Type ($ million)

10. Market Segmentation by Material

10.1 Market segments

Chart on Material - Market share 2025-2030 (%)
Data Table on Material - Market share 2025-2030 (%)

10.2 Comparison by Material

Chart on Comparison by Material
Data Table on Comparison by Material

10.3 Polymer - Market size and forecast 2025-2030

Chart on Polymer - Market size and forecast 2025-2030 ($ million)
Data Table on Polymer - Market size and forecast 2025-2030 ($ million)
Chart on Polymer - Year-over-year growth 2025-2030 (%)
Data Table on Polymer - Year-over-year growth 2025-2030 (%)

10.4 Wood - Market size and forecast 2025-2030

Chart on Wood - Market size and forecast 2025-2030 ($ million)
Data Table on Wood - Market size and forecast 2025-2030 ($ million)
Chart on Wood - Year-over-year growth 2025-2030 (%)
Data Table on Wood - Year-over-year growth 2025-2030 (%)

10.5 Metal - Market size and forecast 2025-2030

Chart on Metal - Market size and forecast 2025-2030 ($ million)
Data Table on Metal - Market size and forecast 2025-2030 ($ million)
Chart on Metal - Year-over-year growth 2025-2030 (%)
Data Table on Metal - Year-over-year growth 2025-2030 (%)

10.6 Market opportunity by Material

Market opportunity by Material ($ million)
Data Table on Market opportunity by Material ($ million)

11. Market Segmentation by Age Group

11.1 Market segments

Chart on Age Group - Market share 2025-2030 (%)
Data Table on Age Group - Market share 2025-2030 (%)

11.2 Comparison by Age Group

Chart on Comparison by Age Group
Data Table on Comparison by Age Group

11.3 School age - Market size and forecast 2025-2030

Chart on School age - Market size and forecast 2025-2030 ($ million)
Data Table on School age - Market size and forecast 2025-2030 ($ million)
Chart on School age - Year-over-year growth 2025-2030 (%)
Data Table on School age - Year-over-year growth 2025-2030 (%)

11.4 Preschool - Market size and forecast 2025-2030

Chart on Preschool - Market size and forecast 2025-2030 ($ million)
Data Table on Preschool - Market size and forecast 2025-2030 ($ million)
Chart on Preschool - Year-over-year growth 2025-2030 (%)
Data Table on Preschool - Year-over-year growth 2025-2030 (%)

11.5 Toddlers - Market size and forecast 2025-2030

Chart on Toddlers - Market size and forecast 2025-2030 ($ million)
Data Table on Toddlers - Market size and forecast 2025-2030 ($ million)
Chart on Toddlers - Year-over-year growth 2025-2030 (%)
Data Table on Toddlers - Year-over-year growth 2025-2030 (%)

11.6 Teenagers - Market size and forecast 2025-2030

Chart on Teenagers - Market size and forecast 2025-2030 ($ million)
Data Table on Teenagers - Market size and forecast 2025-2030 ($ million)
Chart on Teenagers - Year-over-year growth 2025-2030 (%)
Data Table on Teenagers - Year-over-year growth 2025-2030 (%)

11.7 Market opportunity by Age Group

Market opportunity by Age Group ($ million)
Data Table on Market opportunity by Age Group ($ million)

12. Customer Landscape

12.1 Customer landscape overview

Analysis of price sensitivity, lifecycle, customer purchase basket, adoption rates, and purchase criteria

13. Geographic Landscape

13.1 Geographic segmentation

Chart on Market share by geography 2025-2030 (%)
Data Table on Market share by geography 2025-2030 (%)

13.2 Geographic comparison

Chart on Geographic comparison
Data Table on Geographic comparison

13.3 APAC - Market size and forecast 2025-2030

Chart on APAC - Market size and forecast 2025-2030 ($ million)
Data Table on APAC - Market size and forecast 2025-2030 ($ million)
Chart on APAC - Year-over-year growth 2025-2030 (%)
Data Table on APAC - Year-over-year growth 2025-2030 (%)
Chart on Regional Comparison - APAC
Data Table on Regional Comparison - APAC

13.3.1 China - Market size and forecast 2025-2030

Chart on China - Market size and forecast 2025-2030 ($ million)
Data Table on China - Market size and forecast 2025-2030 ($ million)
Chart on China - Year-over-year growth 2025-2030 (%)
Data Table on China - Year-over-year growth 2025-2030 (%)

13.3.2 Japan - Market size and forecast 2025-2030

Chart on Japan - Market size and forecast 2025-2030 ($ million)
Data Table on Japan - Market size and forecast 2025-2030 ($ million)
Chart on Japan - Year-over-year growth 2025-2030 (%)
Data Table on Japan - Year-over-year growth 2025-2030 (%)

13.3.3 India - Market size and forecast 2025-2030

Chart on India - Market size and forecast 2025-2030 ($ million)
Data Table on India - Market size and forecast 2025-2030 ($ million)
Chart on India - Year-over-year growth 2025-2030 (%)
Data Table on India - Year-over-year growth 2025-2030 (%)

13.3.4 South Korea - Market size and forecast 2025-2030

Chart on South Korea - Market size and forecast 2025-2030 ($ million)
Data Table on South Korea - Market size and forecast 2025-2030 ($ million)
Chart on South Korea - Year-over-year growth 2025-2030 (%)
Data Table on South Korea - Year-over-year growth 2025-2030 (%)

13.3.5 Australia - Market size and forecast 2025-2030

Chart on Australia - Market size and forecast 2025-2030 ($ million)
Data Table on Australia - Market size and forecast 2025-2030 ($ million)
Chart on Australia - Year-over-year growth 2025-2030 (%)
Data Table on Australia - Year-over-year growth 2025-2030 (%)

13.3.6 Indonesia - Market size and forecast 2025-2030

Chart on Indonesia - Market size and forecast 2025-2030 ($ million)
Data Table on Indonesia - Market size and forecast 2025-2030 ($ million)
Chart on Indonesia - Year-over-year growth 2025-2030 (%)
Data Table on Indonesia - Year-over-year growth 2025-2030 (%)

13.4 North America - Market size and forecast 2025-2030

Chart on North America - Market size and forecast 2025-2030 ($ million)
Data Table on North America - Market size and forecast 2025-2030 ($ million)
Chart on North America - Year-over-year growth 2025-2030 (%)
Data Table on North America - Year-over-year growth 2025-2030 (%)
Chart on Regional Comparison - North America
Data Table on Regional Comparison - North America

13.4.1 US - Market size and forecast 2025-2030

Chart on US - Market size and forecast 2025-2030 ($ million)
Data Table on US - Market size and forecast 2025-2030 ($ million)
Chart on US - Year-over-year growth 2025-2030 (%)
Data Table on US - Year-over-year growth 2025-2030 (%)

13.4.2 Canada - Market size and forecast 2025-2030

Chart on Canada - Market size and forecast 2025-2030 ($ million)
Data Table on Canada - Market size and forecast 2025-2030 ($ million)
Chart on Canada - Year-over-year growth 2025-2030 (%)
Data Table on Canada - Year-over-year growth 2025-2030 (%)

13.4.3 Mexico - Market size and forecast 2025-2030

Chart on Mexico - Market size and forecast 2025-2030 ($ million)
Data Table on Mexico - Market size and forecast 2025-2030 ($ million)
Chart on Mexico - Year-over-year growth 2025-2030 (%)
Data Table on Mexico - Year-over-year growth 2025-2030 (%)

13.5 Europe - Market size and forecast 2025-2030

Chart on Europe - Market size and forecast 2025-2030 ($ million)
Data Table on Europe - Market size and forecast 2025-2030 ($ million)
Chart on Europe - Year-over-year growth 2025-2030 (%)
Data Table on Europe - Year-over-year growth 2025-2030 (%)
Chart on Regional Comparison - Europe
Data Table on Regional Comparison - Europe

13.5.1 Germany - Market size and forecast 2025-2030

Chart on Germany - Market size and forecast 2025-2030 ($ million)
Data Table on Germany - Market size and forecast 2025-2030 ($ million)
Chart on Germany - Year-over-year growth 2025-2030 (%)
Data Table on Germany - Year-over-year growth 2025-2030 (%)

13.5.2 UK - Market size and forecast 2025-2030

Chart on UK - Market size and forecast 2025-2030 ($ million)
Data Table on UK - Market size and forecast 2025-2030 ($ million)
Chart on UK - Year-over-year growth 2025-2030 (%)
Data Table on UK - Year-over-year growth 2025-2030 (%)

13.5.3 France - Market size and forecast 2025-2030

Chart on France - Market size and forecast 2025-2030 ($ million)
Data Table on France - Market size and forecast 2025-2030 ($ million)
Chart on France - Year-over-year growth 2025-2030 (%)
Data Table on France - Year-over-year growth 2025-2030 (%)

13.5.4 Italy - Market size and forecast 2025-2030

Chart on Italy - Market size and forecast 2025-2030 ($ million)
Data Table on Italy - Market size and forecast 2025-2030 ($ million)
Chart on Italy - Year-over-year growth 2025-2030 (%)
Data Table on Italy - Year-over-year growth 2025-2030 (%)

13.5.5 Spain - Market size and forecast 2025-2030

Chart on Spain - Market size and forecast 2025-2030 ($ million)
Data Table on Spain - Market size and forecast 2025-2030 ($ million)
Chart on Spain - Year-over-year growth 2025-2030 (%)
Data Table on Spain - Year-over-year growth 2025-2030 (%)

13.5.6 The Netherlands - Market size and forecast 2025-2030

Chart on The Netherlands - Market size and forecast 2025-2030 ($ million)
Data Table on The Netherlands - Market size and forecast 2025-2030 ($ million)
Chart on The Netherlands - Year-over-year growth 2025-2030 (%)
Data Table on The Netherlands - Year-over-year growth 2025-2030 (%)

13.6 South America - Market size and forecast 2025-2030

Chart on South America - Market size and forecast 2025-2030 ($ million)
Data Table on South America - Market size and forecast 2025-2030 ($ million)
Chart on South America - Year-over-year growth 2025-2030 (%)
Data Table on South America - Year-over-year growth 2025-2030 (%)
Chart on Regional Comparison - South America
Data Table on Regional Comparison - South America

13.6.1 Brazil - Market size and forecast 2025-2030

Chart on Brazil - Market size and forecast 2025-2030 ($ million)
Data Table on Brazil - Market size and forecast 2025-2030 ($ million)
Chart on Brazil - Year-over-year growth 2025-2030 (%)
Data Table on Brazil - Year-over-year growth 2025-2030 (%)

13.6.2 Argentina - Market size and forecast 2025-2030

Chart on Argentina - Market size and forecast 2025-2030 ($ million)
Data Table on Argentina - Market size and forecast 2025-2030 ($ million)
Chart on Argentina - Year-over-year growth 2025-2030 (%)
Data Table on Argentina - Year-over-year growth 2025-2030 (%)

13.6.3 Chile - Market size and forecast 2025-2030

Chart on Chile - Market size and forecast 2025-2030 ($ million)
Data Table on Chile - Market size and forecast 2025-2030 ($ million)
Chart on Chile - Year-over-year growth 2025-2030 (%)
Data Table on Chile - Year-over-year growth 2025-2030 (%)

13.7 Middle East and Africa - Market size and forecast 2025-2030

Chart on Middle East and Africa - Market size and forecast 2025-2030 ($ million)
Data Table on Middle East and Africa - Market size and forecast 2025-2030 ($ million)
Chart on Middle East and Africa - Year-over-year growth 2025-2030 (%)
Data Table on Middle East and Africa - Year-over-year growth 2025-2030 (%)
Chart on Regional Comparison - Middle East and Africa
Data Table on Regional Comparison - Middle East and Africa

13.7.1 Saudi Arabia - Market size and forecast 2025-2030

Chart on Saudi Arabia - Market size and forecast 2025-2030 ($ million)
Data Table on Saudi Arabia - Market size and forecast 2025-2030 ($ million)
Chart on Saudi Arabia - Year-over-year growth 2025-2030 (%)
Data Table on Saudi Arabia - Year-over-year growth 2025-2030 (%)

13.7.2 UAE - Market size and forecast 2025-2030

Chart on UAE - Market size and forecast 2025-2030 ($ million)
Data Table on UAE - Market size and forecast 2025-2030 ($ million)
Chart on UAE - Year-over-year growth 2025-2030 (%)
Data Table on UAE - Year-over-year growth 2025-2030 (%)

13.7.3 South Africa - Market size and forecast 2025-2030

Chart on South Africa - Market size and forecast 2025-2030 ($ million)
Data Table on South Africa - Market size and forecast 2025-2030 ($ million)
Chart on South Africa - Year-over-year growth 2025-2030 (%)
Data Table on South Africa - Year-over-year growth 2025-2030 (%)

13.7.4 Turkey - Market size and forecast 2025-2030

Chart on Turkey - Market size and forecast 2025-2030 ($ million)
Data Table on Turkey - Market size and forecast 2025-2030 ($ million)
Chart on Turkey - Year-over-year growth 2025-2030 (%)
Data Table on Turkey - Year-over-year growth 2025-2030 (%)

13.7.5 Egypt - Market size and forecast 2025-2030

Chart on Egypt - Market size and forecast 2025-2030 ($ million)
Data Table on Egypt - Market size and forecast 2025-2030 ($ million)
Chart on Egypt - Year-over-year growth 2025-2030 (%)
Data Table on Egypt - Year-over-year growth 2025-2030 (%)

13.8 Market opportunity by geography

Market opportunity by geography ($ million)
Data Tables on Market opportunity by geography ($ million)

14. Drivers, Challenges, and Opportunity

14.1 Market drivers

Rising parental preference for STEM-based learning
Expansion of kidult consumer demographics
Integration of digital technologies and interactive hybrid play experiences

14.2 Market challenges

Escalating raw material costs and sustainable material transition pressures
Declining attention spans in youth demographics
Intellectual property infringement and brand protection liabilities

14.3 Impact of drivers and challenges

Impact of drivers and challenges in 2025 and 2030

14.4 Market opportunities

Transition toward sustainable bio-resins and circular manufacturing
Convergence of physical building sets with augmented reality
Expansion of direct-to-consumer omnichannel retail and brand flagships

15. Competitive Landscape

15.1 Overview

15.2

Overview on criticality of inputs and factors of differentiation

15.3 Landscape disruption

Overview on factors of disruption

15.4 Industry risks

Impact of key risks on business

16. Competitive Analysis

16.1 Companies profiled

Companies covered

16.2 Company ranking index

16.3 Market positioning of companies

Matrix on companies position and classification

16.4 BASIC FUN Inc.

BASIC FUN Inc. - Overview
BASIC FUN Inc. - Product / Service
BASIC FUN Inc. - Key offerings
SWOT

16.5 Cobi S.A.

Cobi S.A. - Overview
Cobi S.A. - Product / Service
Cobi S.A. - Key offerings
SWOT

16.6 Fat Brain Toys LLC

Fat Brain Toys LLC - Overview
Fat Brain Toys LLC - Product / Service
Fat Brain Toys LLC - Key offerings
SWOT

16.7 geobra Brandstatter Stiftung Co

geobra Brandstatter Stiftung Co - Overview
geobra Brandstatter Stiftung Co - Product / Service
geobra Brandstatter Stiftung Co - Key offerings
SWOT

16.8 Geomagworld SA

Geomagworld SA - Overview
Geomagworld SA - Product / Service
Geomagworld SA - Key offerings
SWOT

16.9 Guidecraft

Guidecraft - Overview
Guidecraft - Product / Service
Guidecraft - Key offerings
SWOT

16.10 Hasbro Inc.

Hasbro Inc. - Overview
Hasbro Inc. - Business segments
Hasbro Inc. - Key offerings
Hasbro Inc. - Segment focus
SWOT

16.11 LEGO System AS

LEGO System AS - Overview
LEGO System AS - Product / Service
LEGO System AS - Key offerings
SWOT

16.12 Maison Battat Inc.

Maison Battat Inc. - Overview
Maison Battat Inc. - Product / Service
Maison Battat Inc. - Key offerings
SWOT

16.13 Mattel Inc.

Mattel Inc. - Overview
Mattel Inc. - Business segments
Mattel Inc. - Key offerings
Mattel Inc. - Segment focus
SWOT

16.14 Melissa and Doug

Melissa and Doug - Overview
Melissa and Doug - Product / Service
Melissa and Doug - Key offerings
SWOT

16.15 Ravensburger AG

Ravensburger AG - Overview
Ravensburger AG - Product / Service
Ravensburger AG - Key offerings
SWOT

16.16 Spin Master Corp.

Spin Master Corp. - Overview
Spin Master Corp. - Business segments
Spin Master Corp. - Key offerings
Spin Master Corp. - Segment focus
SWOT

16.17 Tegu Inc.

Tegu Inc. - Overview
Tegu Inc. - Product / Service
Tegu Inc. - Key offerings
SWOT

16.18 VTech Holdings Ltd.

VTech Holdings Ltd. - Overview
VTech Holdings Ltd. - Business segments
VTech Holdings Ltd. - Key offerings
VTech Holdings Ltd. - Segment focus
SWOT

17. Appendix

17.1 Scope of the report

Market definition
Objectives
Notes and caveats

17.2 Inclusions and exclusions checklist

Inclusions checklist
Exclusions checklist

17.3 Currency conversion rates for US$

17.4 Research methodology

17.5 Data procurement

Information sources

17.6 Data validation

17.7 Validation techniques employed for market sizing

17.8 Data synthesis

17.9 360 degree market analysis

17.10 List of abbreviations

Research Methodology

Technavio presents a detailed picture of the market by way of study, synthesis, and summation of data from multiple sources. The analysts have presented the various facets of the market with a particular focus on identifying the key industry influencers. The data thus presented is comprehensive, reliable, and the result of extensive research, both primary and secondary.

INFORMATION SOURCES

Primary sources

  • Manufacturers and suppliers
  • Channel partners
  • Industry experts
  • Strategic decision makers

Secondary sources

  • Industry journals and periodicals
  • Government data
  • Financial reports of key industry players
  • Historical data
  • Press releases

DATA ANALYSIS

Data Synthesis

  • Collation of data
  • Estimation of key figures
  • Analysis of derived insights

Data Validation

  • Triangulation with data models
  • Reference against proprietary databases
  • Corroboration with industry experts

REPORT WRITING

Qualitative

  • Market drivers
  • Market challenges
  • Market trends
  • Five forces analysis

Quantitative

  • Market size and forecast
  • Market segmentation
  • Geographical insights
  • Competitive landscape

Interested in this report?

Get your sample now to see our research methodology and insights!

Download Now

Frequently Asked Questions

Construction Toys market growth will increase by USD 2119.7 million during 2026-2030.

The Construction Toys market is expected to grow at a CAGR of 3.7% during 2026-2030.

Construction Toys market is segmented by Distribution channel (Offline, Online) Type (Bricks and blocks, Tinker toys, Others) Material (Polymer, Wood, Metal) Age group (School age, Preschool, Toddlers, Teenagers)

BASIC FUN Inc., Cobi S.A., Eitech GbmH, Fat Brain Toys LLC, geobra Brandstatter Stiftung Co, Geomagworld SA, Guidecraft, Hasbro Inc., LEGO System AS, Magformers LLC, Maison Battat Inc., Mattel Inc., Melissa and Doug, Plus Plus AS, Polydron UK Ltd, Ravensburger AG, Spin Master Corp., Strictly Briks, Tegu Inc., VTech Holdings Ltd. are a few of the key vendors in the Construction Toys market.

APAC will register the highest growth rate of 46.3% among the other regions. Therefore, the Construction Toys market in APAC is expected to garner significant business opportunities for the vendors during the forecast period.

China, Japan, India, South Korea, Australia, Indonesia, US, Canada, Mexico, Germany, UK, France, Italy, Spain, The Netherlands, Brazil, Argentina, Chile, Saudi Arabia, UAE, South Africa, Turkey, Egypt

  • Rising parental preference for STEM-based learning is the driving factor this market.

The Construction Toys market vendors should focus on grabbing business opportunities from the Distribution channel segment as it accounted for the largest market share in the base year.
RIA - Research AI Assistant
Ask RIA
