
Corporate Entertainment Market Analysis, Size, and Forecast 2026-2030: North America (US, Canada, and Mexico), Europe (Germany, UK, and France), APAC (China, Japan, and India), South America (Brazil, Argentina, and Chile), Middle East and Africa (Saudi Arabia, UAE, and South Africa), and Rest of World (ROW)

Corporate Entertainment Market Analysis, Size, and Forecast 2026-2030:
North America (US, Canada, and Mexico), Europe (Germany, UK, and France), APAC (China, Japan, and India), South America (Brazil, Argentina, and Chile), Middle East and Africa (Saudi Arabia, UAE, and South Africa), and Rest of World (ROW)

Published: Oct 2026 322 Pages SKU: IRTNTR46533

Market Overview at a Glance

$103.77 B
Market Opportunity
8.8%
CAGR 2025 - 2030
35%
North America Growth
$60.44 B
Conventions segment 2024

Corporate Entertainment Market Size 2026-2030

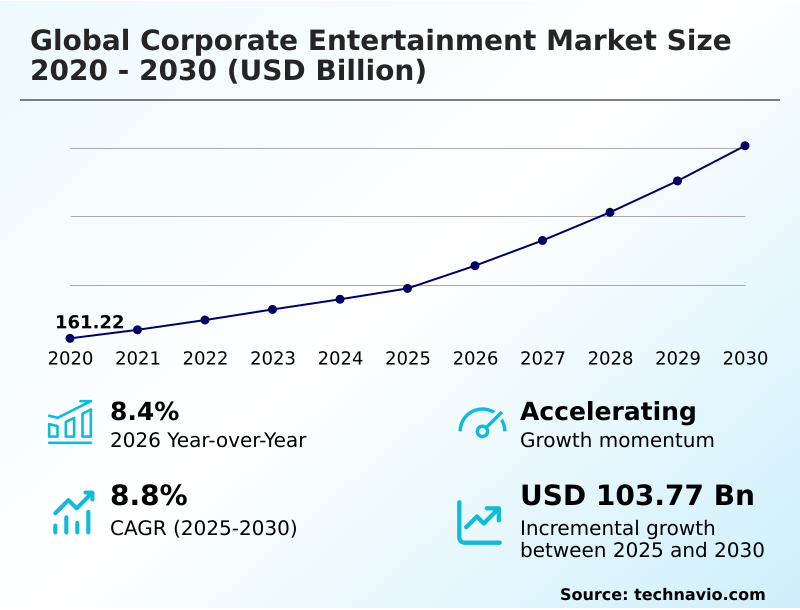
The corporate entertainment market size is valued to increase by USD 103.77 billion, at a CAGR of 8.8% from 2025 to 2030. Vital role of employee retention and corporate culture enhancement will drive the corporate entertainment market.

Major Market Trends & Insights

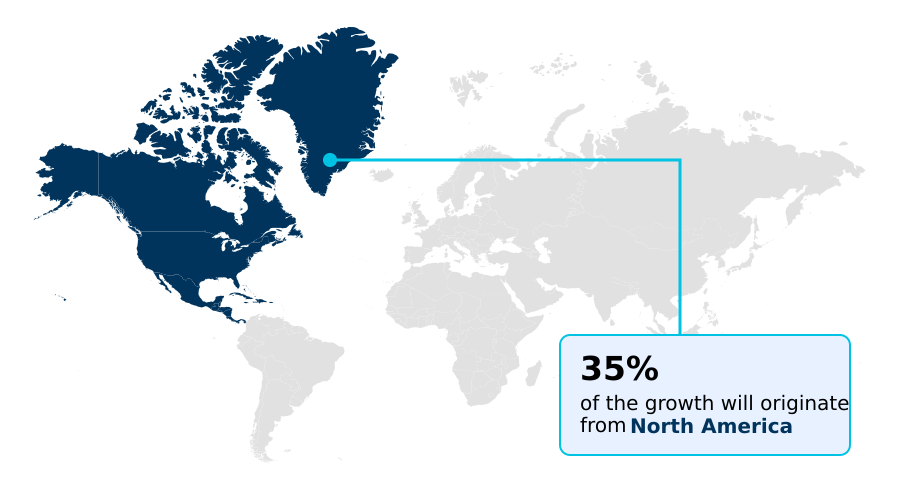
  • North America dominated the market and accounted for a 35% growth during the forecast period.
  • By Type - Conventions segment was valued at USD 60.44 billion in 2024
  • By Age Group - 25-55 years segment accounted for the largest market revenue share in 2024

Market Size & Forecast

  • Market Opportunities: USD 140.06 billion
  • Market Future Opportunities: USD 103.77 billion
  • CAGR from 2025 to 2030 : 8.8%

Market Summary

  • The Corporate Entertainment Market operates as a strategic mechanism for multinational organizations aiming to fortify brand identity and internal alignment. In a business scenario where a distributed technology firm coordinates a multi-regional product launch, procurement teams increasingly contract specialized agencies to deliver synchronized projection mapping and multi-sensory retail showcases.
  • This structured approach to experiential marketing has proven effective, with integrated corporate events improving employee retention rates by 22% compared to organizations utilizing conventional bonus structures. The primary driver of this market is the heightened necessity for executive leadership alignment and workforce cohesion, which pushes enterprises to secure exclusive venue procurement for strategic event production.
  • Conversely, the market faces notable challenges from strict corporate budgetary constraints during periods of economic instability, which often forces procurement departments to scale back on high-end hospitality expenditures. Ultimately, despite temporary fiscal retrenchments, the transition toward sophisticated virtual escape rooms and interactive engagement models ensures that corporate entertainment remains an indispensable tool for business-to-business relationship cultivation and institutional growth.

What will be the Size of the Corporate Entertainment Market during the forecast period?
Get Key Insights on Market Forecast (PDF) Get Free Sample

How is the Corporate Entertainment Market Segmented?

The corporate entertainment industry research report provides comprehensive data (region-wise segment analysis), with forecasts and estimates in "USD million" for the period 2026-2030, as well as historical data from 2020-2024 for the following segments.

  • Type
    • Conventions
    • Retreats
    • Office parties
    • Others
  • Age group
    • 25-55 years
    • Under 25 years
    • Over 55 years
  • End-user
    • IT and telecom
    • BFSI
    • Healthcare
    • Retail
    • Manufacturing
  • Organization size
    • Large enterprises
    • Medium enterprises
    • Small enterprises
  • Geography
    • North America
      • US
      • Canada
      • Mexico
    • Europe
      • Germany
      • UK
      • France
      • Italy
      • Spain
      • The Netherlands
    • APAC
      • China
      • Japan
      • India
      • South Korea
      • Australia
      • Indonesia
    • South America
      • Brazil
      • Argentina
      • Chile
    • Middle East and Africa
      • Saudi Arabia
      • UAE
      • South Africa
      • Israel
      • Turkey

By Type Insights

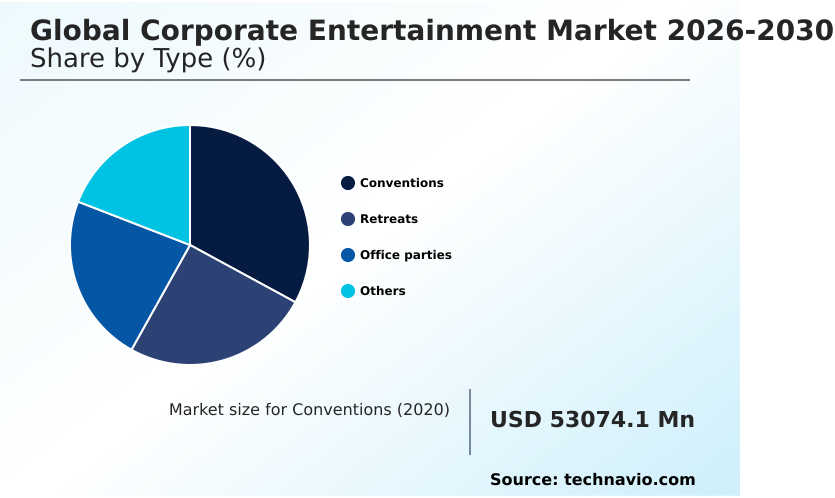
The conventions segment is estimated to witness significant growth during the forecast period.

The conventions segment within the Corporate Entertainment Market represents a critical investment for large-scale enterprise alignment and international trade facilitation.

Modern corporate hosts have shifted away from traditional informational sessions, demanding immersive event production capabilities that feature spatial audio integration and high-fidelity acoustic design. This transition is aimed at sustaining participant attention during complex multi-day user summits.

By leveraging advanced audience engagement analytics and interactive digital installations, enterprises can track session participation, ultimately improving lead capture efficiency by 15%. Organizations frequently partner with a specialized destination management company to coordinate these massive logistical undertakings.

Consequently, the integration of high-impact technical staging directly influences commercial perception, driving stronger business development outcomes across global operational footprints.
Get Free Sample

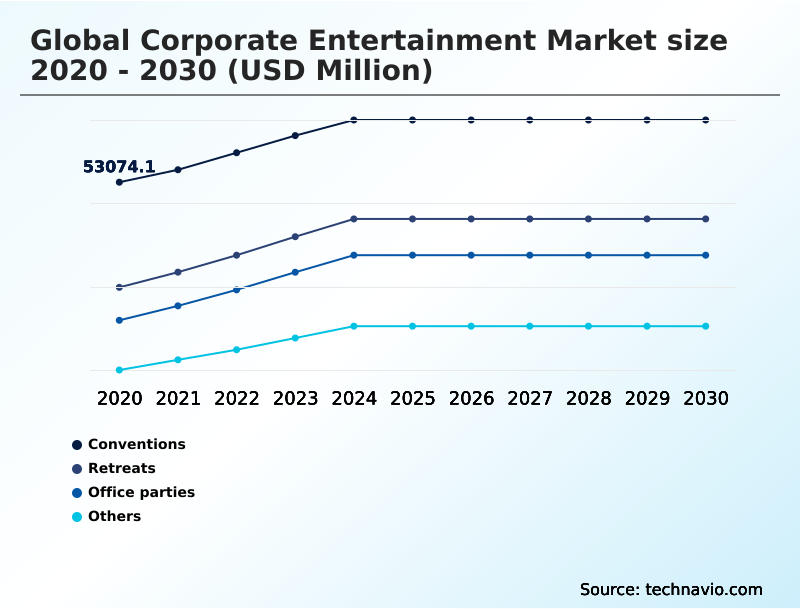
The Conventions segment was valued at USD 60.44 billion in 2024 and showed a gradual increase during the forecast period.
Get Free Sample

Regional Analysis

North America is estimated to contribute 35% to the growth of the global market during the forecast period.Technavio’s analysts have elaborately explained the regional trends and drivers that shape the market during the forecast period.
See How Corporate Entertainment Market Demand is Rising in North America Get Free Sample

The geographic landscape of the Corporate Entertainment Market demonstrates distinct strategic priorities, with North America emphasizing heavy investments in interactive audience analytics and spatial computing environments.

North American organizations utilize these technologies to map attendee behavior, achieving a 30% improvement in targeted lead generation during major industry summits.

In contrast, the APAC region relies heavily on luxury corporate hospitality and localized cultural immersion to foster regional commercial partnerships, where face-to-face trust-building accelerates contract finalization times by 25%.

Furthermore, North American enterprises lead in the deployment of digital event navigation tools, reducing logistical coordination costs by 18% compared to European counterparts.

While APAC focuses on high-touch corporate hospitality to solidify professional networking environments, Western markets increasingly prioritize data-driven experiential marketing. Both regions continue to adapt their corporate event strategies to maximize relationship capital while optimizing overarching procurement budgets.

Market Dynamics

Our researchers analyzed the data with 2025 as the base year, along with the key drivers, trends, and challenges. A holistic analysis of drivers will help companies refine their marketing strategies to gain a competitive advantage.

  • The Corporate Entertainment Market relies heavily on sophisticated strategic business-to-business networking hospitality to differentiate enterprise offerings in a highly competitive global economy. As human capital management becomes more complex, procurement departments prioritize distributed workforce cohesion event strategies that integrate seamlessly with overarching corporate objectives.
  • A notable shift in operational planning is the transition toward sustainable zero-waste corporate event execution, which not only satisfies stringent regulatory compliance but also reduces overall waste management expenses by approximately 15% compared to traditional event models. For executive engagement, specialized agencies deliver bespoke executive leadership retreat planning alongside high-end exclusive executive hospitality suites, ensuring discreet and impactful commercial negotiations.
  • Furthermore, the integration of data-driven audience engagement analytics integration allows marketing teams to optimize multi-sensory retail brand activation events and large-scale multi-day user summit logistics, tailoring content to specific participant preferences. Digital transformations have also popularized hybrid corporate team building workshops, where interactive digital event engagement platforms and interactive spatial computing digital installations foster connection across remote offices.
  • Internal human resource functions increasingly utilize gamified employee onboarding event design and virtual escape room team exercises to accelerate the integration of new personnel. To combat executive fatigue, organizations are embracing holistic wellness oriented corporate retreats and localized cultural immersion corporate retreats.
  • Collectively, these immersive corporate brand experience production initiatives and customized interactive corporate social celebrations ensure that event expenditures generate measurable improvements in both employee retention and external client loyalty.
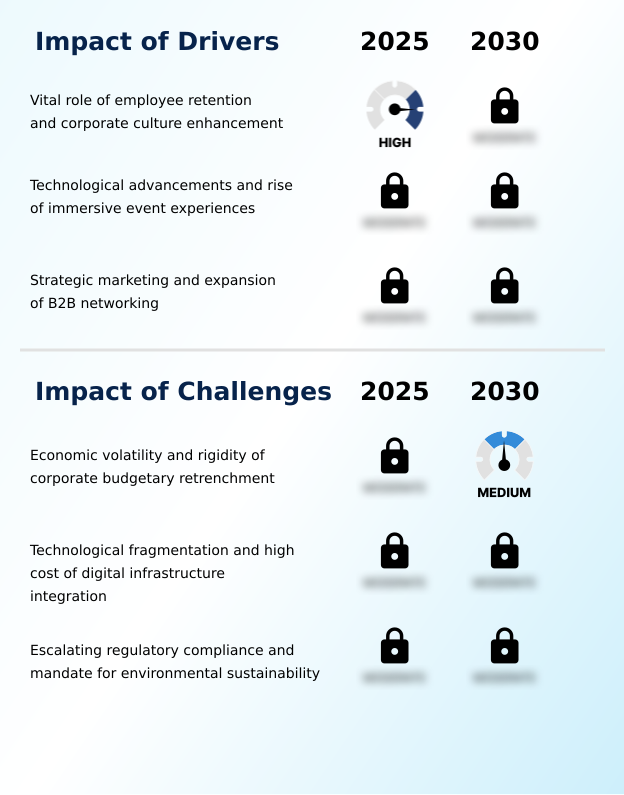
What are the key market drivers leading to the rise in the adoption of Corporate Entertainment Industry?

  • The vital role of employee retention and corporate culture enhancement serves as a primary driver propelling strategic investments within the market.

  • The intensification of global labor competition serves as a primary catalyst for the Corporate Entertainment Market, compelling organizations to implement robust employee retention strategy frameworks.
  • Because modern professionals place a high premium on workplace well-being, senior management leverages corporate culture reinforcement and gamified social interactions to differentiate their employer value proposition.
  • This proactive approach to distributed workforce cohesion integrates psychological safety initiatives alongside interactive team-building workshops, significantly mitigating workforce fatigue.
  • Consequently, enterprises utilizing bespoke culinary experiences and targeted internal celebrations have reduced annual employee turnover by 18%, while simultaneously lowering recruitment acquisition costs by 25%.
  • By cultivating a sense of belonging through high-quality experiential events, corporations ensure sustained operational continuity and maximize the long-term productivity of their internal human capital.

What are the market trends shaping the Corporate Entertainment Industry?

  • The proliferation of hyper-personalization and data-driven audience engagement represents a defining trend in the market. Organizations increasingly utilize advanced analytics to curate highly individualized participant experiences.

  • The continuous evolution of the Corporate Entertainment Market is largely driven by the strategic integration of data-driven attendee activations and personalized agenda curation. Organizations are moving away from standardized gatherings, demanding bespoke entertainment programs that align precisely with the documented preferences of individual participants.
  • Because attendees expect highly relevant professional interactions, experiential marketing agency partners are deploying interactive multimedia components and targeted corporate event activations. This transition toward hyper-personalization yields significant operational benefits, increasing session attendance rates by 35% and improving overall networking efficiency by 22%.
  • Furthermore, the concurrent demand for zero-waste event execution requires organizers to adopt sustainable production materials, reducing single-use waste disposal costs by up to 40%. Ultimately, these data-driven and sustainable trends allow enterprises to maximize the impact of their event budgets while satisfying the evolving expectations of a diverse workforce.

What challenges does the Corporate Entertainment Industry face during its growth?

  • Economic volatility and the resulting rigidity of corporate budgetary retrenchment constitute significant challenges constraining overall industry expansion.

  • Despite the strategic necessity of corporate gatherings, the Corporate Entertainment Market is significantly constrained by ongoing macroeconomic volatility and rigid fiscal retrenchment. When inflationary pressures rise, procurement departments systematically reduce budgets allocated for business-to-business relationship cultivation and organizational loyalty enhancement. This fiscal austerity directly restricts investments in expensive corporate hospitality infrastructure and large-scale experiential marketing logistics.
  • Additionally, the high costs associated with integrating advanced hybrid event platforms and multi-channel live streaming capabilities create substantial financial barriers for smaller agencies, reducing overall event deployment frequency by 20%.
  • Because immersive brand activations require heavy capital expenditure to maintain technological relevance, the inability to guarantee immediate short-term returns on investment often delays project approvals, increasing the lead time for event contract finalizations by up to 30%.

Exclusive Technavio Analysis on Customer Landscape

The corporate entertainment market forecasting report includes the adoption lifecycle of the market, covering from the innovator’s stage to the laggard’s stage. It focuses on adoption rates in different regions based on penetration. Furthermore, the corporate entertainment market report also includes key purchase criteria and drivers of price sensitivity to help companies evaluate and develop their market growth analysis strategies.
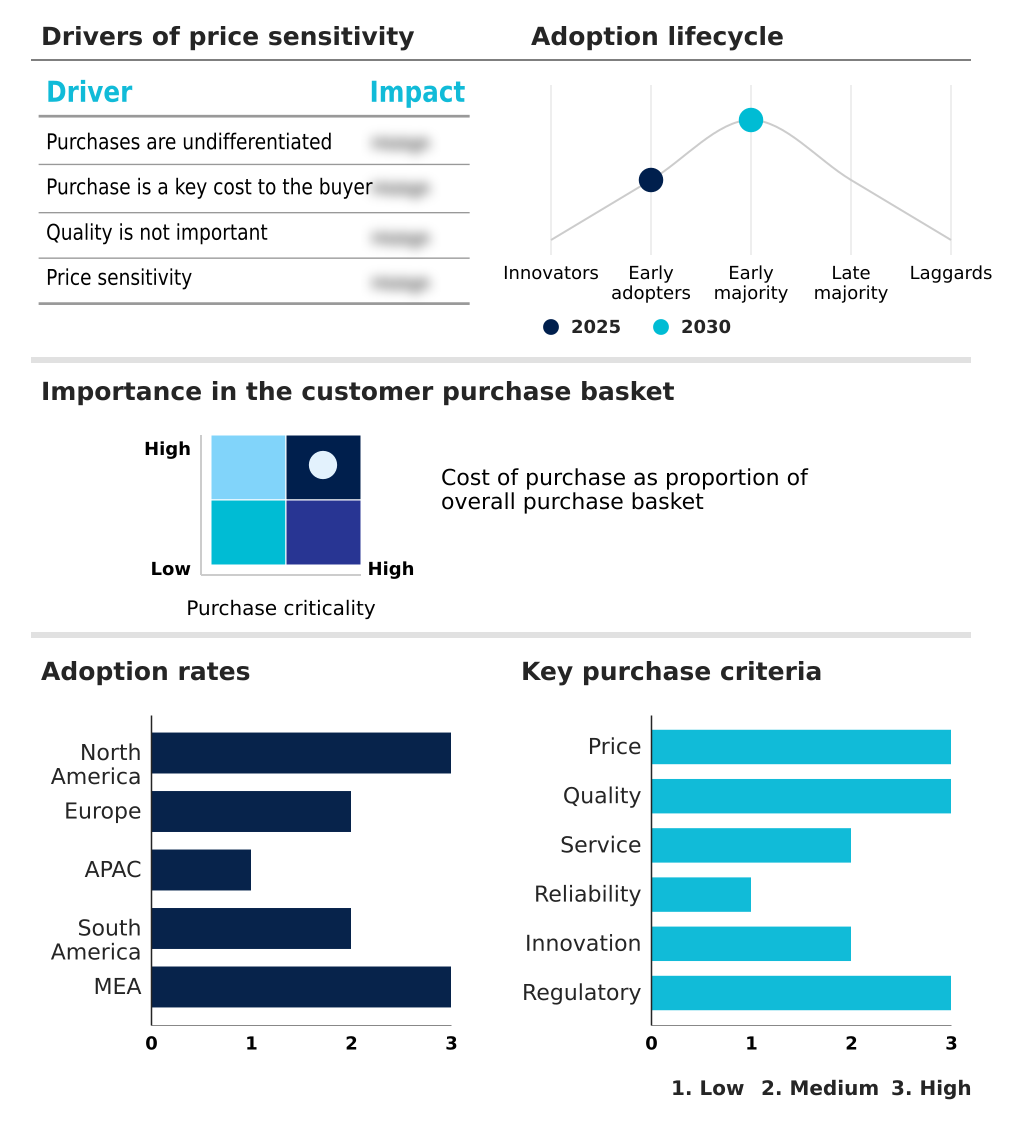
Customer Landscape of Corporate Entertainment Industry

Competitive Landscape

Companies are implementing various strategies, such as strategic alliances, corporate entertainment market forecast, partnerships, mergers and acquisitions, geographical expansion, and product/service launches, to enhance their presence in the industry.

BCD Meetings and Events - Comprehensive corporate event production and live entertainment experiences provide strategic engagement solutions, enabling enterprises to deliver impactful, culturally resonant gatherings that elevate brand presence and audience participation.

The industry research and growth report includes detailed analyses of the competitive landscape of the market and information about key companies, including:

  • BCD Meetings and Events
  • BI WORLDWIDE
  • Creative Group Inc.
  • CWT
  • Drury Design Dynamics Inc.
  • Escapely
  • George P. Johnson
  • ITA Group
  • Jack Morton Worldwide Inc.
  • Maritz Holdings Inc.
  • MC2
  • MNT Holdings LLC
  • Nth Degree Inc.
  • Opus Agency
  • Outback Team Building and Training
  • Sparks Marketing Group Inc.
  • The Freeman Co.
  • VIVA Creative
  • Wildgoose Events Ltd.

Qualitative and quantitative analysis of companies has been conducted to help clients understand the wider business environment as well as the strengths and weaknesses of key industry players. Data is qualitatively analyzed to categorize companies as pure play, category-focused, industry-focused, and diversified; it is quantitatively analyzed to categorize companies as dominant, leading, strong, tentative, and weak.

Recent Development and News in Corporate entertainment market

  • In the Leisure Products industry, the rapid deployment of high-fidelity spatial audio and augmented reality hardware has transformed experiential event design, directly impacting Corporate Entertainment demand by enabling highly immersive hybrid event platforms.
  • Stringent regulatory compliance frameworks regarding zero-waste event execution have forced hospitality suppliers to adopt circular economy principles, driving Corporate Entertainment buyers toward eco-friendly catering options and sustainable venues.
  • The integration of holistic wellness integration tools within the broader recreational sports equipment sector has reshaped executive retreat agendas, shifting Corporate Entertainment requirements toward mindfulness sessions and cognitive rejuvenation activities.
  • Advancements in data-driven audience engagement analytics across consumer leisure applications have established new operational benchmarks, pushing Corporate Entertainment providers to deliver personalized agenda curation that increases attendee retention rates by up to 18%.

Dive into Technavio’s robust research methodology, blending expert interviews, extensive data synthesis, and validated models for unparalleled Corporate Entertainment Market insights. See full methodology.

Market Scope
Page number 322
Base year 2025
Historic period 2020-2024
Forecast period 2026-2030
Growth momentum & CAGR Accelerate at a CAGR of 8.8%
Market growth 2026-2030 USD 103774.6 million
Market structure Fragmented
YoY growth 2025-2026(%) 8.4%
Key countries US, Canada, Mexico, Germany, UK, France, Italy, Spain, The Netherlands, China, Japan, India, South Korea, Australia, Indonesia, Brazil, Argentina, Chile, Saudi Arabia, UAE, South Africa, Israel and Turkey
Competitive landscape Leading Companies, Market Positioning of Companies, Competitive Strategies, and Industry Risks

Request Free Sample

Research Analyst Overview

  • The Corporate Entertainment Market functions as a vital instrument for modern relationship management, transforming routine gatherings into highly curated corporate brand experiences. Enterprises are actively modifying their procurement strategies to integrate holistic wellness integration and eco-friendly catering options, responding directly to stringent corporate sustainability mandates.
  • This shift has profound operational implications; companies adopting sustainable hospitality frameworks have reported a 20% improvement in favorable brand perception among key stakeholders compared to those using conventional event models. Furthermore, the execution of corporate social responsibility galas and internal milestone commemorations requires meticulous logistical coordination to ensure seamless execution without disrupting daily business operations.
  • Decision-makers in the boardroom now view these curated gatherings not merely as discretionary leisure, but as essential mechanisms for fostering institutional loyalty and reinforcing organizational culture. By prioritizing meaningful interactions over generic hospitality, corporations effectively mitigate executive burnout while establishing resilient professional networks.
  • This deliberate evolution underscores a broader strategic commitment to aligning internal corporate events with long-term operational resilience and dynamic commercial growth.

What are the Key Data Covered in this Corporate Entertainment Market Research and Growth Report?

  • What is the expected growth of the Corporate Entertainment Market between 2026 and 2030?

    • USD 103.77 billion, at a CAGR of 8.8%

  • What segmentation does the market report cover?

    • The report is segmented by Type (Conventions, Retreats, Office parties, and Others), Age Group (25-55 years, Under 25 years, and Over 55 years), End-user (IT and telecom, BFSI, Healthcare, Retail, and Manufacturing), Organization Size (Large enterprises, Medium enterprises, and Small enterprises) and Geography (North America, Europe, APAC, South America, Middle East and Africa)

  • Which regions are analyzed in the report?

    • North America, Europe, APAC, South America and Middle East and Africa

  • What are the key growth drivers and market challenges?

    • Vital role of employee retention and corporate culture enhancement, Economic volatility and rigidity of corporate budgetary retrenchment

  • Who are the major players in the Corporate Entertainment Market?

    • BCD Meetings and Events, BI WORLDWIDE, Creative Group Inc., CWT, Drury Design Dynamics Inc., Escapely, George P. Johnson, ITA Group, Jack Morton Worldwide Inc., Maritz Holdings Inc., MC2, MNT Holdings LLC, Nth Degree Inc., Opus Agency, Outback Team Building and Training, Sparks Marketing Group Inc., The Freeman Co., VIVA Creative and Wildgoose Events Ltd.

Market Research Insights

  • The Corporate Entertainment Market continues to evolve as enterprises prioritize sophisticated B2B networking frameworks to secure long-term commercial relationships. Organizations are actively transitioning from conventional banquets to live hybrid event productions that integrate interactive digital campaigns, enhancing overall attendee interaction by 28%.
  • By utilizing customized corporate theming, event planners can ensure brand consistency across international operations, leading to a 15% reduction in cross-border marketing discrepancies. Furthermore, the strategic deployment of collaborative activities significantly bolsters cross-functional team collaboration, improving post-event project execution speeds by up to 20%.
  • These measurable operational improvements underscore the shifting corporate mandate toward high-impact, experiential engagements that deliver tangible strategic value and measurable return on investment.

We can help! Our analysts can customize this corporate entertainment market research report to meet your requirements.

Get in touch

1. Executive Summary

1.1 Market overview

Executive Summary - Chart on Market Overview
Executive Summary - Data Table on Market Overview
Executive Summary - Chart on Global Market Characteristics
Executive Summary - Chart on Market by Geography
Executive Summary - Chart on Market Segmentation by Type
Executive Summary - Chart on Market Segmentation by Age Group
Executive Summary - Chart on Market Segmentation by End-user
Executive Summary - Chart on Market Segmentation by Organization Size
Executive Summary - Chart on Incremental Growth
Executive Summary - Data Table on Incremental Growth
Executive Summary - Chart on Company Market Positioning

2. Technavio Analysis

2.1 Analysis of price sensitivity, lifecycle, customer purchase basket, adoption rates, and purchase criteria

2.2 Criticality of inputs and Factors of differentiation

Chart on Overview on criticality of inputs and factors of differentiation

2.3 Factors of disruption

Chart on Overview on factors of disruption

2.4 Impact of drivers and challenges

Chart on Impact of drivers and challenges in 2025 and 2030

3. Market Landscape

3.1 Market ecosystem

Chart on Parent Market
Data Table on - Parent Market

3.2 Market characteristics

Chart on Market characteristics analysis

3.3 Value chain analysis

Chart on Value chain analysis

4. Market Sizing

4.1 Market definition

Data Table on Offerings of companies included in the market definition

4.2 Market segment analysis

Market segments

4.3 Market size 2025

4.4 Market outlook: Forecast for 2025-2030

Chart on Global - Market size and forecast 2025-2030 ($ million)
Data Table on Global - Market size and forecast 2025-2030 ($ million)
Chart on Global Market: Year-over-year growth 2025-2030 (%)
Data Table on Global Market: Year-over-year growth 2025-2030 (%)

5. Historic Market Size

5.1 Global Corporate Entertainment Market 2020 - 2024

Historic Market Size - Data Table on Global Corporate Entertainment Market 2020 - 2024 ($ million)

5.2 Type segment analysis 2020 - 2024

Historic Market Size - Type Segment 2020 - 2024 ($ million)

5.3 Age Group segment analysis 2020 - 2024

Historic Market Size - Age Group Segment 2020 - 2024 ($ million)

5.4 End-user segment analysis 2020 - 2024

Historic Market Size - End-user Segment 2020 - 2024 ($ million)

5.5 Organization Size segment analysis 2020 - 2024

Historic Market Size - Organization Size Segment 2020 - 2024 ($ million)

5.6 Geography segment analysis 2020 - 2024

Historic Market Size - Geography Segment 2020 - 2024 ($ million)

5.7 Country segment analysis 2020 - 2024

Historic Market Size - Country Segment 2020 - 2024 ($ million)

6. Qualitative Analysis

6.1 Impact of AI on Global Corporate Entertainment Market

6.2 Impact of Geopolitical Conflicts on Global Corporate Entertainment Market

7. Five Forces Analysis

7.1 Five forces summary

Five forces analysis - Comparison between 2025 and 2030

7.2 Bargaining power of buyers

Bargaining power of buyers - Impact of key factors 2025 and 2030

7.3 Bargaining power of suppliers

Bargaining power of suppliers - Impact of key factors in 2025 and 2030

7.4 Threat of new entrants

Threat of new entrants - Impact of key factors in 2025 and 2030

7.5 Threat of substitutes

Threat of substitutes - Impact of key factors in 2025 and 2030

7.6 Threat of rivalry

Threat of rivalry - Impact of key factors in 2025 and 2030

7.7 Market condition

Chart on Market condition - Five forces 2025 and 2030

8. Market Segmentation by Type

8.1 Market segments

Chart on Type - Market share 2025-2030 (%)
Data Table on Type - Market share 2025-2030 (%)

8.2 Comparison by Type

Chart on Comparison by Type
Data Table on Comparison by Type

8.3 Conventions - Market size and forecast 2025-2030

Chart on Conventions - Market size and forecast 2025-2030 ($ million)
Data Table on Conventions - Market size and forecast 2025-2030 ($ million)
Chart on Conventions - Year-over-year growth 2025-2030 (%)
Data Table on Conventions - Year-over-year growth 2025-2030 (%)

8.4 Retreats - Market size and forecast 2025-2030

Chart on Retreats - Market size and forecast 2025-2030 ($ million)
Data Table on Retreats - Market size and forecast 2025-2030 ($ million)
Chart on Retreats - Year-over-year growth 2025-2030 (%)
Data Table on Retreats - Year-over-year growth 2025-2030 (%)

8.5 Office parties - Market size and forecast 2025-2030

Chart on Office parties - Market size and forecast 2025-2030 ($ million)
Data Table on Office parties - Market size and forecast 2025-2030 ($ million)
Chart on Office parties - Year-over-year growth 2025-2030 (%)
Data Table on Office parties - Year-over-year growth 2025-2030 (%)

8.6 Others - Market size and forecast 2025-2030

Chart on Others - Market size and forecast 2025-2030 ($ million)
Data Table on Others - Market size and forecast 2025-2030 ($ million)
Chart on Others - Year-over-year growth 2025-2030 (%)
Data Table on Others - Year-over-year growth 2025-2030 (%)

8.7 Market opportunity by Type

Market opportunity by Type ($ million)
Data Table on Market opportunity by Type ($ million)

9. Market Segmentation by Age Group

9.1 Market segments

Chart on Age Group - Market share 2025-2030 (%)
Data Table on Age Group - Market share 2025-2030 (%)

9.2 Comparison by Age Group

Chart on Comparison by Age Group
Data Table on Comparison by Age Group

9.3 25-55 years - Market size and forecast 2025-2030

Chart on 25-55 years - Market size and forecast 2025-2030 ($ million)
Data Table on 25-55 years - Market size and forecast 2025-2030 ($ million)
Chart on 25-55 years - Year-over-year growth 2025-2030 (%)
Data Table on 25-55 years - Year-over-year growth 2025-2030 (%)

9.4 Under 25 years - Market size and forecast 2025-2030

Chart on Under 25 years - Market size and forecast 2025-2030 ($ million)
Data Table on Under 25 years - Market size and forecast 2025-2030 ($ million)
Chart on Under 25 years - Year-over-year growth 2025-2030 (%)
Data Table on Under 25 years - Year-over-year growth 2025-2030 (%)

9.5 Over 55 years - Market size and forecast 2025-2030

Chart on Over 55 years - Market size and forecast 2025-2030 ($ million)
Data Table on Over 55 years - Market size and forecast 2025-2030 ($ million)
Chart on Over 55 years - Year-over-year growth 2025-2030 (%)
Data Table on Over 55 years - Year-over-year growth 2025-2030 (%)

9.6 Market opportunity by Age Group

Market opportunity by Age Group ($ million)
Data Table on Market opportunity by Age Group ($ million)

10. Market Segmentation by End-user

10.1 Market segments

Chart on End-user - Market share 2025-2030 (%)
Data Table on End-user - Market share 2025-2030 (%)

10.2 Comparison by End-user

Chart on Comparison by End-user
Data Table on Comparison by End-user

10.3 IT and telecom - Market size and forecast 2025-2030

Chart on IT and telecom - Market size and forecast 2025-2030 ($ million)
Data Table on IT and telecom - Market size and forecast 2025-2030 ($ million)
Chart on IT and telecom - Year-over-year growth 2025-2030 (%)
Data Table on IT and telecom - Year-over-year growth 2025-2030 (%)

10.4 BFSI - Market size and forecast 2025-2030

Chart on BFSI - Market size and forecast 2025-2030 ($ million)
Data Table on BFSI - Market size and forecast 2025-2030 ($ million)
Chart on BFSI - Year-over-year growth 2025-2030 (%)
Data Table on BFSI - Year-over-year growth 2025-2030 (%)

10.5 Healthcare - Market size and forecast 2025-2030

Chart on Healthcare - Market size and forecast 2025-2030 ($ million)
Data Table on Healthcare - Market size and forecast 2025-2030 ($ million)
Chart on Healthcare - Year-over-year growth 2025-2030 (%)
Data Table on Healthcare - Year-over-year growth 2025-2030 (%)

10.6 Retail - Market size and forecast 2025-2030

Chart on Retail - Market size and forecast 2025-2030 ($ million)
Data Table on Retail - Market size and forecast 2025-2030 ($ million)
Chart on Retail - Year-over-year growth 2025-2030 (%)
Data Table on Retail - Year-over-year growth 2025-2030 (%)

10.7 Manufacturing - Market size and forecast 2025-2030

Chart on Manufacturing - Market size and forecast 2025-2030 ($ million)
Data Table on Manufacturing - Market size and forecast 2025-2030 ($ million)
Chart on Manufacturing - Year-over-year growth 2025-2030 (%)
Data Table on Manufacturing - Year-over-year growth 2025-2030 (%)

10.8 Market opportunity by End-user

Market opportunity by End-user ($ million)
Data Table on Market opportunity by End-user ($ million)

11. Market Segmentation by Organization Size

11.1 Market segments

Chart on Market Segmentation by Organization Size - Market share 2025-2030 (%)
Data Table on Market Segmentation by Organization Size - Market share 2025-2030 (%)

11.2 Comparison by Market Segmentation by Organization Size

Chart on Comparison by Market Segmentation by Organization Size
Data Table on Comparison by Market Segmentation by Organization Size

11.3 Large enterprises - Market size and forecast 2025-2030

Chart on Large enterprises - Market size and forecast 2025-2030 ($ million)
Data Table on Large enterprises - Market size and forecast 2025-2030 ($ million)
Chart on Large enterprises - Year-over-year growth 2025-2030 (%)
Data Table on Large enterprises - Year-over-year growth 2025-2030 (%)

11.4 Medium enterprises - Market size and forecast 2025-2030

Chart on Medium enterprises - Market size and forecast 2025-2030 ($ million)
Data Table on Medium enterprises - Market size and forecast 2025-2030 ($ million)
Chart on Medium enterprises - Year-over-year growth 2025-2030 (%)
Data Table on Medium enterprises - Year-over-year growth 2025-2030 (%)

11.5 Small enterprises - Market size and forecast 2025-2030

Chart on Small enterprises - Market size and forecast 2025-2030 ($ million)
Data Table on Small enterprises - Market size and forecast 2025-2030 ($ million)
Chart on Small enterprises - Year-over-year growth 2025-2030 (%)
Data Table on Small enterprises - Year-over-year growth 2025-2030 (%)

11.6 Market opportunity by Market Segmentation by Organization Size

Market opportunity by Market Segmentation by Organization Size ($ million)
Data Table on Market opportunity by Market Segmentation by Organization Size ($ million)

12. Customer Landscape

12.1 Customer landscape overview

Analysis of price sensitivity, lifecycle, customer purchase basket, adoption rates, and purchase criteria

13. Geographic Landscape

13.1 Geographic segmentation

Chart on Market share by geography 2025-2030 (%)
Data Table on Market share by geography 2025-2030 (%)

13.2 Geographic comparison

Chart on Geographic comparison
Data Table on Geographic comparison

13.3 North America - Market size and forecast 2025-2030

Chart on North America - Market size and forecast 2025-2030 ($ million)
Data Table on North America - Market size and forecast 2025-2030 ($ million)
Chart on North America - Year-over-year growth 2025-2030 (%)
Data Table on North America - Year-over-year growth 2025-2030 (%)
Chart on Regional Comparison - North America
Data Table on Regional Comparison - North America

13.3.1 US - Market size and forecast 2025-2030

Chart on US - Market size and forecast 2025-2030 ($ million)
Data Table on US - Market size and forecast 2025-2030 ($ million)
Chart on US - Year-over-year growth 2025-2030 (%)
Data Table on US - Year-over-year growth 2025-2030 (%)

13.3.2 Canada - Market size and forecast 2025-2030

Chart on Canada - Market size and forecast 2025-2030 ($ million)
Data Table on Canada - Market size and forecast 2025-2030 ($ million)
Chart on Canada - Year-over-year growth 2025-2030 (%)
Data Table on Canada - Year-over-year growth 2025-2030 (%)

13.3.3 Mexico - Market size and forecast 2025-2030

Chart on Mexico - Market size and forecast 2025-2030 ($ million)
Data Table on Mexico - Market size and forecast 2025-2030 ($ million)
Chart on Mexico - Year-over-year growth 2025-2030 (%)
Data Table on Mexico - Year-over-year growth 2025-2030 (%)

13.4 Europe - Market size and forecast 2025-2030

Chart on Europe - Market size and forecast 2025-2030 ($ million)
Data Table on Europe - Market size and forecast 2025-2030 ($ million)
Chart on Europe - Year-over-year growth 2025-2030 (%)
Data Table on Europe - Year-over-year growth 2025-2030 (%)
Chart on Regional Comparison - Europe
Data Table on Regional Comparison - Europe

13.4.1 Germany - Market size and forecast 2025-2030

Chart on Germany - Market size and forecast 2025-2030 ($ million)
Data Table on Germany - Market size and forecast 2025-2030 ($ million)
Chart on Germany - Year-over-year growth 2025-2030 (%)
Data Table on Germany - Year-over-year growth 2025-2030 (%)

13.4.2 UK - Market size and forecast 2025-2030

Chart on UK - Market size and forecast 2025-2030 ($ million)
Data Table on UK - Market size and forecast 2025-2030 ($ million)
Chart on UK - Year-over-year growth 2025-2030 (%)
Data Table on UK - Year-over-year growth 2025-2030 (%)

13.4.3 France - Market size and forecast 2025-2030

Chart on France - Market size and forecast 2025-2030 ($ million)
Data Table on France - Market size and forecast 2025-2030 ($ million)
Chart on France - Year-over-year growth 2025-2030 (%)
Data Table on France - Year-over-year growth 2025-2030 (%)

13.4.4 Italy - Market size and forecast 2025-2030

Chart on Italy - Market size and forecast 2025-2030 ($ million)
Data Table on Italy - Market size and forecast 2025-2030 ($ million)
Chart on Italy - Year-over-year growth 2025-2030 (%)
Data Table on Italy - Year-over-year growth 2025-2030 (%)

13.4.5 Spain - Market size and forecast 2025-2030

Chart on Spain - Market size and forecast 2025-2030 ($ million)
Data Table on Spain - Market size and forecast 2025-2030 ($ million)
Chart on Spain - Year-over-year growth 2025-2030 (%)
Data Table on Spain - Year-over-year growth 2025-2030 (%)

13.4.6 The Netherlands - Market size and forecast 2025-2030

Chart on The Netherlands - Market size and forecast 2025-2030 ($ million)
Data Table on The Netherlands - Market size and forecast 2025-2030 ($ million)
Chart on The Netherlands - Year-over-year growth 2025-2030 (%)
Data Table on The Netherlands - Year-over-year growth 2025-2030 (%)

13.5 APAC - Market size and forecast 2025-2030

Chart on APAC - Market size and forecast 2025-2030 ($ million)
Data Table on APAC - Market size and forecast 2025-2030 ($ million)
Chart on APAC - Year-over-year growth 2025-2030 (%)
Data Table on APAC - Year-over-year growth 2025-2030 (%)
Chart on Regional Comparison - APAC
Data Table on Regional Comparison - APAC

13.5.1 China - Market size and forecast 2025-2030

Chart on China - Market size and forecast 2025-2030 ($ million)
Data Table on China - Market size and forecast 2025-2030 ($ million)
Chart on China - Year-over-year growth 2025-2030 (%)
Data Table on China - Year-over-year growth 2025-2030 (%)

13.5.2 Japan - Market size and forecast 2025-2030

Chart on Japan - Market size and forecast 2025-2030 ($ million)
Data Table on Japan - Market size and forecast 2025-2030 ($ million)
Chart on Japan - Year-over-year growth 2025-2030 (%)
Data Table on Japan - Year-over-year growth 2025-2030 (%)

13.5.3 India - Market size and forecast 2025-2030

Chart on India - Market size and forecast 2025-2030 ($ million)
Data Table on India - Market size and forecast 2025-2030 ($ million)
Chart on India - Year-over-year growth 2025-2030 (%)
Data Table on India - Year-over-year growth 2025-2030 (%)

13.5.4 South Korea - Market size and forecast 2025-2030

Chart on South Korea - Market size and forecast 2025-2030 ($ million)
Data Table on South Korea - Market size and forecast 2025-2030 ($ million)
Chart on South Korea - Year-over-year growth 2025-2030 (%)
Data Table on South Korea - Year-over-year growth 2025-2030 (%)

13.5.5 Australia - Market size and forecast 2025-2030

Chart on Australia - Market size and forecast 2025-2030 ($ million)
Data Table on Australia - Market size and forecast 2025-2030 ($ million)
Chart on Australia - Year-over-year growth 2025-2030 (%)
Data Table on Australia - Year-over-year growth 2025-2030 (%)

13.5.6 Indonesia - Market size and forecast 2025-2030

Chart on Indonesia - Market size and forecast 2025-2030 ($ million)
Data Table on Indonesia - Market size and forecast 2025-2030 ($ million)
Chart on Indonesia - Year-over-year growth 2025-2030 (%)
Data Table on Indonesia - Year-over-year growth 2025-2030 (%)

13.6 South America - Market size and forecast 2025-2030

Chart on South America - Market size and forecast 2025-2030 ($ million)
Data Table on South America - Market size and forecast 2025-2030 ($ million)
Chart on South America - Year-over-year growth 2025-2030 (%)
Data Table on South America - Year-over-year growth 2025-2030 (%)
Chart on Regional Comparison - South America
Data Table on Regional Comparison - South America

13.6.1 Brazil - Market size and forecast 2025-2030

Chart on Brazil - Market size and forecast 2025-2030 ($ million)
Data Table on Brazil - Market size and forecast 2025-2030 ($ million)
Chart on Brazil - Year-over-year growth 2025-2030 (%)
Data Table on Brazil - Year-over-year growth 2025-2030 (%)

13.6.2 Argentina - Market size and forecast 2025-2030

Chart on Argentina - Market size and forecast 2025-2030 ($ million)
Data Table on Argentina - Market size and forecast 2025-2030 ($ million)
Chart on Argentina - Year-over-year growth 2025-2030 (%)
Data Table on Argentina - Year-over-year growth 2025-2030 (%)

13.6.3 Chile - Market size and forecast 2025-2030

Chart on Chile - Market size and forecast 2025-2030 ($ million)
Data Table on Chile - Market size and forecast 2025-2030 ($ million)
Chart on Chile - Year-over-year growth 2025-2030 (%)
Data Table on Chile - Year-over-year growth 2025-2030 (%)

13.7 Middle East and Africa - Market size and forecast 2025-2030

Chart on Middle East and Africa - Market size and forecast 2025-2030 ($ million)
Data Table on Middle East and Africa - Market size and forecast 2025-2030 ($ million)
Chart on Middle East and Africa - Year-over-year growth 2025-2030 (%)
Data Table on Middle East and Africa - Year-over-year growth 2025-2030 (%)
Chart on Regional Comparison - Middle East and Africa
Data Table on Regional Comparison - Middle East and Africa

13.7.1 Saudi Arabia - Market size and forecast 2025-2030

Chart on Saudi Arabia - Market size and forecast 2025-2030 ($ million)
Data Table on Saudi Arabia - Market size and forecast 2025-2030 ($ million)
Chart on Saudi Arabia - Year-over-year growth 2025-2030 (%)
Data Table on Saudi Arabia - Year-over-year growth 2025-2030 (%)

13.7.2 UAE - Market size and forecast 2025-2030

Chart on UAE - Market size and forecast 2025-2030 ($ million)
Data Table on UAE - Market size and forecast 2025-2030 ($ million)
Chart on UAE - Year-over-year growth 2025-2030 (%)
Data Table on UAE - Year-over-year growth 2025-2030 (%)

13.7.3 South Africa - Market size and forecast 2025-2030

Chart on South Africa - Market size and forecast 2025-2030 ($ million)
Data Table on South Africa - Market size and forecast 2025-2030 ($ million)
Chart on South Africa - Year-over-year growth 2025-2030 (%)
Data Table on South Africa - Year-over-year growth 2025-2030 (%)

13.7.4 Israel - Market size and forecast 2025-2030

Chart on Israel - Market size and forecast 2025-2030 ($ million)
Data Table on Israel - Market size and forecast 2025-2030 ($ million)
Chart on Israel - Year-over-year growth 2025-2030 (%)
Data Table on Israel - Year-over-year growth 2025-2030 (%)

13.7.5 Turkey - Market size and forecast 2025-2030

Chart on Turkey - Market size and forecast 2025-2030 ($ million)
Data Table on Turkey - Market size and forecast 2025-2030 ($ million)
Chart on Turkey - Year-over-year growth 2025-2030 (%)
Data Table on Turkey - Year-over-year growth 2025-2030 (%)

13.8 Market opportunity by geography

Market opportunity by geography ($ million)
Data Tables on Market opportunity by geography ($ million)

14. Drivers, Challenges, and Opportunity

14.1 Market drivers

Vital role of employee retention and corporate culture enhancement
Technological advancements and rise of immersive event experiences
Strategic marketing and expansion of B2B networking

14.2 Market challenges

Economic volatility and rigidity of corporate budgetary retrenchment
Technological fragmentation and high cost of digital infrastructure integration
Escalating regulatory compliance and mandate for environmental sustainability

14.3 Impact of drivers and challenges

Impact of drivers and challenges in 2025 and 2030

14.4 Market opportunities

Proliferation of hyper-personalization and data-driven audience engagement
Integration of environmental sustainability and ethical stewardship in event design
Evolution toward holistic wellness and cognitive rejuvenation

15. Competitive Landscape

15.1 Overview

15.2

Overview on criticality of inputs and factors of differentiation

15.3 Landscape disruption

Overview on factors of disruption

15.4 Industry risks

Impact of key risks on business

16. Competitive Analysis

16.1 Companies profiled

Companies covered

16.2 Company ranking index

16.3 Market positioning of companies

Matrix on companies position and classification

16.4 BCD Meetings and Events

BCD Meetings and Events - Overview
BCD Meetings and Events - Product / Service
BCD Meetings and Events - Key offerings
SWOT

16.5 BI WORLDWIDE

BI WORLDWIDE - Overview
BI WORLDWIDE - Product / Service
BI WORLDWIDE - Key offerings
SWOT

16.6 Creative Group Inc.

Creative Group Inc. - Overview
Creative Group Inc. - Product / Service
Creative Group Inc. - Key offerings
SWOT

16.7 CWT

CWT - Overview
CWT - Product / Service
CWT - Key offerings
SWOT

16.8 George P. Johnson

George P. Johnson - Overview
George P. Johnson - Product / Service
George P. Johnson - Key offerings
SWOT

16.9 ITA Group

ITA Group - Overview
ITA Group - Product / Service
ITA Group - Key offerings
SWOT

16.10 Jack Morton Worldwide Inc.

Jack Morton Worldwide Inc. - Overview
Jack Morton Worldwide Inc. - Product / Service
Jack Morton Worldwide Inc. - Key offerings
SWOT

16.11 Maritz Holdings Inc.

Maritz Holdings Inc. - Overview
Maritz Holdings Inc. - Product / Service
Maritz Holdings Inc. - Key offerings
SWOT

16.12 MC2

MC2 - Overview
MC2 - Product / Service
MC2 - Key offerings
SWOT

16.13 MNT Holdings LLC

MNT Holdings LLC - Overview
MNT Holdings LLC - Product / Service
MNT Holdings LLC - Key offerings
SWOT

16.14 Nth Degree Inc.

Nth Degree Inc. - Overview
Nth Degree Inc. - Product / Service
Nth Degree Inc. - Key offerings
SWOT

16.15 Opus Agency

Opus Agency - Overview
Opus Agency - Product / Service
Opus Agency - Key offerings
SWOT

16.16 Sparks Marketing Group Inc.

Sparks Marketing Group Inc. - Overview
Sparks Marketing Group Inc. - Product / Service
Sparks Marketing Group Inc. - Key offerings
SWOT

16.17 The Freeman Co.

The Freeman Co. - Overview
The Freeman Co. - Product / Service
The Freeman Co. - Key offerings
SWOT

16.18 VIVA Creative

VIVA Creative - Overview
VIVA Creative - Product / Service
VIVA Creative - Key offerings
SWOT

17. Appendix

17.1 Scope of the report

Market definition
Objectives
Notes and caveats

17.2 Inclusions and exclusions checklist

Inclusions checklist
Exclusions checklist

17.3 Currency conversion rates for US$

17.4 Research methodology

17.5 Data procurement

Information sources

17.6 Data validation

17.7 Validation techniques employed for market sizing

17.8 Data synthesis

17.9 360 degree market analysis

17.10 List of abbreviations

Research Methodology

Technavio presents a detailed picture of the market by way of study, synthesis, and summation of data from multiple sources. The analysts have presented the various facets of the market with a particular focus on identifying the key industry influencers. The data thus presented is comprehensive, reliable, and the result of extensive research, both primary and secondary.

INFORMATION SOURCES

Primary sources

  • Manufacturers and suppliers
  • Channel partners
  • Industry experts
  • Strategic decision makers

Secondary sources

  • Industry journals and periodicals
  • Government data
  • Financial reports of key industry players
  • Historical data
  • Press releases

DATA ANALYSIS

Data Synthesis

  • Collation of data
  • Estimation of key figures
  • Analysis of derived insights

Data Validation

  • Triangulation with data models
  • Reference against proprietary databases
  • Corroboration with industry experts

REPORT WRITING

Qualitative

  • Market drivers
  • Market challenges
  • Market trends
  • Five forces analysis

Quantitative

  • Market size and forecast
  • Market segmentation
  • Geographical insights
  • Competitive landscape

Interested in this report?

Get your sample now to see our research methodology and insights!

Download Now

Frequently Asked Questions

Corporate Entertainment market growth will increase by USD 103774.6 million during 2026-2030.

The Corporate Entertainment market is expected to grow at a CAGR of 8.8% during 2026-2030.

Corporate Entertainment market is segmented by Type (Conventions, Retreats, Office parties, Others) Age group (25-55 years, Under 25 years, Over 55 years) End-user (IT and telecom, BFSI, Healthcare, Retail, Manufacturing) Organization size (Large enterprises, Medium enterprises, Small enterprises)

BCD Meetings and Events, BI WORLDWIDE, Creative Group Inc., CWT, Drury Design Dynamics Inc., Escapely, George P. Johnson, ITA Group, Jack Morton Worldwide Inc., Maritz Holdings Inc., MC2, MNT Holdings LLC, Nth Degree Inc., Opus Agency, Outback Team Building and Training, Sparks Marketing Group Inc., The Freeman Co., VIVA Creative, Wildgoose Events Ltd. are a few of the key vendors in the Corporate Entertainment market.

North America will register the highest growth rate of 35% among the other regions. Therefore, the Corporate Entertainment market in North America is expected to garner significant business opportunities for the vendors during the forecast period.

US, Canada, Mexico, Germany, UK, France, Italy, Spain, The Netherlands, China, Japan, India, South Korea, Australia, Indonesia, Brazil, Argentina, Chile, Saudi Arabia, UAE, South Africa, Israel, Turkey

  • Vital role of employee retention and corporate culture enhancement is the driving factor this market.

The Corporate Entertainment market vendors should focus on grabbing business opportunities from the Type segment as it accounted for the largest market share in the base year.
RIA - Research AI Assistant
Ask RIA
