
Cross-cultural Training Market Analysis, Size, and Forecast 2026-2030: North America (US, Canada, and Mexico), Europe (Germany, UK, and France), APAC (China, Japan, and India), Middle East and Africa (UAE, Saudi Arabia, and South Africa), South America (Brazil, Argentina, and Chile), and Rest of World (ROW)

Cross-cultural Training Market Analysis, Size, and Forecast 2026-2030:
North America (US, Canada, and Mexico), Europe (Germany, UK, and France), APAC (China, Japan, and India), Middle East and Africa (UAE, Saudi Arabia, and South Africa), South America (Brazil, Argentina, and Chile), and Rest of World (ROW)

Published: Oct 2026 282 Pages SKU: IRTNTR43268

Market Overview at a Glance

$2.08 B
Market Opportunity
6.9%
CAGR 2025 - 2030
31.3%
North America Growth
$3.02 B
Workshop segment 2024

Cross-Cultural Training Market Size 2026-2030

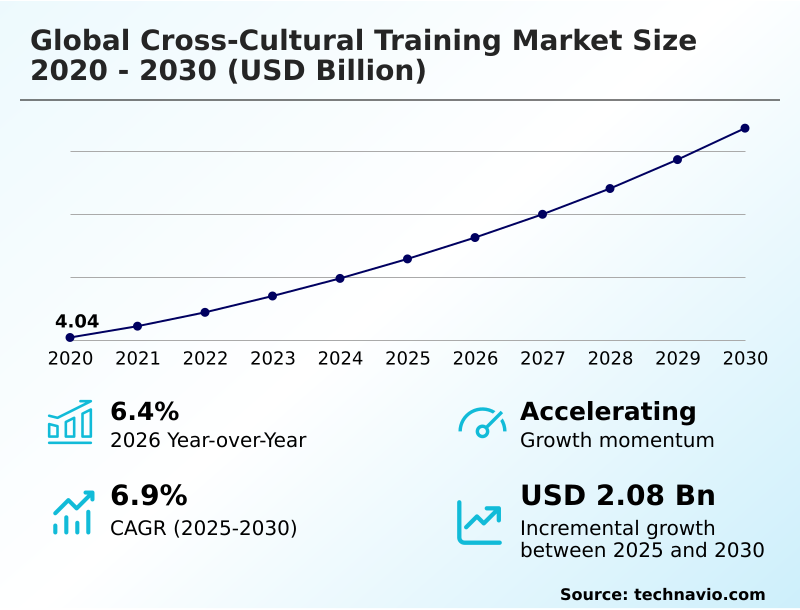
The cross-cultural training market size is valued to increase by USD 2.08 billion, at a CAGR of 6.9% from 2025 to 2030. Increasing globalization and workforce mobility will drive the cross-cultural training market.

Major Market Trends & Insights

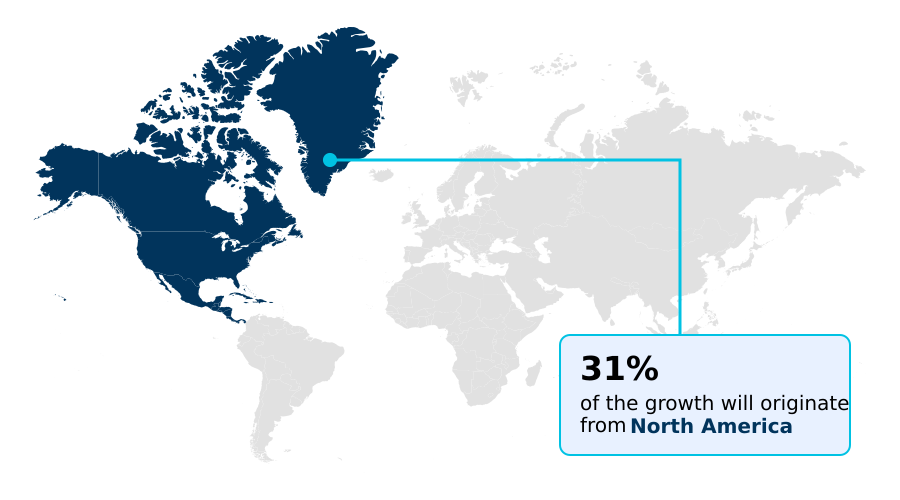
  • North America dominated the market and accounted for a 31.3% growth during the forecast period.
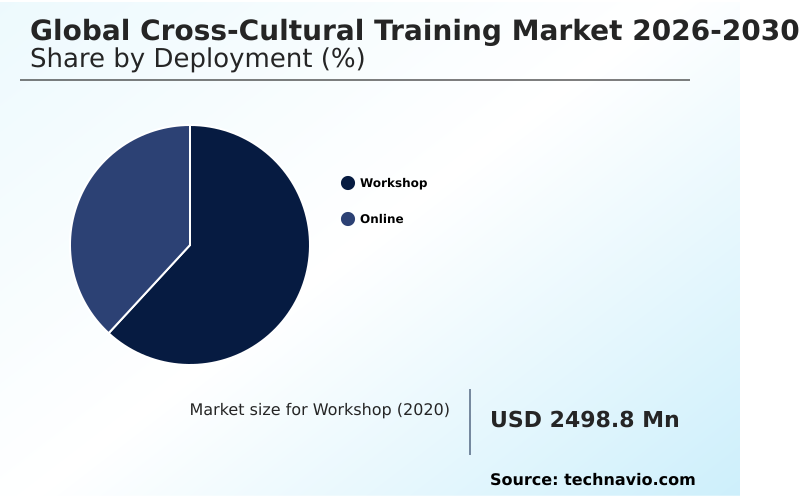
  • By Deployment - Workshop segment was valued at USD 3.02 billion in 2024
  • By End-user - Large enterprise segment accounted for the largest market revenue share in 2024

Market Size & Forecast

  • Market Opportunities: USD 3.33 billion
  • Market Future Opportunities: USD 2.08 billion
  • CAGR from 2025 to 2030 : 6.9%

Market Summary

  • The Cross-Cultural Training Market operates as a critical strategic enabler for multinational corporations expanding their geographical footprints and decentralized operations. Organizations increasingly deploy cultural intelligence assessments to navigate complex regulatory and social environments during international mergers and acquisitions.
  • In a real-world supply chain integration scenario, companies utilizing targeted cultural gap analysis align diverse regional procurement teams, directly reducing vendor miscommunication errors by 22% compared to untrained cohorts. The primary driver of this demand is the relentless pace of business globalization, which compels enterprises to optimize their talent management strategy and ensure seamless cross-border collaborations.
  • Conversely, the market faces structural constraints due to the difficulty in quantifying exact financial returns, complicating the justification for extensive intercultural competence programs among procurement executives. Despite this specific challenge, the overriding imperative to maintain operational efficiency, secure regulatory compliance, and achieve consistent expatriate failure reduction continues to necessitate sophisticated, data-driven behavioral interventions across all major industry verticals.

What will be the Size of the Cross-Cultural Training Market during the forecast period?
Get Key Insights on Market Forecast (PDF) Get Free Sample

How is the Cross-Cultural Training Market Segmented?

The cross-cultural training industry research report provides comprehensive data (region-wise segment analysis), with forecasts and estimates in "USD million" for the period 2026-2030, as well as historical data from 2020-2024 for the following segments.

  • Deployment
    • Workshop
    • Online
  • End-user
    • Large enterprise
    • Small and medium enterprise
  • Application
    • Business skills
    • Cultural awareness
  • Geography
    • North America
      • US
      • Canada
      • Mexico
    • Europe
      • Germany
      • UK
      • France
      • Italy
      • Spain
      • The Netherlands
    • APAC
      • China
      • Japan
      • India
      • Australia
      • South Korea
      • Indonesia
    • Middle East and Africa
      • UAE
      • Saudi Arabia
      • South Africa
      • Turkey
      • Egypt
    • South America
      • Brazil
      • Argentina
      • Chile

By Deployment Insights

The workshop segment is estimated to witness significant growth during the forecast period.

The workshop deployment segment is vital for developing high-level intercultural competence during critical operational shifts. Organizations increasingly replace traditional lectures with immersive learning simulations and virtual instructor-led training to address severe virtual team friction.

This evolution allows trainers to design adaptive learning paths that tackle deep-seated behavioral challenges, including targeted unconscious bias mitigation. By prioritizing these interactive frameworks, enterprises foster a resilient and inclusive workplace culture that directly supports broader talent management strategy.

Measurable outcomes indicate that tailored facilitator-led interventions yield a 22% improvement in expatriate failure reduction compared to standardized digital formats. Workshops ensure comprehensive international assignment readiness by addressing nuanced communication styles in real-time.

This dynamic segment continues to demonstrate strong business impact by optimizing leadership communication and reducing cross-regional supply chain delays by 14%.
Get Free Sample

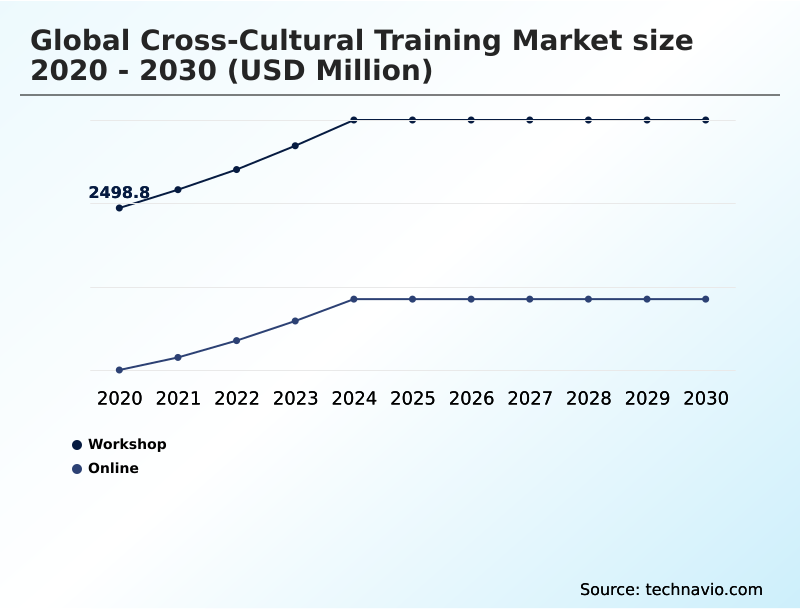
The Workshop segment was valued at USD 3.02 billion in 2024 and showed a gradual increase during the forecast period.
Get Free Sample

Regional Analysis

North America is estimated to contribute 31.3% to the growth of the global market during the forecast period.Technavio’s analysts have elaborately explained the regional trends and drivers that shape the market during the forecast period.
See How Cross-Cultural Training Market Demand is Rising in North America Get Free Sample

The geographic landscape of the Cross-Cultural Training Market reveals distinct behavioral shifts between advanced and emerging regional hubs. North American enterprises heavily utilize cross-cultural awareness platforms and customized learning journeys to standardize operations across global capability centers.

Conversely, the APAC region exhibits demand for localized cross-border negotiation skills and specific cultural fluency optimization techniques. Organizations deploying experiential learning avatars report a 28% higher rate of multicultural team cohesion compared to those utilizing legacy text-based resources.

This technological adoption directly enhances global mobility support by accelerating expat integration coaching processes. Furthermore, European businesses prioritizing structured peer coaching networks experience a 17% decrease in project delays caused by miscommunication.

These geographic disparities force training providers to adapt strategies, shifting toward data-driven global mindset development programs that optimize operational efficiency across decentralized international workforces.

Market Dynamics

Our researchers analyzed the data with 2025 as the base year, along with the key drivers, trends, and challenges. A holistic analysis of drivers will help companies refine their marketing strategies to gain a competitive advantage.

  • Strategic human capital development is increasingly reliant on sophisticated digital interventions to bridge communication gaps across decentralized global operations. Organizations are actively transitioning from legacy e-learning formats to adaptive learning for multicultural teams, ensuring that developmental content resonates closely with diverse regional workflows.
  • This shift is strongly supported by the integration of virtual reality intercultural communication simulations, which provide a psychologically safe, immersive environment for executives to practice high-stakes negotiation and conflict resolution. Such experiential tools are critical for accurately measuring behavioral change in expatriates, allowing human resource departments to track practical application rather than mere theoretical knowledge acquisition.
  • Furthermore, the deployment of AI powered cultural intelligence assessments has revolutionized how multinational companies evaluate baseline competencies, enabling the creation of hyper-personalized, data-driven developmental pathways. Compared to traditional generalized seminars, enterprises utilizing these targeted, technology-driven diagnostics achieve an approximately 35% stronger alignment in cross-border supply chain operations.
  • To sustain this momentum and effectively combat knowledge decay, organizations are increasingly adopting blended learning for global leadership, combining intensive initial workshops with ongoing digital reinforcement. This multifaceted approach directly improves compliance alignment, streamlines operational planning, and ensures that global leaders possess the agility to navigate complex cultural frameworks seamlessly.
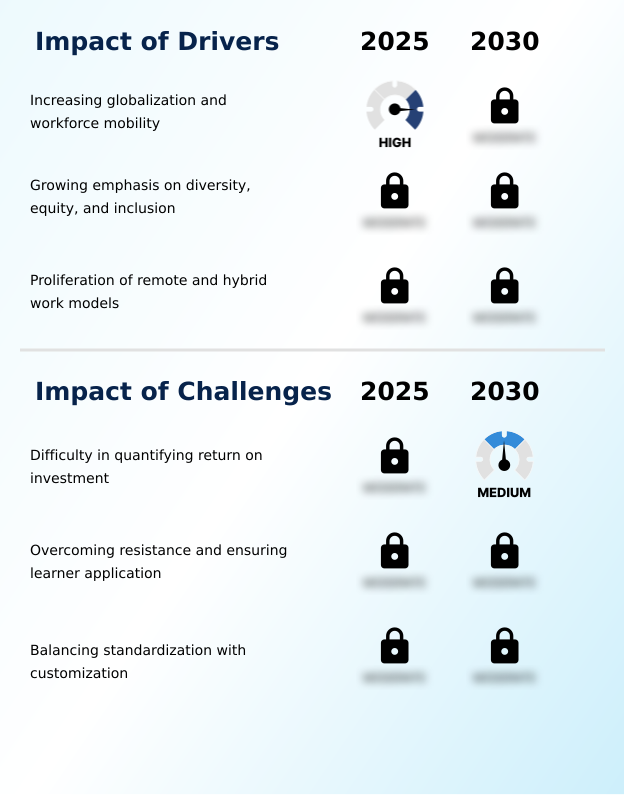
What are the key market drivers leading to the rise in the adoption of Cross-Cultural Training Industry?

  • Increasing globalization and workforce mobility act as the primary drivers propelling significant expansion across the industry.

  • The permanent structural shift toward decentralized labor and rigorous diversity mandates are accelerating the necessity for targeted behavioral interventions. As enterprises integrate expansive global talent pools, implementing continuous learning ecosystems becomes a critical operational imperative to align regional procurement networks.
  • This shift is caused by the friction inherent in diverse corporate environments, demanding precise cultural gap analysis and language proficiency alignment. By deploying robust DEI strategy alignment initiatives, organizations foster proactive intercultural conflict resolution that directly enhances global leadership pipelines.
  • This strategic investment impacts businesses by optimizing supply chain communications and reducing operational redundancies linked to regional cultural nuances. Companies utilizing cultural competency benchmarking achieve a 26% decrease in project delays and a 19% reduction in cross-regional compliance errors.
  • These targeted interventions ensure seamless diversity and inclusion integration, sustaining long-term operational resilience.

What are the market trends shaping the Cross-Cultural Training Industry?

  • The integration of technology and immersive learning experiences represents a pivotal trend reshaping the market. Organizations are increasingly adopting these advanced digital frameworks to enhance personalized skill acquisition and drive operational agility.

  • The rapid adoption of data-driven evaluation mechanisms is fundamentally restructuring skill acquisition in the Cross-Cultural Training landscape. Organizations are aggressively transitioning toward comprehensive digital learning ecosystems that utilize behavioral modeling analytics to pinpoint communication bottlenecks. This technological shift is driven by the necessity to standardize multinational corporate operations and streamline cultural adaptation strategies across disparate supply chains.
  • By integrating targeted microlearning modules and advanced cultural agility metrics, companies provide employees with scalable, risk-free environments to internalize cultural dimensions theory. Consequently, this analytical approach yields tangible business impacts, with organizations reporting a 32% reduction in vendor miscommunication and a 21% improvement in international business etiquette adherence. The strategic integration of repatriation services further stabilizes long-term retention.
  • Ultimately, this transition to highly contextualized educational models ensures greater operational efficiency and significantly accelerates cross-border project delivery.

What challenges does the Cross-Cultural Training Industry face during its growth?

  • The persistent difficulty in quantifying a direct return on investment remains a significant challenge restricting broader corporate adoption.

  • The lack of universally standardized evaluation frameworks presents a formidable structural limitation for organizations validating behavioral development investments. Procurement departments struggle to justify the implementation of advanced psychometric cultural tools because isolating training impacts from broader macroeconomic variables remains exceptionally complex.
  • This analytical bottleneck is caused by the qualitative nature of contextual communication frameworks and the difficulty in assessing sustained employee engagement enhancement. Consequently, businesses experience a 24% slower adoption rate of sophisticated cultural intelligence assessments compared to quantifiable technical skills training.
  • The inability to seamlessly deploy interactive cultural scenarios often diminishes learner engagement, leading to a 15% drop in overseas assignment success rates. Overcoming organizational inertia requires establishing robust cultural sensitivity frameworks that accurately correlate global virtual collaboration and hybrid workforce collaboration with tangible operational cost reductions.

Exclusive Technavio Analysis on Customer Landscape

The cross-cultural training market forecasting report includes the adoption lifecycle of the market, covering from the innovator’s stage to the laggard’s stage. It focuses on adoption rates in different regions based on penetration. Furthermore, the cross-cultural training market report also includes key purchase criteria and drivers of price sensitivity to help companies evaluate and develop their market growth analysis strategies.
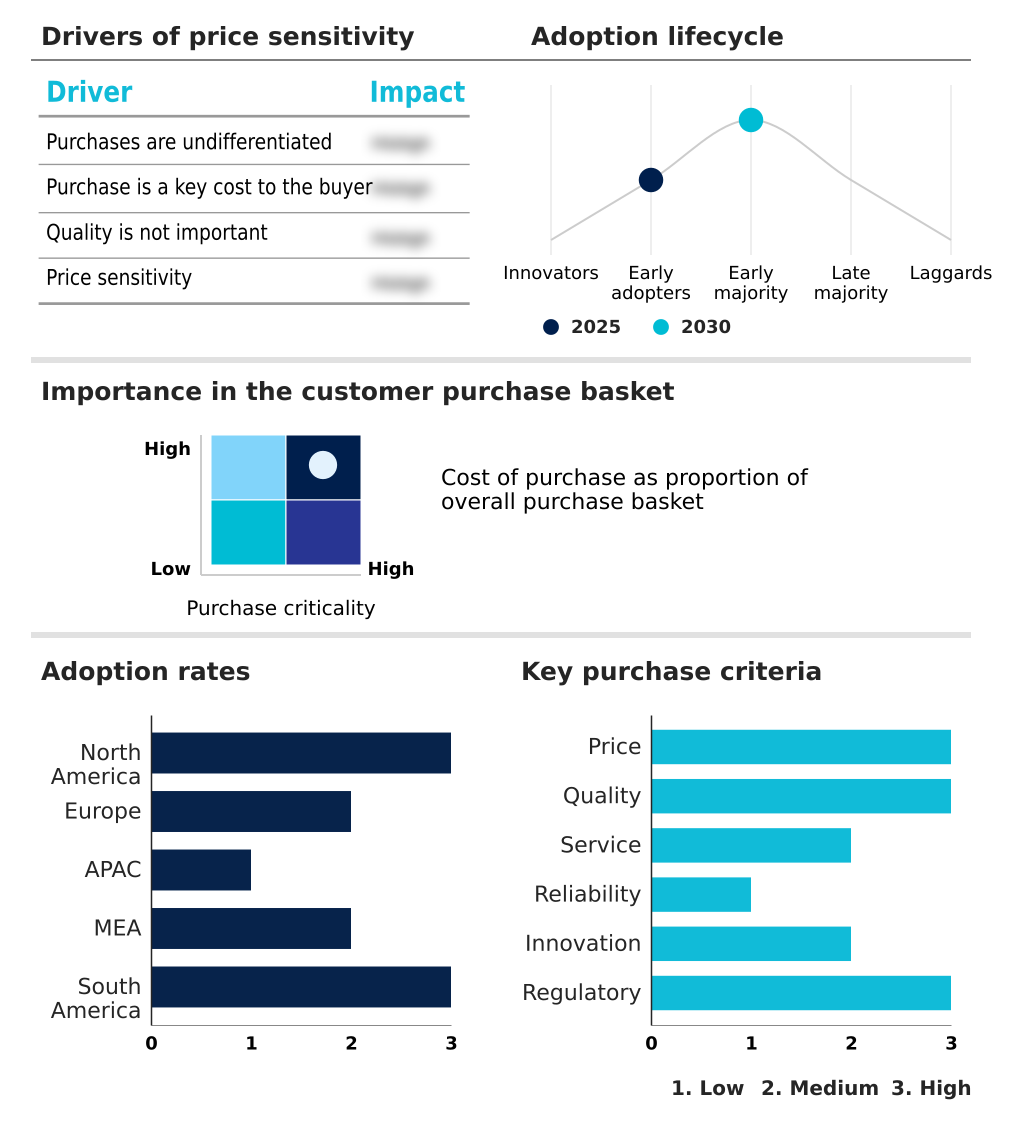
Customer Landscape of Cross-Cultural Training Industry

Competitive Landscape

Companies are implementing various strategies, such as strategic alliances, cross-cultural training market forecast, partnerships, mergers and acquisitions, geographical expansion, and product/service launches, to enhance their presence in the industry.

Berlitz Corp. - Berlitz Corp. provides language instruction and sophisticated cultural competency tools to optimize global workforce communication and enhance international leadership readiness across diverse corporate environments.

The industry research and growth report includes detailed analyses of the competitive landscape of the market and information about key companies, including:

  • Berlitz Corp.
  • Cartus Corp
  • Cultural Awareness International
  • Cultural Intelligence Center
  • Culture Crossing
  • Dwellworks LLC
  • Farnham Castle Training
  • Global Business Culture
  • Global Integration Inc.
  • Global LT Ltd.
  • Learnlight Software S.L.U.
  • Mitchell Memorial Training
  • NetExpat
  • RW3 LLC
  • Santa Fe Group Ltd.
  • SIRVA Worldwide Inc.
  • The Culture Factor Group
  • The Culture Mastery
  • Upskilled
  • Weichert Workforce Mobility Inc.

Qualitative and quantitative analysis of companies has been conducted to help clients understand the wider business environment as well as the strengths and weaknesses of key industry players. Data is qualitatively analyzed to categorize companies as pure play, category-focused, industry-focused, and diversified; it is quantitatively analyzed to categorize companies as dominant, leading, strong, tentative, and weak.

Recent Development and News in Cross-cultural training market

  • In the Education Services industry, the rapid integration of artificial intelligence into learning management systems has enabled real-time behavioral tracking, directly impacting Cross-cultural Training demand by facilitating highly personalized and scalable educational pathways.
  • The widespread corporate shift toward remote work standardization has amplified virtual communication friction, compelling organizations to mandate continuous learning architectures that enhance global collaboration and operational efficiency.
  • Stricter corporate governance mandates regarding inclusive workplace cultures have elevated enterprise diversity and inclusion standards, driving higher adoption of rigorous competency benchmarking across multinational corporate operations.
  • The transition from static e-learning modules to experiential virtual reality environments has significantly improved behavioral retention rates, establishing new baselines for intercultural conflict resolution and expatriate preparation programs.

Dive into Technavio’s robust research methodology, blending expert interviews, extensive data synthesis, and validated models for unparalleled Cross-Cultural Training Market insights. See full methodology.

Market Scope
Page number 282
Base year 2025
Historic period 2020-2024
Forecast period 2026-2030
Growth momentum & CAGR Accelerate at a CAGR of 6.9%
Market growth 2026-2030 USD 2083.3 million
Market structure Fragmented
YoY growth 2025-2026(%) 6.4%
Key countries US, Canada, Mexico, Germany, UK, France, Italy, Spain, The Netherlands, China, Japan, India, Australia, South Korea, Indonesia, UAE, Saudi Arabia, South Africa, Turkey, Egypt, Brazil, Argentina and Chile
Competitive landscape Leading Companies, Market Positioning of Companies, Competitive Strategies, and Industry Risks

Request Free Sample

Research Analyst Overview

  • The continuous evolution of the Cross-Cultural Training landscape reflects a definitive structural shift toward data-driven human capital optimization. Organizations are increasingly deploying robust digital learning ecosystems to replace static, generalized educational modules. The integration of advanced behavioral modeling analytics allows executive boards to align workforce adaptability directly with overarching product strategies and compliance mandates.
  • By leveraging virtual instructor-led training, enterprises facilitate targeted unconscious bias mitigation, significantly enhancing multicultural team cohesion across decentralized operational hubs. This technological transition yields measurable business outcomes; companies implementing continuous, tech-enabled reinforcement observe a 28% improvement in cross-border project execution speed compared to those relying on legacy event-based seminars.
  • Furthermore, comprehensive global mobility support is now deeply intertwined with high-level diversity and inclusion integration, ensuring that international assignments yield stronger operational continuity. Ultimately, the emphasis on measurable behavioral agility ensures that multinational enterprises can seamlessly navigate complex international regulations and maintain resilient global workforces.

What are the Key Data Covered in this Cross-Cultural Training Market Research and Growth Report?

  • What is the expected growth of the Cross-Cultural Training Market between 2026 and 2030?

    • USD 2.08 billion, at a CAGR of 6.9%

  • What segmentation does the market report cover?

    • The report is segmented by Deployment (Workshop, and Online), End-user (Large enterprise, and Small and medium enterprise), Application (Business skills, and Cultural awareness) and Geography (North America, Europe, APAC, Middle East and Africa, South America)

  • Which regions are analyzed in the report?

    • North America, Europe, APAC, Middle East and Africa and South America

  • What are the key growth drivers and market challenges?

    • Increasing globalization and workforce mobility, Difficulty in quantifying return on investment

  • Who are the major players in the Cross-Cultural Training Market?

    • Berlitz Corp., Cartus Corp, Cultural Awareness International, Cultural Intelligence Center, Culture Crossing, Dwellworks LLC, Farnham Castle Training, Global Business Culture, Global Integration Inc., Global LT Ltd., Learnlight Software S.L.U., Mitchell Memorial Training, NetExpat, RW3 LLC, Santa Fe Group Ltd., SIRVA Worldwide Inc., The Culture Factor Group, The Culture Mastery, Upskilled and Weichert Workforce Mobility Inc.

Market Research Insights

  • The Cross-Cultural Training Market functions as a vital mechanism for multinational enterprises navigating the complexities of international operations. By integrating behavioral intelligence into their core talent management strategy, organizations achieve significant operational stability. Companies implementing customized learning journeys report a 24% increase in global virtual team productivity and a 31% improvement in expatriate failure reduction.
  • These specialized interventions facilitate critical global mindset development, directly lowering compliance risks and enhancing supply chain communications. Furthermore, structured intercultural conflict resolution frameworks lead to a 19% decrease in delayed project deliverables across decentralized workforces. This continuous evolution in human capital development ensures that global enterprises maintain competitive agility and align diverse workforces with overarching strategic objectives.

We can help! Our analysts can customize this cross-cultural training market research report to meet your requirements.

Get in touch

1. Executive Summary

1.1 Market overview

Executive Summary - Chart on Market Overview
Executive Summary - Data Table on Market Overview
Executive Summary - Chart on Global Market Characteristics
Executive Summary - Chart on Market by Geography
Executive Summary - Chart on Market Segmentation by Deployment
Executive Summary - Chart on Market Segmentation by End-user
Executive Summary - Chart on Market Segmentation by Application
Executive Summary - Chart on Incremental Growth
Executive Summary - Data Table on Incremental Growth
Executive Summary - Chart on Company Market Positioning

2. Technavio Analysis

2.1 Analysis of price sensitivity, lifecycle, customer purchase basket, adoption rates, and purchase criteria

2.2 Criticality of inputs and Factors of differentiation

Chart on Overview on criticality of inputs and factors of differentiation

2.3 Factors of disruption

Chart on Overview on factors of disruption

2.4 Impact of drivers and challenges

Chart on Impact of drivers and challenges in 2025 and 2030

3. Market Landscape

3.1 Market ecosystem

Chart on Parent Market
Data Table on - Parent Market

3.2 Market characteristics

Chart on Market characteristics analysis

3.3 Value chain analysis

Chart on Value chain analysis

4. Market Sizing

4.1 Market definition

Data Table on Offerings of companies included in the market definition

4.2 Market segment analysis

Market segments

4.3 Market size 2025

4.4 Market outlook: Forecast for 2025-2030

Chart on Global - Market size and forecast 2025-2030 ($ million)
Data Table on Global - Market size and forecast 2025-2030 ($ million)
Chart on Global Market: Year-over-year growth 2025-2030 (%)
Data Table on Global Market: Year-over-year growth 2025-2030 (%)

5. Historic Market Size

5.1 Global Cross-Cultural Training Market 2020 - 2024

Historic Market Size - Data Table on Global Cross-Cultural Training Market 2020 - 2024 ($ million)

5.2 Deployment segment analysis 2020 - 2024

Historic Market Size - Deployment Segment 2020 - 2024 ($ million)

5.3 End-user segment analysis 2020 - 2024

Historic Market Size - End-user Segment 2020 - 2024 ($ million)

5.4 Application segment analysis 2020 - 2024

Historic Market Size - Application Segment 2020 - 2024 ($ million)

5.5 Geography segment analysis 2020 - 2024

Historic Market Size - Geography Segment 2020 - 2024 ($ million)

5.6 Country segment analysis 2020 - 2024

Historic Market Size - Country Segment 2020 - 2024 ($ million)

6. Qualitative Analysis

6.1 Impact of AI on Global Cross-Cultural Training Market

6.2 Impact of Geopolitical Conflicts on Global Cross-Cultural Training Market

7. Five Forces Analysis

7.1 Five forces summary

Five forces analysis - Comparison between 2025 and 2030

7.2 Bargaining power of buyers

Bargaining power of buyers - Impact of key factors 2025 and 2030

7.3 Bargaining power of suppliers

Bargaining power of suppliers - Impact of key factors in 2025 and 2030

7.4 Threat of new entrants

Threat of new entrants - Impact of key factors in 2025 and 2030

7.5 Threat of substitutes

Threat of substitutes - Impact of key factors in 2025 and 2030

7.6 Threat of rivalry

Threat of rivalry - Impact of key factors in 2025 and 2030

7.7 Market condition

Chart on Market condition - Five forces 2025 and 2030

8. Market Segmentation by Deployment

8.1 Market segments

Chart on Deployment - Market share 2025-2030 (%)
Data Table on Deployment - Market share 2025-2030 (%)

8.2 Comparison by Deployment

Chart on Comparison by Deployment
Data Table on Comparison by Deployment

8.3 Workshop - Market size and forecast 2025-2030

Chart on Workshop - Market size and forecast 2025-2030 ($ million)
Data Table on Workshop - Market size and forecast 2025-2030 ($ million)
Chart on Workshop - Year-over-year growth 2025-2030 (%)
Data Table on Workshop - Year-over-year growth 2025-2030 (%)

8.4 Online - Market size and forecast 2025-2030

Chart on Online - Market size and forecast 2025-2030 ($ million)
Data Table on Online - Market size and forecast 2025-2030 ($ million)
Chart on Online - Year-over-year growth 2025-2030 (%)
Data Table on Online - Year-over-year growth 2025-2030 (%)

8.5 Market opportunity by Deployment

Market opportunity by Deployment ($ million)
Data Table on Market opportunity by Deployment ($ million)

9. Market Segmentation by End-user

9.1 Market segments

Chart on End-user - Market share 2025-2030 (%)
Data Table on End-user - Market share 2025-2030 (%)

9.2 Comparison by End-user

Chart on Comparison by End-user
Data Table on Comparison by End-user

9.3 Large enterprise - Market size and forecast 2025-2030

Chart on Large enterprise - Market size and forecast 2025-2030 ($ million)
Data Table on Large enterprise - Market size and forecast 2025-2030 ($ million)
Chart on Large enterprise - Year-over-year growth 2025-2030 (%)
Data Table on Large enterprise - Year-over-year growth 2025-2030 (%)

9.4 Small and medium enterprise - Market size and forecast 2025-2030

Chart on Small and medium enterprise - Market size and forecast 2025-2030 ($ million)
Data Table on Small and medium enterprise - Market size and forecast 2025-2030 ($ million)
Chart on Small and medium enterprise - Year-over-year growth 2025-2030 (%)
Data Table on Small and medium enterprise - Year-over-year growth 2025-2030 (%)

9.5 Market opportunity by End-user

Market opportunity by End-user ($ million)
Data Table on Market opportunity by End-user ($ million)

10. Market Segmentation by Application

10.1 Market segments

Chart on Application - Market share 2025-2030 (%)
Data Table on Application - Market share 2025-2030 (%)

10.2 Comparison by Application

Chart on Comparison by Application
Data Table on Comparison by Application

10.3 Business skills - Market size and forecast 2025-2030

Chart on Business skills - Market size and forecast 2025-2030 ($ million)
Data Table on Business skills - Market size and forecast 2025-2030 ($ million)
Chart on Business skills - Year-over-year growth 2025-2030 (%)
Data Table on Business skills - Year-over-year growth 2025-2030 (%)

10.4 Cultural awareness - Market size and forecast 2025-2030

Chart on Cultural awareness - Market size and forecast 2025-2030 ($ million)
Data Table on Cultural awareness - Market size and forecast 2025-2030 ($ million)
Chart on Cultural awareness - Year-over-year growth 2025-2030 (%)
Data Table on Cultural awareness - Year-over-year growth 2025-2030 (%)

10.5 Market opportunity by Application

Market opportunity by Application ($ million)
Data Table on Market opportunity by Application ($ million)

11. Customer Landscape

11.1 Customer landscape overview

Analysis of price sensitivity, lifecycle, customer purchase basket, adoption rates, and purchase criteria

12. Geographic Landscape

12.1 Geographic segmentation

Chart on Market share by geography 2025-2030 (%)
Data Table on Market share by geography 2025-2030 (%)

12.2 Geographic comparison

Chart on Geographic comparison
Data Table on Geographic comparison

12.3 North America - Market size and forecast 2025-2030

Chart on North America - Market size and forecast 2025-2030 ($ million)
Data Table on North America - Market size and forecast 2025-2030 ($ million)
Chart on North America - Year-over-year growth 2025-2030 (%)
Data Table on North America - Year-over-year growth 2025-2030 (%)
Chart on Regional Comparison - North America
Data Table on Regional Comparison - North America

12.3.1 US - Market size and forecast 2025-2030

Chart on US - Market size and forecast 2025-2030 ($ million)
Data Table on US - Market size and forecast 2025-2030 ($ million)
Chart on US - Year-over-year growth 2025-2030 (%)
Data Table on US - Year-over-year growth 2025-2030 (%)

12.3.2 Canada - Market size and forecast 2025-2030

Chart on Canada - Market size and forecast 2025-2030 ($ million)
Data Table on Canada - Market size and forecast 2025-2030 ($ million)
Chart on Canada - Year-over-year growth 2025-2030 (%)
Data Table on Canada - Year-over-year growth 2025-2030 (%)

12.3.3 Mexico - Market size and forecast 2025-2030

Chart on Mexico - Market size and forecast 2025-2030 ($ million)
Data Table on Mexico - Market size and forecast 2025-2030 ($ million)
Chart on Mexico - Year-over-year growth 2025-2030 (%)
Data Table on Mexico - Year-over-year growth 2025-2030 (%)

12.4 Europe - Market size and forecast 2025-2030

Chart on Europe - Market size and forecast 2025-2030 ($ million)
Data Table on Europe - Market size and forecast 2025-2030 ($ million)
Chart on Europe - Year-over-year growth 2025-2030 (%)
Data Table on Europe - Year-over-year growth 2025-2030 (%)
Chart on Regional Comparison - Europe
Data Table on Regional Comparison - Europe

12.4.1 Germany - Market size and forecast 2025-2030

Chart on Germany - Market size and forecast 2025-2030 ($ million)
Data Table on Germany - Market size and forecast 2025-2030 ($ million)
Chart on Germany - Year-over-year growth 2025-2030 (%)
Data Table on Germany - Year-over-year growth 2025-2030 (%)

12.4.2 UK - Market size and forecast 2025-2030

Chart on UK - Market size and forecast 2025-2030 ($ million)
Data Table on UK - Market size and forecast 2025-2030 ($ million)
Chart on UK - Year-over-year growth 2025-2030 (%)
Data Table on UK - Year-over-year growth 2025-2030 (%)

12.4.3 France - Market size and forecast 2025-2030

Chart on France - Market size and forecast 2025-2030 ($ million)
Data Table on France - Market size and forecast 2025-2030 ($ million)
Chart on France - Year-over-year growth 2025-2030 (%)
Data Table on France - Year-over-year growth 2025-2030 (%)

12.4.4 Italy - Market size and forecast 2025-2030

Chart on Italy - Market size and forecast 2025-2030 ($ million)
Data Table on Italy - Market size and forecast 2025-2030 ($ million)
Chart on Italy - Year-over-year growth 2025-2030 (%)
Data Table on Italy - Year-over-year growth 2025-2030 (%)

12.4.5 Spain - Market size and forecast 2025-2030

Chart on Spain - Market size and forecast 2025-2030 ($ million)
Data Table on Spain - Market size and forecast 2025-2030 ($ million)
Chart on Spain - Year-over-year growth 2025-2030 (%)
Data Table on Spain - Year-over-year growth 2025-2030 (%)

12.4.6 The Netherlands - Market size and forecast 2025-2030

Chart on The Netherlands - Market size and forecast 2025-2030 ($ million)
Data Table on The Netherlands - Market size and forecast 2025-2030 ($ million)
Chart on The Netherlands - Year-over-year growth 2025-2030 (%)
Data Table on The Netherlands - Year-over-year growth 2025-2030 (%)

12.5 APAC - Market size and forecast 2025-2030

Chart on APAC - Market size and forecast 2025-2030 ($ million)
Data Table on APAC - Market size and forecast 2025-2030 ($ million)
Chart on APAC - Year-over-year growth 2025-2030 (%)
Data Table on APAC - Year-over-year growth 2025-2030 (%)
Chart on Regional Comparison - APAC
Data Table on Regional Comparison - APAC

12.5.1 China - Market size and forecast 2025-2030

Chart on China - Market size and forecast 2025-2030 ($ million)
Data Table on China - Market size and forecast 2025-2030 ($ million)
Chart on China - Year-over-year growth 2025-2030 (%)
Data Table on China - Year-over-year growth 2025-2030 (%)

12.5.2 Japan - Market size and forecast 2025-2030

Chart on Japan - Market size and forecast 2025-2030 ($ million)
Data Table on Japan - Market size and forecast 2025-2030 ($ million)
Chart on Japan - Year-over-year growth 2025-2030 (%)
Data Table on Japan - Year-over-year growth 2025-2030 (%)

12.5.3 India - Market size and forecast 2025-2030

Chart on India - Market size and forecast 2025-2030 ($ million)
Data Table on India - Market size and forecast 2025-2030 ($ million)
Chart on India - Year-over-year growth 2025-2030 (%)
Data Table on India - Year-over-year growth 2025-2030 (%)

12.5.4 Australia - Market size and forecast 2025-2030

Chart on Australia - Market size and forecast 2025-2030 ($ million)
Data Table on Australia - Market size and forecast 2025-2030 ($ million)
Chart on Australia - Year-over-year growth 2025-2030 (%)
Data Table on Australia - Year-over-year growth 2025-2030 (%)

12.5.5 South Korea - Market size and forecast 2025-2030

Chart on South Korea - Market size and forecast 2025-2030 ($ million)
Data Table on South Korea - Market size and forecast 2025-2030 ($ million)
Chart on South Korea - Year-over-year growth 2025-2030 (%)
Data Table on South Korea - Year-over-year growth 2025-2030 (%)

12.5.6 Indonesia - Market size and forecast 2025-2030

Chart on Indonesia - Market size and forecast 2025-2030 ($ million)
Data Table on Indonesia - Market size and forecast 2025-2030 ($ million)
Chart on Indonesia - Year-over-year growth 2025-2030 (%)
Data Table on Indonesia - Year-over-year growth 2025-2030 (%)

12.6 Middle East and Africa - Market size and forecast 2025-2030

Chart on Middle East and Africa - Market size and forecast 2025-2030 ($ million)
Data Table on Middle East and Africa - Market size and forecast 2025-2030 ($ million)
Chart on Middle East and Africa - Year-over-year growth 2025-2030 (%)
Data Table on Middle East and Africa - Year-over-year growth 2025-2030 (%)
Chart on Regional Comparison - Middle East and Africa
Data Table on Regional Comparison - Middle East and Africa

12.6.1 UAE - Market size and forecast 2025-2030

Chart on UAE - Market size and forecast 2025-2030 ($ million)
Data Table on UAE - Market size and forecast 2025-2030 ($ million)
Chart on UAE - Year-over-year growth 2025-2030 (%)
Data Table on UAE - Year-over-year growth 2025-2030 (%)

12.6.2 Saudi Arabia - Market size and forecast 2025-2030

Chart on Saudi Arabia - Market size and forecast 2025-2030 ($ million)
Data Table on Saudi Arabia - Market size and forecast 2025-2030 ($ million)
Chart on Saudi Arabia - Year-over-year growth 2025-2030 (%)
Data Table on Saudi Arabia - Year-over-year growth 2025-2030 (%)

12.6.3 South Africa - Market size and forecast 2025-2030

Chart on South Africa - Market size and forecast 2025-2030 ($ million)
Data Table on South Africa - Market size and forecast 2025-2030 ($ million)
Chart on South Africa - Year-over-year growth 2025-2030 (%)
Data Table on South Africa - Year-over-year growth 2025-2030 (%)

12.6.4 Turkey - Market size and forecast 2025-2030

Chart on Turkey - Market size and forecast 2025-2030 ($ million)
Data Table on Turkey - Market size and forecast 2025-2030 ($ million)
Chart on Turkey - Year-over-year growth 2025-2030 (%)
Data Table on Turkey - Year-over-year growth 2025-2030 (%)

12.6.5 Egypt - Market size and forecast 2025-2030

Chart on Egypt - Market size and forecast 2025-2030 ($ million)
Data Table on Egypt - Market size and forecast 2025-2030 ($ million)
Chart on Egypt - Year-over-year growth 2025-2030 (%)
Data Table on Egypt - Year-over-year growth 2025-2030 (%)

12.7 South America - Market size and forecast 2025-2030

Chart on South America - Market size and forecast 2025-2030 ($ million)
Data Table on South America - Market size and forecast 2025-2030 ($ million)
Chart on South America - Year-over-year growth 2025-2030 (%)
Data Table on South America - Year-over-year growth 2025-2030 (%)
Chart on Regional Comparison - South America
Data Table on Regional Comparison - South America

12.7.1 Brazil - Market size and forecast 2025-2030

Chart on Brazil - Market size and forecast 2025-2030 ($ million)
Data Table on Brazil - Market size and forecast 2025-2030 ($ million)
Chart on Brazil - Year-over-year growth 2025-2030 (%)
Data Table on Brazil - Year-over-year growth 2025-2030 (%)

12.7.2 Argentina - Market size and forecast 2025-2030

Chart on Argentina - Market size and forecast 2025-2030 ($ million)
Data Table on Argentina - Market size and forecast 2025-2030 ($ million)
Chart on Argentina - Year-over-year growth 2025-2030 (%)
Data Table on Argentina - Year-over-year growth 2025-2030 (%)

12.7.3 Chile - Market size and forecast 2025-2030

Chart on Chile - Market size and forecast 2025-2030 ($ million)
Data Table on Chile - Market size and forecast 2025-2030 ($ million)
Chart on Chile - Year-over-year growth 2025-2030 (%)
Data Table on Chile - Year-over-year growth 2025-2030 (%)

12.8 Market opportunity by geography

Market opportunity by geography ($ million)
Data Tables on Market opportunity by geography ($ million)

13. Drivers, Challenges, and Opportunity

13.1 Market drivers

Increasing globalization and workforce mobility
Growing emphasis on diversity, equity, and inclusion
Proliferation of remote and hybrid work models

13.2 Market challenges

Difficulty in quantifying return on investment
Overcoming resistance and ensuring learner application
Balancing standardization with customization

13.3 Impact of drivers and challenges

Impact of drivers and challenges in 2025 and 2030

13.4 Market opportunities

Integration of technology and immersive learning experiences
Shift toward blended and continuous learning journeys
Strategic integration with DEI and talent management

14. Competitive Landscape

14.1 Overview

14.2

Overview on criticality of inputs and factors of differentiation

14.3 Landscape disruption

Overview on factors of disruption

14.4 Industry risks

Impact of key risks on business

15. Competitive Analysis

15.1 Companies profiled

Companies covered

15.2 Company ranking index

15.3 Market positioning of companies

Matrix on companies position and classification

15.4 Berlitz Corp.

Berlitz Corp. - Overview
Berlitz Corp. - Product / Service
Berlitz Corp. - Key offerings
SWOT

15.5 Cartus Corp

Cartus Corp - Overview
Cartus Corp - Product / Service
Cartus Corp - Key offerings
SWOT

15.6 Cultural Awareness International

Cultural Awareness International - Overview
Cultural Awareness International - Product / Service
Cultural Awareness International - Key offerings
SWOT

15.7 Cultural Intelligence Center

Cultural Intelligence Center - Overview
Cultural Intelligence Center - Product / Service
Cultural Intelligence Center - Key offerings
SWOT

15.8 Dwellworks LLC

Dwellworks LLC - Overview
Dwellworks LLC - Product / Service
Dwellworks LLC - Key offerings
SWOT

15.9 Farnham Castle Training

Farnham Castle Training - Overview
Farnham Castle Training - Product / Service
Farnham Castle Training - Key offerings
SWOT

15.10 Global LT Ltd.

Global LT Ltd. - Overview
Global LT Ltd. - Product / Service
Global LT Ltd. - Key offerings
SWOT

15.11 Learnlight Software S.L.U.

Learnlight Software S.L.U. - Overview
Learnlight Software S.L.U. - Product / Service
Learnlight Software S.L.U. - Key offerings
SWOT

15.12 Mitchell Memorial Training

Mitchell Memorial Training - Overview
Mitchell Memorial Training - Product / Service
Mitchell Memorial Training - Key offerings
SWOT

15.13 NetExpat

NetExpat - Overview
NetExpat - Product / Service
NetExpat - Key offerings
SWOT

15.14 Santa Fe Group Ltd.

Santa Fe Group Ltd. - Overview
Santa Fe Group Ltd. - Product / Service
Santa Fe Group Ltd. - Key offerings
SWOT

15.15 SIRVA Worldwide Inc.

SIRVA Worldwide Inc. - Overview
SIRVA Worldwide Inc. - Product / Service
SIRVA Worldwide Inc. - Key offerings
SWOT

15.16 The Culture Factor Group

The Culture Factor Group - Overview
The Culture Factor Group - Product / Service
The Culture Factor Group - Key offerings
SWOT

15.17 The Culture Mastery

The Culture Mastery - Overview
The Culture Mastery - Product / Service
The Culture Mastery - Key offerings
SWOT

15.18 Weichert Workforce Mobility Inc.

Weichert Workforce Mobility Inc. - Overview
Weichert Workforce Mobility Inc. - Product / Service
Weichert Workforce Mobility Inc. - Key offerings
SWOT

16. Appendix

16.1 Scope of the report

Market definition
Objectives
Notes and caveats

16.2 Inclusions and exclusions checklist

Inclusions checklist
Exclusions checklist

16.3 Currency conversion rates for US$

16.4 Research methodology

16.5 Data procurement

Information sources

16.6 Data validation

16.7 Validation techniques employed for market sizing

16.8 Data synthesis

16.9 360 degree market analysis

16.10 List of abbreviations

Research Methodology

Technavio presents a detailed picture of the market by way of study, synthesis, and summation of data from multiple sources. The analysts have presented the various facets of the market with a particular focus on identifying the key industry influencers. The data thus presented is comprehensive, reliable, and the result of extensive research, both primary and secondary.

INFORMATION SOURCES

Primary sources

  • Manufacturers and suppliers
  • Channel partners
  • Industry experts
  • Strategic decision makers

Secondary sources

  • Industry journals and periodicals
  • Government data
  • Financial reports of key industry players
  • Historical data
  • Press releases

DATA ANALYSIS

Data Synthesis

  • Collation of data
  • Estimation of key figures
  • Analysis of derived insights

Data Validation

  • Triangulation with data models
  • Reference against proprietary databases
  • Corroboration with industry experts

REPORT WRITING

Qualitative

  • Market drivers
  • Market challenges
  • Market trends
  • Five forces analysis

Quantitative

  • Market size and forecast
  • Market segmentation
  • Geographical insights
  • Competitive landscape

Interested in this report?

Get your sample now to see our research methodology and insights!

Download Now

Frequently Asked Questions

Cross-Cultural Training market growth will increase by USD 2083.3 million during 2026-2030.

The Cross-Cultural Training market is expected to grow at a CAGR of 6.9% during 2026-2030.

Cross-Cultural Training market is segmented by Deployment (Workshop, Online) End-user (Large enterprise, Small and medium enterprise) Application (Business skills, Cultural awareness)

Berlitz Corp., Cartus Corp, Cultural Awareness International, Cultural Intelligence Center, Culture Crossing, Dwellworks LLC, Farnham Castle Training, Global Business Culture, Global Integration Inc., Global LT Ltd., Learnlight Software S.L.U., Mitchell Memorial Training, NetExpat, RW3 LLC, Santa Fe Group Ltd., SIRVA Worldwide Inc., The Culture Factor Group, The Culture Mastery, Upskilled, Weichert Workforce Mobility Inc. are a few of the key vendors in the Cross-Cultural Training market.

North America will register the highest growth rate of 31.3% among the other regions. Therefore, the Cross-Cultural Training market in North America is expected to garner significant business opportunities for the vendors during the forecast period.

US, Canada, Mexico, Germany, UK, France, Italy, Spain, The Netherlands, China, Japan, India, Australia, South Korea, Indonesia, UAE, Saudi Arabia, South Africa, Turkey, Egypt, Brazil, Argentina, Chile

  • Increasing globalization and workforce mobility is the driving factor this market.

The Cross-Cultural Training market vendors should focus on grabbing business opportunities from the Deployment segment as it accounted for the largest market share in the base year.
RIA - Research AI Assistant
Ask RIA
