
Customs Audit Market Analysis, Size, and Forecast 2026-2030: North America (US, Canada, and Mexico), Europe (Germany, UK, and France), APAC (China, Japan, and India), South America (Brazil, Argentina, and Chile), Middle East and Africa (Saudi Arabia, UAE, and South Africa), and Rest of World (ROW)

Customs Audit Market Analysis, Size, and Forecast 2026-2030:
North America (US, Canada, and Mexico), Europe (Germany, UK, and France), APAC (China, Japan, and India), South America (Brazil, Argentina, and Chile), Middle East and Africa (Saudi Arabia, UAE, and South Africa), and Rest of World (ROW)

Published: Oct 2026 305 Pages SKU: IRTNTR46406

Market Overview at a Glance

$2.77 B
Market Opportunity
3.8%
CAGR 2025 - 2030
37%
APAC Growth
$9.23 B
Customs audit services segment 2024

Customs Audit Market Size 2026-2030

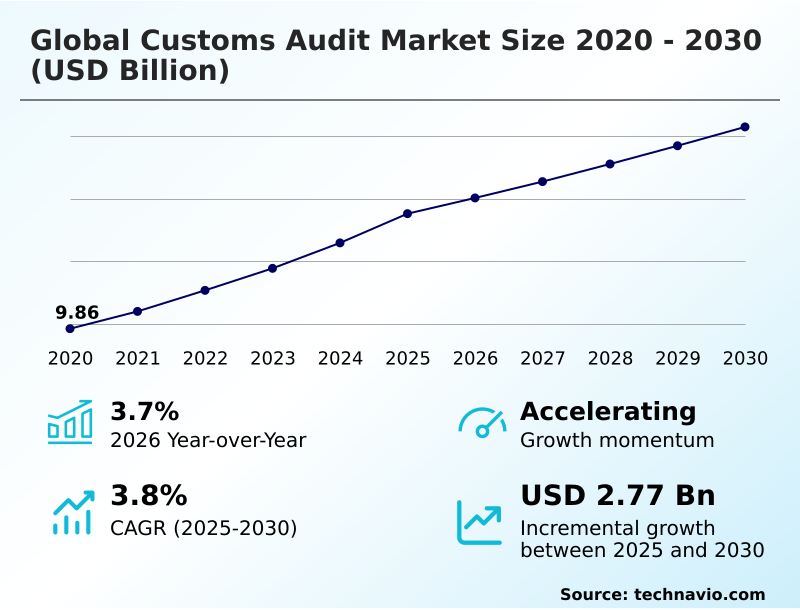
The customs audit market size is valued to increase by USD 2.77 billion, at a CAGR of 3.8% from 2025 to 2030. Increasing cross-border trade complexity will drive the customs audit market.

Major Market Trends & Insights

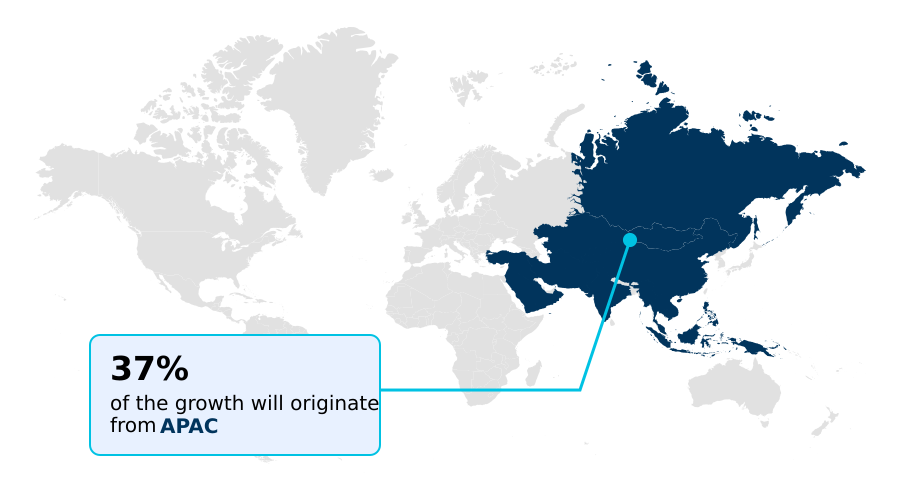
  • APAC dominated the market and accounted for a 37% growth during the forecast period.
  • By Service - Customs audit services segment was valued at USD 9.23 billion in 2024
  • By Type - Financial audit segment accounted for the largest market revenue share in 2024

Market Size & Forecast

  • Market Opportunities: USD 6.43 billion
  • Market Future Opportunities: USD 2.77 billion
  • CAGR from 2025 to 2030 : 3.8%

Market Summary

  • Customs Audit Market activity expands as international trade networks grow increasingly complex and regulatory authorities intensify compliance enforcement. Companies engaged in multinational manufacturing must continuously validate tariff classifications, origin claims, and valuation methodologies to prevent costly border delays.
  • For example, a heavy machinery manufacturer optimizing its regional supply chain relies on rigorous compliance assessments to align procurement strategies with shifting free trade agreements. Businesses utilizing automated trade management platforms experience a 25% improvement in processing efficiency compared to those relying on manual recordkeeping.
  • The escalating complexity of cross-border trade acts as a primary catalyst for market expansion, compelling organizations to adopt sophisticated verification processes. Conversely, regulatory fragmentation across different jurisdictions presents a substantial challenge, increasing the administrative burden and complicating standardized compliance efforts. These disparate regulatory frameworks require highly specialized expertise to navigate successfully.
  • Robust operational audit readiness mitigates financial risks and ensures seamless cross-border transaction reconciliation. Strategic investments in continuous compliance monitoring allow enterprises to maintain resilient operations amid evolving international trade policies.

What will be the Size of the Customs Audit Market during the forecast period?
Get Key Insights on Market Forecast (PDF) Get Free Sample

How is the Customs Audit Market Segmented?

The customs audit industry research report provides comprehensive data (region-wise segment analysis), with forecasts and estimates in "USD million" for the period 2026-2030, as well as historical data from 2020-2024 for the following segments.

  • Service
    • Customs audit services
    • Customs advisory services
  • Type
    • Financial audit
    • Operational audit
    • Compliance audit
    • Risk management audit
    • Others
  • End-user
    • Large enterprises
    • SMEs
  • Geography
    • North America
      • US
      • Canada
      • Mexico
    • Europe
      • Germany
      • UK
      • France
      • Italy
      • Spain
      • The Netherlands
    • APAC
      • China
      • Japan
      • India
      • South Korea
      • Australia
      • Indonesia
    • South America
      • Brazil
      • Argentina
      • Chile
    • Middle East and Africa
      • Saudi Arabia
      • UAE
      • South Africa
      • Israel
      • Turkey

By Service Insights

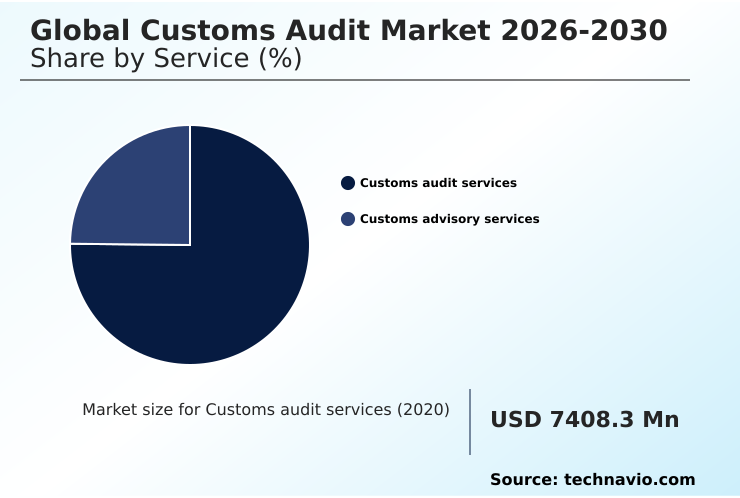
The customs audit services segment is estimated to witness significant growth during the forecast period.

Customs audit services provide essential verification mechanisms for businesses managing intricate cross-border transactions. Organizations increasingly utilize these services to strengthen their supply chain security protocol and improve trade operations transparency.

Implementation of intelligent document extraction during a routine transaction testing procedure enhances error detection by 15% and accelerates review cycles. By adopting continuous compliance monitoring, companies proactively manage their customs risk profile and ensure precise landed cost calculation.

This structured oversight facilitates robust non compliant import detection and supports comprehensive compliance vulnerability mapping. The ongoing shift toward customs process digitalization allows businesses to evaluate compliance performance with greater accuracy.

Consequently, these systematic evaluation processes reduce penalty exposure and fortify overall operational integrity across international trade networks.
Get Free Sample

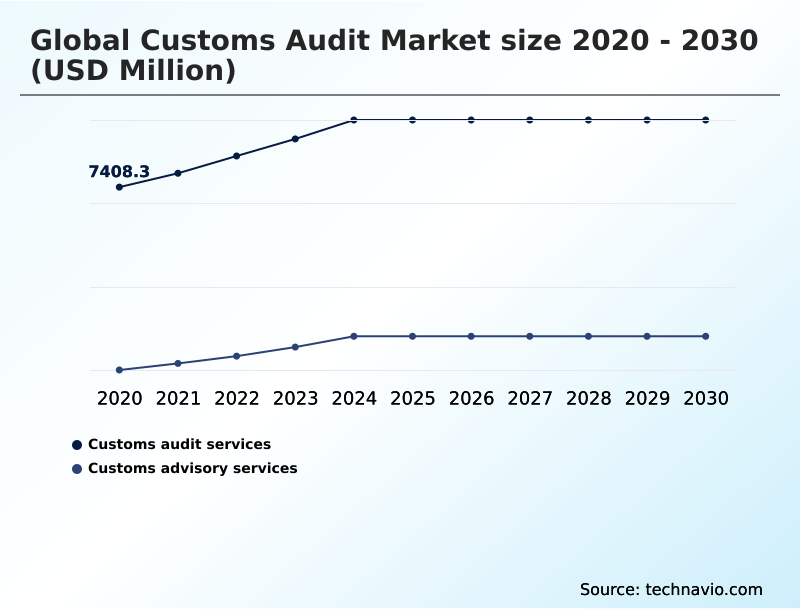
The Customs audit services segment was valued at USD 9.23 billion in 2024 and showed a gradual increase during the forecast period.
Get Free Sample

Regional Analysis

APAC is estimated to contribute 37% to the growth of the global market during the forecast period.Technavio’s analysts have elaborately explained the regional trends and drivers that shape the market during the forecast period.
See How Customs Audit Market Demand is Rising in APAC Get Free Sample

Regional variations in trade administration require organizations to adjust strategies based on specific regulatory expectations. In APAC, rapid industrial expansion drives a 35% higher adoption of trade intelligence platform tools compared to European markets.

Businesses in these high-growth areas prioritize comprehensive customs broker assessment and strict documentation retention policy enforcement to minimize import tax liability.

Conversely, North American operations focus heavily on operational audit readiness and procurement function alignment to ensure seamless electronic data interchange mapping. Developing a standardized corporate governance model facilitates effective regulatory penalty mitigation across all geographic operating units.

Proper transfer pricing customs integration remains critical for multinational entities seeking to optimize tax burdens while maintaining compliance. These regional strategies reduce operational downtime by 20%, ensuring resilient cross-border supply chains.

Market Dynamics

Our researchers analyzed the data with 2025 as the base year, along with the key drivers, trends, and challenges. A holistic analysis of drivers will help companies refine their marketing strategies to gain a competitive advantage.

  • The modern international trade environment demands rigorous oversight, pushing organizations to adopt automated tariff classification validation tools that minimize declaration errors. Navigating complex regulatory landscapes requires precise free trade agreement qualification procedures to ensure enterprises capture available tariff benefits without risking compliance violations.
  • To maintain resilience, businesses are implementing continuous post clearance audit frameworks that identify discrepancies long before regulatory authorities intervene. Enhanced cross border supply chain traceability allows companies to track materials accurately from source to destination. By deploying digital customs documentation management systems, organizations achieve a 30% faster review cycle compared to traditional paper-based methods, directly improving operational planning.
  • Companies also utilize specialized import duty drawback recovery methods to reclaim overpaid duties, optimizing financial performance. Strict origin verification for manufacturing operations ensures that finished goods meet local content requirements under specific trade pacts. Routine transaction level customs compliance checks safeguard daily import operations against costly regulatory missteps.
  • Reconciling transfer pricing and customs valuation remains critical for multinational corporations seeking to align corporate tax strategies with customs reporting standards. Furthermore, structured trade data validation processes ensure that information transmitted via electronic data interchange for declarations is accurate and fully compliant. Comprehensive historical entry review and reconciliation helps businesses rectify past errors and prevent future penalties.
  • Engaging in proactive customs risk profile management allows supply chain leaders to anticipate regulatory shifts effectively. Organizations must also refine their harmonized system code mapping strategies to prevent misclassification. Ultimately, integrating these measures fortifies supply chain security and compliance across the entire logistics network.
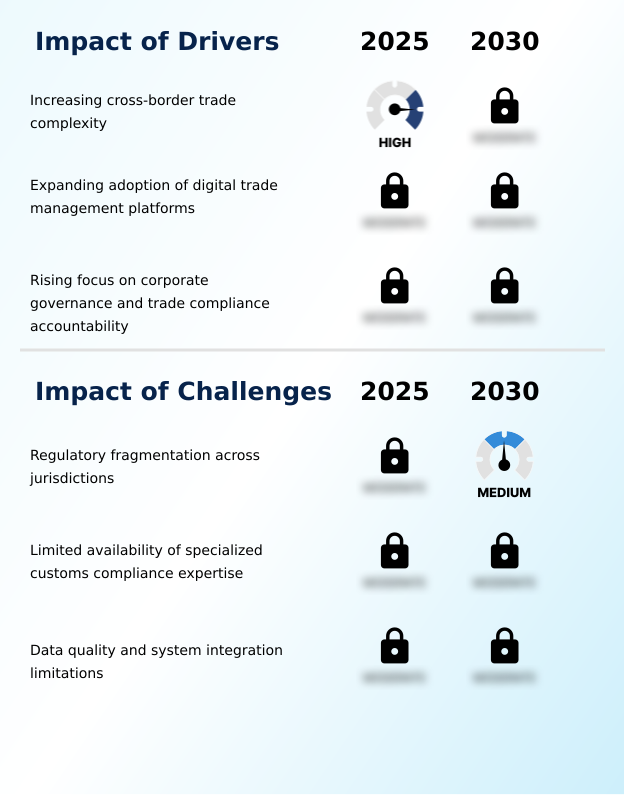
What are the key market drivers leading to the rise in the adoption of Customs Audit Industry?

  • The escalating complexity of cross-border trade acts as a primary catalyst for market expansion, compelling organizations to adopt sophisticated compliance verification processes.

  • Intensifying regulatory scrutiny demands that businesses implement a robust regulatory interpretation framework to sustain international operations. Growing transaction volumes drive the need for accurate customs valuation framework applications and consistent cross border transaction reconciliation.
  • Companies leveraging workflow automation integration typically see a 25% improvement in processing efficiency and a 15% reduction in administrative costs. Strong data quality governance directly supports accurate import declaration screening and enhances overall supply chain traceability.
  • This comprehensive approach mandates rigorous cross functional trade oversight, empowering organizations to conduct thorough predictive risk assessment initiatives. By preparing effectively for a post clearance audit, businesses mitigate financial risks and optimize supply chain velocity.
  • This proactive compliance strategy ensures that organizations remain resilient amid frequent shifts in global trade policies.

What are the market trends shaping the Customs Audit Industry?

  • The rapid expansion of cross-border e-commerce represents a significant trend influencing the market. This surge in international digital retail necessitates more robust compliance verification frameworks to handle increasing low-value shipment volumes.

  • The evolving nature of cross-border commerce pushes companies to adopt automated trade management for enhanced operational efficiency. Organizations engaged in supply chain restructuring increasingly rely on historical entry review procedures to identify documentation discrepancy resolution opportunities. By integrating an automated compliance check, businesses improve forecast accuracy by 18% and reduce declaration errors significantly.
  • This shift toward digital oversight transforms how organizations approach tariff classification methodology and country of origin verification. A robust operational control environment is now essential to secure duty drawback optimization and maximize free trade agreement utilization. The transition impacts business resilience, allowing organizations to decrease penalty exposure by 22% while ensuring uninterrupted trade flows.
  • This continuous modernization ensures that compliance frameworks adapt seamlessly to changing international regulations.

What challenges does the Customs Audit Industry face during its growth?

  • Regulatory fragmentation across different jurisdictions presents a substantial challenge, complicating compliance efforts and increasing the administrative burden for multinational trade operations.

  • Regulatory fragmentation across multiple jurisdictions creates significant hurdles for maintaining consistent transaction level compliance. Companies expanding through digital retail expansion struggle with complex harmonized system code mapping and accurate preferential origin determination. Fragmented systems hinder effective trade data validation, leading to a 30% increase in compliance processing time and elevated risk of fines.
  • Without a unified digital customs infrastructure, organizations face difficulties in managing high volumes of import export documentation. Inconsistent recordkeeping limits process deviation detection and complicates accurate duty exposure calculation. To overcome these limitations, companies must consolidate isolated records into a structured trade dataset that supports seamless verification.
  • Addressing these operational constraints is critical for preventing shipment delays and minimizing vulnerability to regulatory enforcement actions.

Exclusive Technavio Analysis on Customer Landscape

The customs audit market forecasting report includes the adoption lifecycle of the market, covering from the innovator’s stage to the laggard’s stage. It focuses on adoption rates in different regions based on penetration. Furthermore, the customs audit market report also includes key purchase criteria and drivers of price sensitivity to help companies evaluate and develop their market growth analysis strategies.
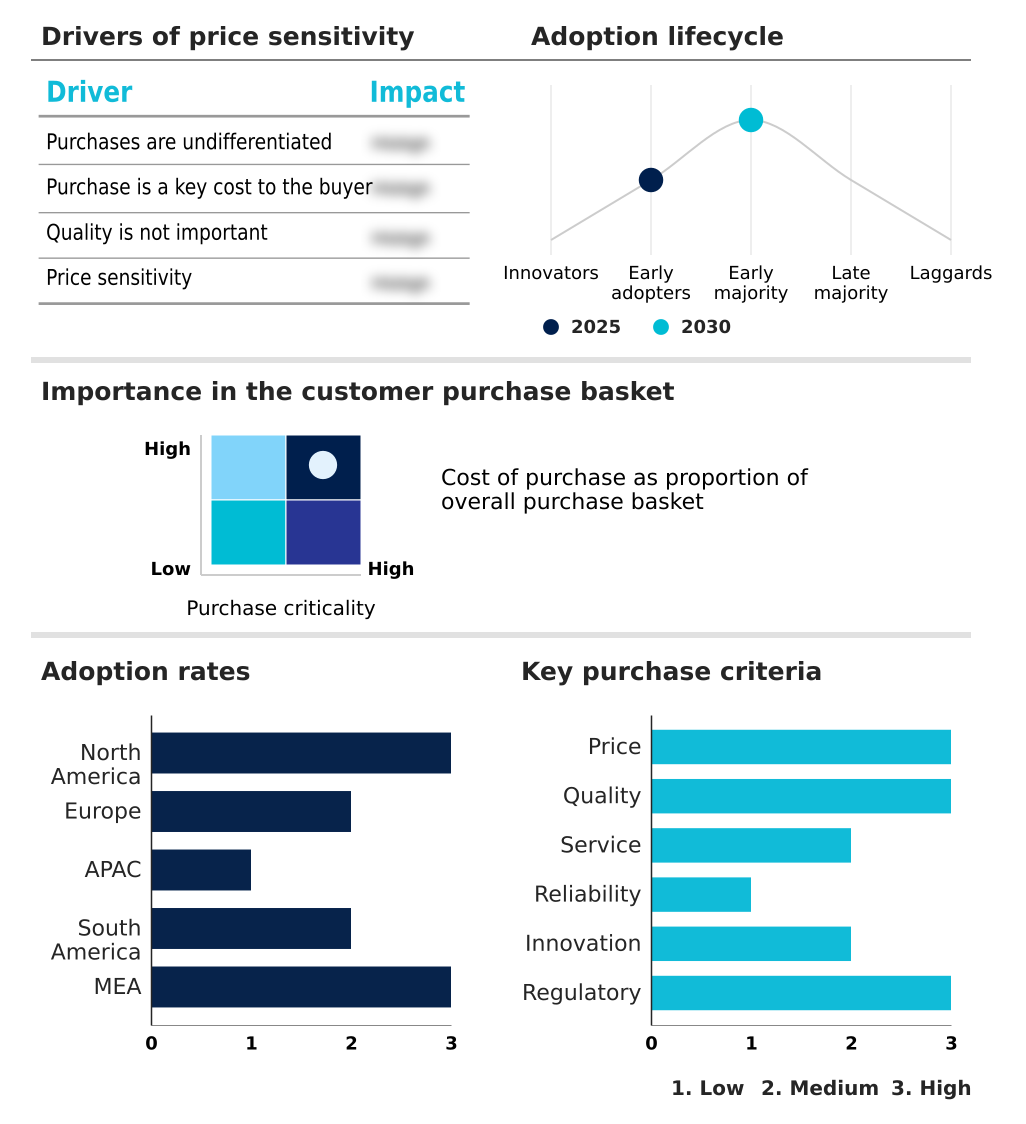
Customer Landscape of Customs Audit Industry

Competitive Landscape

Companies are implementing various strategies, such as strategic alliances, customs audit market forecast, partnerships, mergers and acquisitions, geographical expansion, and product/service launches, to enhance their presence in the industry.

AEB SE - Provides customs management software enabling automated import and export declarations, origin tracking, preference management, supplier oversight, export controls, and comprehensive global trade compliance operations.

The industry research and growth report includes detailed analyses of the competitive landscape of the market and information about key companies, including:

  • AEB SE
  • AP Moller Maersk AS
  • BDO International Ltd.
  • Crane Worldwide Logistics
  • Deloitte Touche Tohmatsu Ltd.
  • Descartes Systems Group Inc.
  • DHL International GmbH
  • E2open Parent Holdings Inc.
  • Ernst and Young Global Ltd.
  • FedEx Corp.
  • Forvis Mazars Group
  • Grant Thornton International
  • KPMG International Ltd.
  • Kuehne Nagel Management AG
  • Livingston International Inc.
  • MIC Datenverarbeitung GmbH
  • PricewaterhouseCoopers LLP
  • PSA BDP
  • SAP SE
  • Thomson Reuters Corp.
  • United Parcel Service Inc.

Qualitative and quantitative analysis of companies has been conducted to help clients understand the wider business environment as well as the strengths and weaknesses of key industry players. Data is qualitatively analyzed to categorize companies as pure play, category-focused, industry-focused, and diversified; it is quantitatively analyzed to categorize companies as dominant, leading, strong, tentative, and weak.

Recent Development and News in Customs audit market

  • In the Specialized Consumer Services industry, the implementation of stricter cross-border data privacy regulations has forced service providers to upgrade digital recordkeeping systems, directly impacting Customs Audit demand by requiring enhanced validation of international transaction histories.
  • The widespread adoption of workflow automation integration across B2B service sectors has reduced manual processing errors by 22%, driving the Customs Audit market by enabling faster, more reliable examination of large-scale trade compliance data.
  • Shifting procurement strategies toward localized sourcing models has increased supply chain complexity, necessitating continuous compliance monitoring and pulling Customs Audit demand upward to verify newly established regional supplier networks.
  • Expanding corporate governance model mandates for supply chain transparency have compelled enterprise clients to enforce rigorous vendor compliance checks, directly increasing Customs Audit activity to validate supplier declarations and operational audit readiness.

Dive into Technavio’s robust research methodology, blending expert interviews, extensive data synthesis, and validated models for unparalleled Customs Audit Market insights. See full methodology.

Market Scope
Page number 305
Base year 2025
Historic period 2020-2024
Forecast period 2026-2030
Growth momentum & CAGR Accelerate at a CAGR of 3.8%
Market growth 2026-2030 USD 2766.9 million
Market structure Fragmented
YoY growth 2025-2026(%) 3.7%
Key countries US, Canada, Mexico, Germany, UK, France, Italy, Spain, The Netherlands, China, Japan, India, South Korea, Australia, Indonesia, Brazil, Argentina, Chile, Saudi Arabia, UAE, South Africa, Israel and Turkey
Competitive landscape Leading Companies, Market Positioning of Companies, Competitive Strategies, and Industry Risks

Request Free Sample

Research Analyst Overview

  • The Customs Audit landscape undergoes continuous transformation as regulatory authorities enforce stricter cross-border compliance standards and documentation requirements. Businesses prioritize advanced automated trade management systems to navigate evolving tariffs and complex supply chain networks efficiently. A refined tariff classification methodology ensures precise reporting, significantly reducing the likelihood of border delays.
  • Organizations utilizing sophisticated software for import declaration screening have achieved a 30% reduction in processing time compared to those managing records manually. Accurate country of origin verification directly impacts product pricing strategies and procurement decisions, ensuring companies maximize free trade agreement utilization. Furthermore, proactive duty drawback optimization allows enterprises to recover substantial costs, freeing capital for core business investments.
  • Establishing a defensible customs valuation framework remains critical for maintaining compliant pricing structures and preventing regulatory disputes. Consistent cross border transaction reconciliation provides executive teams with transparent financial data, enabling highly informed boardroom-level decisions regarding international market expansion. These systematic oversight mechanisms strengthen enterprise resilience, secure supply chain continuity, and ensure unwavering adherence to international trade regulations.

What are the Key Data Covered in this Customs Audit Market Research and Growth Report?

  • What is the expected growth of the Customs Audit Market between 2026 and 2030?

    • USD 2.77 billion, at a CAGR of 3.8%

  • What segmentation does the market report cover?

    • The report is segmented by Service (Customs audit services, and Customs advisory services), Type (Financial audit, Operational audit, Compliance audit, Risk management audit, and Others), End-user (Large enterprises, and SMEs) and Geography (North America, Europe, APAC, South America, Middle East and Africa)

  • Which regions are analyzed in the report?

    • North America, Europe, APAC, South America and Middle East and Africa

  • What are the key growth drivers and market challenges?

    • Increasing cross-border trade complexity, Regulatory fragmentation across jurisdictions

  • Who are the major players in the Customs Audit Market?

    • AEB SE, AP Moller Maersk AS, BDO International Ltd., Crane Worldwide Logistics, Deloitte Touche Tohmatsu Ltd., Descartes Systems Group Inc., DHL International GmbH, E2open Parent Holdings Inc., Ernst and Young Global Ltd., FedEx Corp., Forvis Mazars Group, Grant Thornton International, KPMG International Ltd., Kuehne Nagel Management AG, Livingston International Inc., MIC Datenverarbeitung GmbH, PricewaterhouseCoopers LLP, PSA BDP, SAP SE, Thomson Reuters Corp. and United Parcel Service Inc.

Market Research Insights

  • The Customs Audit Market evolves rapidly as organizations integrate an advanced trade intelligence platform to manage complex regulatory requirements. By deploying an automated compliance check, businesses reduce administrative processing time by 20% and enhance overall supply chain resilience. Maintaining a strict documentation retention policy ensures seamless historical entry review processes, cutting penalty exposure by 15%.
  • This operational shift drives improved cross functional trade oversight, enabling procurement and finance teams to align strategies efficiently. Establishing a comprehensive corporate governance model supports proactive risk management, allowing enterprises to identify compliance gaps before regulatory audits occur. These strategic compliance initiatives streamline cross-border operations, protect profit margins, and guarantee uninterrupted international commerce flow.

We can help! Our analysts can customize this customs audit market research report to meet your requirements.

Get in touch

1. Executive Summary

1.1 Market overview

Executive Summary - Chart on Market Overview
Executive Summary - Data Table on Market Overview
Executive Summary - Chart on Global Market Characteristics
Executive Summary - Chart on Market by Geography
Executive Summary - Chart on Market Segmentation by Service
Executive Summary - Chart on Market Segmentation by Type
Executive Summary - Chart on Market Segmentation by End-user
Executive Summary - Chart on Incremental Growth
Executive Summary - Data Table on Incremental Growth
Executive Summary - Chart on Company Market Positioning

2. Technavio Analysis

2.1 Analysis of price sensitivity, lifecycle, customer purchase basket, adoption rates, and purchase criteria

2.2 Criticality of inputs and Factors of differentiation

Chart on Overview on criticality of inputs and factors of differentiation

2.3 Factors of disruption

Chart on Overview on factors of disruption

2.4 Impact of drivers and challenges

Chart on Impact of drivers and challenges in 2025 and 2030

3. Market Landscape

3.1 Market ecosystem

Chart on Parent Market
Data Table on - Parent Market

3.2 Market characteristics

Chart on Market characteristics analysis

3.3 Value chain analysis

Chart on Value chain analysis

4. Market Sizing

4.1 Market definition

Data Table on Offerings of companies included in the market definition

4.2 Market segment analysis

Market segments

4.3 Market size 2025

4.4 Market outlook: Forecast for 2025-2030

Chart on Global - Market size and forecast 2025-2030 ($ million)
Data Table on Global - Market size and forecast 2025-2030 ($ million)
Chart on Global Market: Year-over-year growth 2025-2030 (%)
Data Table on Global Market: Year-over-year growth 2025-2030 (%)

5. Historic Market Size

5.1 Global Customs Audit Market 2020 - 2024

Historic Market Size - Data Table on Global Customs Audit Market 2020 - 2024 ($ million)

5.2 Service segment analysis 2020 - 2024

Historic Market Size - Service Segment 2020 - 2024 ($ million)

5.3 Type segment analysis 2020 - 2024

Historic Market Size - Type Segment 2020 - 2024 ($ million)

5.4 End-user segment analysis 2020 - 2024

Historic Market Size - End-user Segment 2020 - 2024 ($ million)

5.5 Geography segment analysis 2020 - 2024

Historic Market Size - Geography Segment 2020 - 2024 ($ million)

5.6 Country segment analysis 2020 - 2024

Historic Market Size - Country Segment 2020 - 2024 ($ million)

6. Qualitative Analysis

6.1 Impact of AI on global customs audit market

6.2 Impact of geopolitical conflicts on global customs audit market

7. Five Forces Analysis

7.1 Five forces summary

Five forces analysis - Comparison between 2025 and 2030

7.2 Bargaining power of buyers

Bargaining power of buyers - Impact of key factors 2025 and 2030

7.3 Bargaining power of suppliers

Bargaining power of suppliers - Impact of key factors in 2025 and 2030

7.4 Threat of new entrants

Threat of new entrants - Impact of key factors in 2025 and 2030

7.5 Threat of substitutes

Threat of substitutes - Impact of key factors in 2025 and 2030

7.6 Threat of rivalry

Threat of rivalry - Impact of key factors in 2025 and 2030

7.7 Market condition

Chart on Market condition - Five forces 2025 and 2030

8. Market Segmentation by Service

8.1 Market segments

Chart on Service - Market share 2025-2030 (%)
Data Table on Service - Market share 2025-2030 (%)

8.2 Comparison by Service

Chart on Comparison by Service
Data Table on Comparison by Service

8.3 Customs audit services - Market size and forecast 2025-2030

Chart on Customs audit services - Market size and forecast 2025-2030 ($ million)
Data Table on Customs audit services - Market size and forecast 2025-2030 ($ million)
Chart on Customs audit services - Year-over-year growth 2025-2030 (%)
Data Table on Customs audit services - Year-over-year growth 2025-2030 (%)

8.4 Customs advisory services - Market size and forecast 2025-2030

Chart on Customs advisory services - Market size and forecast 2025-2030 ($ million)
Data Table on Customs advisory services - Market size and forecast 2025-2030 ($ million)
Chart on Customs advisory services - Year-over-year growth 2025-2030 (%)
Data Table on Customs advisory services - Year-over-year growth 2025-2030 (%)

8.5 Market opportunity by Service

Market opportunity by Service ($ million)
Data Table on Market opportunity by Service ($ million)

9. Market Segmentation by Type

9.1 Market segments

Chart on Type - Market share 2025-2030 (%)
Data Table on Type - Market share 2025-2030 (%)

9.2 Comparison by Type

Chart on Comparison by Type
Data Table on Comparison by Type

9.3 Financial audit - Market size and forecast 2025-2030

Chart on Financial audit - Market size and forecast 2025-2030 ($ million)
Data Table on Financial audit - Market size and forecast 2025-2030 ($ million)
Chart on Financial audit - Year-over-year growth 2025-2030 (%)
Data Table on Financial audit - Year-over-year growth 2025-2030 (%)

9.4 Operational audit - Market size and forecast 2025-2030

Chart on Operational audit - Market size and forecast 2025-2030 ($ million)
Data Table on Operational audit - Market size and forecast 2025-2030 ($ million)
Chart on Operational audit - Year-over-year growth 2025-2030 (%)
Data Table on Operational audit - Year-over-year growth 2025-2030 (%)

9.5 Compliance audit - Market size and forecast 2025-2030

Chart on Compliance audit - Market size and forecast 2025-2030 ($ million)
Data Table on Compliance audit - Market size and forecast 2025-2030 ($ million)
Chart on Compliance audit - Year-over-year growth 2025-2030 (%)
Data Table on Compliance audit - Year-over-year growth 2025-2030 (%)

9.6 Risk management audit - Market size and forecast 2025-2030

Chart on Risk management audit - Market size and forecast 2025-2030 ($ million)
Data Table on Risk management audit - Market size and forecast 2025-2030 ($ million)
Chart on Risk management audit - Year-over-year growth 2025-2030 (%)
Data Table on Risk management audit - Year-over-year growth 2025-2030 (%)

9.7 Others - Market size and forecast 2025-2030

Chart on Others - Market size and forecast 2025-2030 ($ million)
Data Table on Others - Market size and forecast 2025-2030 ($ million)
Chart on Others - Year-over-year growth 2025-2030 (%)
Data Table on Others - Year-over-year growth 2025-2030 (%)

9.8 Market opportunity by Type

Market opportunity by Type ($ million)
Data Table on Market opportunity by Type ($ million)

10. Market Segmentation by End-user

10.1 Market segments

Chart on End-user - Market share 2025-2030 (%)
Data Table on End-user - Market share 2025-2030 (%)

10.2 Comparison by End-user

Chart on Comparison by End-user
Data Table on Comparison by End-user

10.3 Large enterprises - Market size and forecast 2025-2030

Chart on Large enterprises - Market size and forecast 2025-2030 ($ million)
Data Table on Large enterprises - Market size and forecast 2025-2030 ($ million)
Chart on Large enterprises - Year-over-year growth 2025-2030 (%)
Data Table on Large enterprises - Year-over-year growth 2025-2030 (%)

10.4 SMEs - Market size and forecast 2025-2030

Chart on SMEs - Market size and forecast 2025-2030 ($ million)
Data Table on SMEs - Market size and forecast 2025-2030 ($ million)
Chart on SMEs - Year-over-year growth 2025-2030 (%)
Data Table on SMEs - Year-over-year growth 2025-2030 (%)

10.5 Market opportunity by End-user

Market opportunity by End-user ($ million)
Data Table on Market opportunity by End-user ($ million)

11. Customer Landscape

11.1 Customer landscape overview

Analysis of price sensitivity, lifecycle, customer purchase basket, adoption rates, and purchase criteria

12. Geographic Landscape

12.1 Geographic segmentation

Chart on Market share by geography 2025-2030 (%)
Data Table on Market share by geography 2025-2030 (%)

12.2 Geographic comparison

Chart on Geographic comparison
Data Table on Geographic comparison

12.3 North America - Market size and forecast 2025-2030

Chart on North America - Market size and forecast 2025-2030 ($ million)
Data Table on North America - Market size and forecast 2025-2030 ($ million)
Chart on North America - Year-over-year growth 2025-2030 (%)
Data Table on North America - Year-over-year growth 2025-2030 (%)
Chart on Regional Comparison - North America
Data Table on Regional Comparison - North America

12.3.1 US - Market size and forecast 2025-2030

Chart on US - Market size and forecast 2025-2030 ($ million)
Data Table on US - Market size and forecast 2025-2030 ($ million)
Chart on US - Year-over-year growth 2025-2030 (%)
Data Table on US - Year-over-year growth 2025-2030 (%)

12.3.2 Canada - Market size and forecast 2025-2030

Chart on Canada - Market size and forecast 2025-2030 ($ million)
Data Table on Canada - Market size and forecast 2025-2030 ($ million)
Chart on Canada - Year-over-year growth 2025-2030 (%)
Data Table on Canada - Year-over-year growth 2025-2030 (%)

12.3.3 Mexico - Market size and forecast 2025-2030

Chart on Mexico - Market size and forecast 2025-2030 ($ million)
Data Table on Mexico - Market size and forecast 2025-2030 ($ million)
Chart on Mexico - Year-over-year growth 2025-2030 (%)
Data Table on Mexico - Year-over-year growth 2025-2030 (%)

12.4 Europe - Market size and forecast 2025-2030

Chart on Europe - Market size and forecast 2025-2030 ($ million)
Data Table on Europe - Market size and forecast 2025-2030 ($ million)
Chart on Europe - Year-over-year growth 2025-2030 (%)
Data Table on Europe - Year-over-year growth 2025-2030 (%)
Chart on Regional Comparison - Europe
Data Table on Regional Comparison - Europe

12.4.1 Germany - Market size and forecast 2025-2030

Chart on Germany - Market size and forecast 2025-2030 ($ million)
Data Table on Germany - Market size and forecast 2025-2030 ($ million)
Chart on Germany - Year-over-year growth 2025-2030 (%)
Data Table on Germany - Year-over-year growth 2025-2030 (%)

12.4.2 UK - Market size and forecast 2025-2030

Chart on UK - Market size and forecast 2025-2030 ($ million)
Data Table on UK - Market size and forecast 2025-2030 ($ million)
Chart on UK - Year-over-year growth 2025-2030 (%)
Data Table on UK - Year-over-year growth 2025-2030 (%)

12.4.3 France - Market size and forecast 2025-2030

Chart on France - Market size and forecast 2025-2030 ($ million)
Data Table on France - Market size and forecast 2025-2030 ($ million)
Chart on France - Year-over-year growth 2025-2030 (%)
Data Table on France - Year-over-year growth 2025-2030 (%)

12.4.4 Italy - Market size and forecast 2025-2030

Chart on Italy - Market size and forecast 2025-2030 ($ million)
Data Table on Italy - Market size and forecast 2025-2030 ($ million)
Chart on Italy - Year-over-year growth 2025-2030 (%)
Data Table on Italy - Year-over-year growth 2025-2030 (%)

12.4.5 Spain - Market size and forecast 2025-2030

Chart on Spain - Market size and forecast 2025-2030 ($ million)
Data Table on Spain - Market size and forecast 2025-2030 ($ million)
Chart on Spain - Year-over-year growth 2025-2030 (%)
Data Table on Spain - Year-over-year growth 2025-2030 (%)

12.4.6 The Netherlands - Market size and forecast 2025-2030

Chart on The Netherlands - Market size and forecast 2025-2030 ($ million)
Data Table on The Netherlands - Market size and forecast 2025-2030 ($ million)
Chart on The Netherlands - Year-over-year growth 2025-2030 (%)
Data Table on The Netherlands - Year-over-year growth 2025-2030 (%)

12.5 APAC - Market size and forecast 2025-2030

Chart on APAC - Market size and forecast 2025-2030 ($ million)
Data Table on APAC - Market size and forecast 2025-2030 ($ million)
Chart on APAC - Year-over-year growth 2025-2030 (%)
Data Table on APAC - Year-over-year growth 2025-2030 (%)
Chart on Regional Comparison - APAC
Data Table on Regional Comparison - APAC

12.5.1 China - Market size and forecast 2025-2030

Chart on China - Market size and forecast 2025-2030 ($ million)
Data Table on China - Market size and forecast 2025-2030 ($ million)
Chart on China - Year-over-year growth 2025-2030 (%)
Data Table on China - Year-over-year growth 2025-2030 (%)

12.5.2 Japan - Market size and forecast 2025-2030

Chart on Japan - Market size and forecast 2025-2030 ($ million)
Data Table on Japan - Market size and forecast 2025-2030 ($ million)
Chart on Japan - Year-over-year growth 2025-2030 (%)
Data Table on Japan - Year-over-year growth 2025-2030 (%)

12.5.3 India - Market size and forecast 2025-2030

Chart on India - Market size and forecast 2025-2030 ($ million)
Data Table on India - Market size and forecast 2025-2030 ($ million)
Chart on India - Year-over-year growth 2025-2030 (%)
Data Table on India - Year-over-year growth 2025-2030 (%)

12.5.4 South Korea - Market size and forecast 2025-2030

Chart on South Korea - Market size and forecast 2025-2030 ($ million)
Data Table on South Korea - Market size and forecast 2025-2030 ($ million)
Chart on South Korea - Year-over-year growth 2025-2030 (%)
Data Table on South Korea - Year-over-year growth 2025-2030 (%)

12.5.5 Australia - Market size and forecast 2025-2030

Chart on Australia - Market size and forecast 2025-2030 ($ million)
Data Table on Australia - Market size and forecast 2025-2030 ($ million)
Chart on Australia - Year-over-year growth 2025-2030 (%)
Data Table on Australia - Year-over-year growth 2025-2030 (%)

12.5.6 Indonesia - Market size and forecast 2025-2030

Chart on Indonesia - Market size and forecast 2025-2030 ($ million)
Data Table on Indonesia - Market size and forecast 2025-2030 ($ million)
Chart on Indonesia - Year-over-year growth 2025-2030 (%)
Data Table on Indonesia - Year-over-year growth 2025-2030 (%)

12.6 South America - Market size and forecast 2025-2030

Chart on South America - Market size and forecast 2025-2030 ($ million)
Data Table on South America - Market size and forecast 2025-2030 ($ million)
Chart on South America - Year-over-year growth 2025-2030 (%)
Data Table on South America - Year-over-year growth 2025-2030 (%)
Chart on Regional Comparison - South America
Data Table on Regional Comparison - South America

12.6.1 Brazil - Market size and forecast 2025-2030

Chart on Brazil - Market size and forecast 2025-2030 ($ million)
Data Table on Brazil - Market size and forecast 2025-2030 ($ million)
Chart on Brazil - Year-over-year growth 2025-2030 (%)
Data Table on Brazil - Year-over-year growth 2025-2030 (%)

12.6.2 Argentina - Market size and forecast 2025-2030

Chart on Argentina - Market size and forecast 2025-2030 ($ million)
Data Table on Argentina - Market size and forecast 2025-2030 ($ million)
Chart on Argentina - Year-over-year growth 2025-2030 (%)
Data Table on Argentina - Year-over-year growth 2025-2030 (%)

12.6.3 Chile - Market size and forecast 2025-2030

Chart on Chile - Market size and forecast 2025-2030 ($ million)
Data Table on Chile - Market size and forecast 2025-2030 ($ million)
Chart on Chile - Year-over-year growth 2025-2030 (%)
Data Table on Chile - Year-over-year growth 2025-2030 (%)

12.7 Middle East and Africa - Market size and forecast 2025-2030

Chart on Middle East and Africa - Market size and forecast 2025-2030 ($ million)
Data Table on Middle East and Africa - Market size and forecast 2025-2030 ($ million)
Chart on Middle East and Africa - Year-over-year growth 2025-2030 (%)
Data Table on Middle East and Africa - Year-over-year growth 2025-2030 (%)
Chart on Regional Comparison - Middle East and Africa
Data Table on Regional Comparison - Middle East and Africa

12.7.1 Saudi Arabia - Market size and forecast 2025-2030

Chart on Saudi Arabia - Market size and forecast 2025-2030 ($ million)
Data Table on Saudi Arabia - Market size and forecast 2025-2030 ($ million)
Chart on Saudi Arabia - Year-over-year growth 2025-2030 (%)
Data Table on Saudi Arabia - Year-over-year growth 2025-2030 (%)

12.7.2 UAE - Market size and forecast 2025-2030

Chart on UAE - Market size and forecast 2025-2030 ($ million)
Data Table on UAE - Market size and forecast 2025-2030 ($ million)
Chart on UAE - Year-over-year growth 2025-2030 (%)
Data Table on UAE - Year-over-year growth 2025-2030 (%)

12.7.3 South Africa - Market size and forecast 2025-2030

Chart on South Africa - Market size and forecast 2025-2030 ($ million)
Data Table on South Africa - Market size and forecast 2025-2030 ($ million)
Chart on South Africa - Year-over-year growth 2025-2030 (%)
Data Table on South Africa - Year-over-year growth 2025-2030 (%)

12.7.4 Israel - Market size and forecast 2025-2030

Chart on Israel - Market size and forecast 2025-2030 ($ million)
Data Table on Israel - Market size and forecast 2025-2030 ($ million)
Chart on Israel - Year-over-year growth 2025-2030 (%)
Data Table on Israel - Year-over-year growth 2025-2030 (%)

12.7.5 Turkey - Market size and forecast 2025-2030

Chart on Turkey - Market size and forecast 2025-2030 ($ million)
Data Table on Turkey - Market size and forecast 2025-2030 ($ million)
Chart on Turkey - Year-over-year growth 2025-2030 (%)
Data Table on Turkey - Year-over-year growth 2025-2030 (%)

12.8 Market opportunity by geography

Market opportunity by geography ($ million)
Data Tables on Market opportunity by geography ($ million)

13. Drivers, Challenges, and Opportunity

13.1 Market drivers

Increasing cross-border trade complexity
Expanding adoption of digital trade management platforms
Rising focus on corporate governance and trade compliance accountability

13.2 Market challenges

Regulatory fragmentation across jurisdictions
Limited availability of specialized customs compliance expertise
Data quality and system integration limitations

13.3 Impact of drivers and challenges

Impact of drivers and challenges in 2025 and 2030

13.4 Market opportunities

Rapid growth of cross-border e-commerce
Tariff volatility and changing trade measures
Expansion of AI-enabled customs compliance

14. Competitive Landscape

14.1 Overview

14.2

Overview on criticality of inputs and factors of differentiation

14.3 Landscape disruption

Overview on factors of disruption

14.4 Industry risks

Impact of key risks on business

15. Competitive Analysis

15.1 Companies profiled

Companies covered

15.2 Company ranking index

15.3 Market positioning of companies

Matrix on companies position and classification

15.4 AEB SE

AEB SE - Overview
AEB SE - Product / Service
AEB SE - Key offerings
SWOT

15.5 AP Moller Maersk AS

AP Moller Maersk AS - Overview
AP Moller Maersk AS - Business segments
AP Moller Maersk AS - Key news
AP Moller Maersk AS - Key offerings
AP Moller Maersk AS - Segment focus
SWOT

15.6 BDO International Ltd.

BDO International Ltd. - Overview
BDO International Ltd. - Product / Service
BDO International Ltd. - Key offerings
SWOT

15.7 Deloitte Touche Tohmatsu Ltd.

Deloitte Touche Tohmatsu Ltd. - Overview
Deloitte Touche Tohmatsu Ltd. - Business segments
Deloitte Touche Tohmatsu Ltd. - Key offerings
Deloitte Touche Tohmatsu Ltd. - Segment focus
SWOT

15.8 DHL International GmbH

DHL International GmbH - Overview
DHL International GmbH - Business segments
DHL International GmbH - Key news
DHL International GmbH - Key offerings
DHL International GmbH - Segment focus
SWOT

15.9 Ernst and Young Global Ltd.

Ernst and Young Global Ltd. - Overview
Ernst and Young Global Ltd. - Product / Service
Ernst and Young Global Ltd. - Key offerings
SWOT

15.10 FedEx Corp.

FedEx Corp. - Overview
FedEx Corp. - Business segments
FedEx Corp. - Key news
FedEx Corp. - Key offerings
FedEx Corp. - Segment focus
SWOT

15.11 Grant Thornton International

Grant Thornton International - Overview
Grant Thornton International - Product / Service
Grant Thornton International - Key offerings
SWOT

15.12 KPMG International Ltd.

KPMG International Ltd. - Overview
KPMG International Ltd. - Product / Service
KPMG International Ltd. - Key offerings
SWOT

15.13 Kuehne Nagel Management AG

Kuehne Nagel Management AG - Overview
Kuehne Nagel Management AG - Business segments
Kuehne Nagel Management AG - Key news
Kuehne Nagel Management AG - Key offerings
Kuehne Nagel Management AG - Segment focus
SWOT

15.14 PricewaterhouseCoopers LLP

PricewaterhouseCoopers LLP - Overview
PricewaterhouseCoopers LLP - Product / Service
PricewaterhouseCoopers LLP - Key offerings
SWOT

15.15 PSA BDP

PSA BDP - Overview
PSA BDP - Product / Service
PSA BDP - Key offerings
SWOT

15.16 SAP SE

SAP SE - Overview
SAP SE - Business segments
SAP SE - Key news
SAP SE - Key offerings
SAP SE - Segment focus
SWOT

15.17 Thomson Reuters Corp.

Thomson Reuters Corp. - Overview
Thomson Reuters Corp. - Business segments
Thomson Reuters Corp. - Key offerings
Thomson Reuters Corp. - Segment focus
SWOT

15.18 United Parcel Service Inc.

United Parcel Service Inc. - Overview
United Parcel Service Inc. - Business segments
United Parcel Service Inc. - Key offerings
United Parcel Service Inc. - Segment focus
SWOT

16. Appendix

16.1 Scope of the report

Market definition
Objectives
Notes and caveats

16.2 Inclusions and exclusions checklist

Inclusions checklist
Exclusions checklist

16.3 Currency conversion rates for US$

16.4 Research methodology

16.5 Data procurement

Information sources

16.6 Data validation

16.7 Validation techniques employed for market sizing

16.8 Data synthesis

16.9 360 degree market analysis

16.10 List of abbreviations

Research Methodology

Technavio presents a detailed picture of the market by way of study, synthesis, and summation of data from multiple sources. The analysts have presented the various facets of the market with a particular focus on identifying the key industry influencers. The data thus presented is comprehensive, reliable, and the result of extensive research, both primary and secondary.

INFORMATION SOURCES

Primary sources

  • Manufacturers and suppliers
  • Channel partners
  • Industry experts
  • Strategic decision makers

Secondary sources

  • Industry journals and periodicals
  • Government data
  • Financial reports of key industry players
  • Historical data
  • Press releases

DATA ANALYSIS

Data Synthesis

  • Collation of data
  • Estimation of key figures
  • Analysis of derived insights

Data Validation

  • Triangulation with data models
  • Reference against proprietary databases
  • Corroboration with industry experts

REPORT WRITING

Qualitative

  • Market drivers
  • Market challenges
  • Market trends
  • Five forces analysis

Quantitative

  • Market size and forecast
  • Market segmentation
  • Geographical insights
  • Competitive landscape

Interested in this report?

Get your sample now to see our research methodology and insights!

Download Now

Frequently Asked Questions

Customs Audit market growth will increase by USD 2766.9 million during 2026-2030.

The Customs Audit market is expected to grow at a CAGR of 3.8% during 2026-2030.

Customs Audit market is segmented by Service (Customs audit services, Customs advisory services) Type (Financial audit, Operational audit, Compliance audit, Risk management audit, Others) End-user (Large enterprises, SMEs)

AEB SE, AP Moller Maersk AS, BDO International Ltd., Crane Worldwide Logistics, Deloitte Touche Tohmatsu Ltd., Descartes Systems Group Inc., DHL International GmbH, E2open Parent Holdings Inc., Ernst and Young Global Ltd., FedEx Corp., Forvis Mazars Group, Grant Thornton International, KPMG International Ltd., Kuehne Nagel Management AG, Livingston International Inc., MIC Datenverarbeitung GmbH, PricewaterhouseCoopers LLP, PSA BDP, SAP SE, Thomson Reuters Corp., United Parcel Service Inc. are a few of the key vendors in the Customs Audit market.

APAC will register the highest growth rate of 37% among the other regions. Therefore, the Customs Audit market in APAC is expected to garner significant business opportunities for the vendors during the forecast period.

US, Canada, Mexico, Germany, UK, France, Italy, Spain, The Netherlands, China, Japan, India, South Korea, Australia, Indonesia, Brazil, Argentina, Chile, Saudi Arabia, UAE, South Africa, Israel, Turkey

  • Increasing cross-border trade complexity is the driving factor this market.

The Customs Audit market vendors should focus on grabbing business opportunities from the Service segment as it accounted for the largest market share in the base year.
RIA - Research AI Assistant
Ask RIA
