Decision Intelligence Market Analysis, Size, and Forecast 2026-2030: North America (US, Canada, and Mexico), Europe (Germany, UK, and France), APAC (China, Japan, and India), South America (Brazil and Argentina), Middle East and Africa (Saudi Arabia, UAE, and South Africa), and Rest of World (ROW)

Decision Intelligence Market Analysis, Size, and Forecast 2026-2030:
North America (US, Canada, and Mexico), Europe (Germany, UK, and France), APAC (China, Japan, and India), South America (Brazil and Argentina), Middle East and Africa (Saudi Arabia, UAE, and South Africa), and Rest of World (ROW)

Published: Apr 2026 285 Pages SKU: IRTNTR80721

Market Overview at a Glance

$49.84 B
Market Opportunity
29.8%
CAGR 2025 - 2030
38.7%
North America Growth
$6.60 B
Platforms segment 2024

Decision Intelligence Market Size 2026-2030

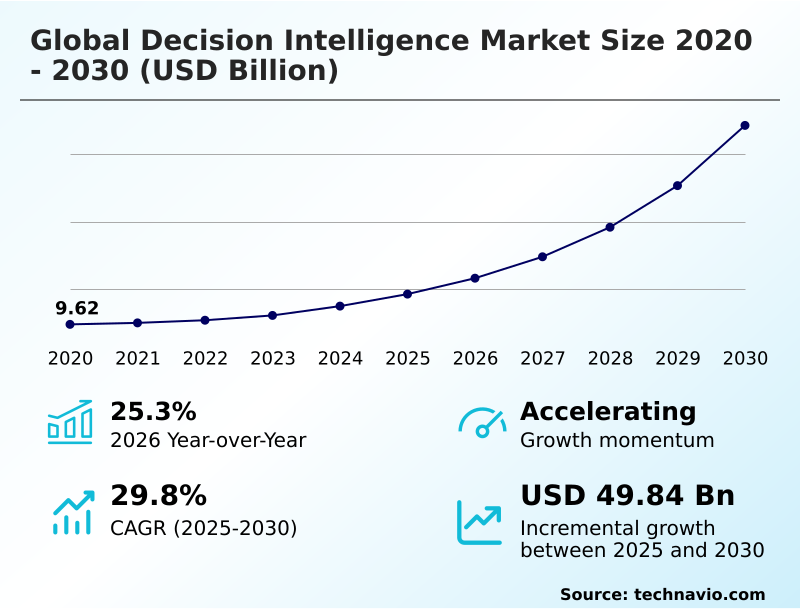
The decision intelligence market size is valued to increase by USD 49.84 billion, at a CAGR of 29.8% from 2025 to 2030. Proliferation of agentic AI and autonomous workflows will drive the decision intelligence market.

Major Market Trends & Insights

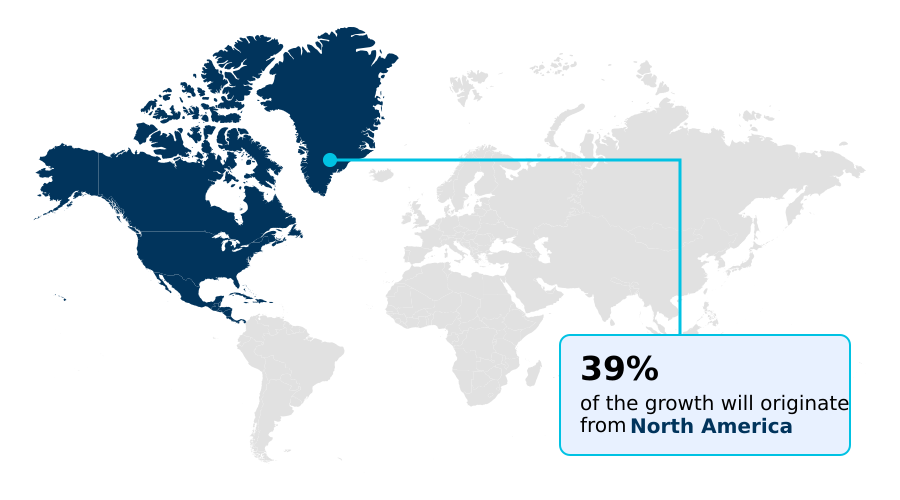
  • North America dominated the market and accounted for a 38.7% growth during the forecast period.
  • By Component - Platforms segment was valued at USD 6.60 billion in 2024
  • By Deployment - On-premises segment accounted for the largest market revenue share in 2024

Market Size & Forecast

  • Market Opportunities: USD 58.78 billion
  • Market Future Opportunities: USD 49.84 billion
  • CAGR from 2025 to 2030 : 29.8%

Market Summary

  • The Decision Intelligence Market is defined by the shift from passive data analysis to proactive, automated decision-making. This transition is powered by the convergence of generative intelligence and agentic AI systems, which together enable autonomous workflows capable of executing complex business processes with minimal human intervention.
  • Organizations are now implementing enterprise decision architecture that supports multi-agent orchestration, allowing specialized AI agents to collaborate on multifaceted tasks. To ensure accountability and trust, these architectures incorporate human-in-the-loop oversight and explainable AI interfaces. The adoption of cloud-native decisioning platforms, supported by high-performance computing, is crucial for processing vast datasets in real time.
  • For instance, in supply chain management, firms use decision modeling and notation to automate inventory adjustments based on real-time demand signals, optimizing stock levels and reducing waste. The market's trajectory is toward creating holistic, intelligent ecosystems that embed decision-making logic directly into operational processes, driving efficiency and strategic agility across the enterprise.

What will be the Size of the Decision Intelligence Market during the forecast period?

Get Key Insights on Market Forecast (PDF) Request Free Sample

How is the Decision Intelligence Market Segmented?

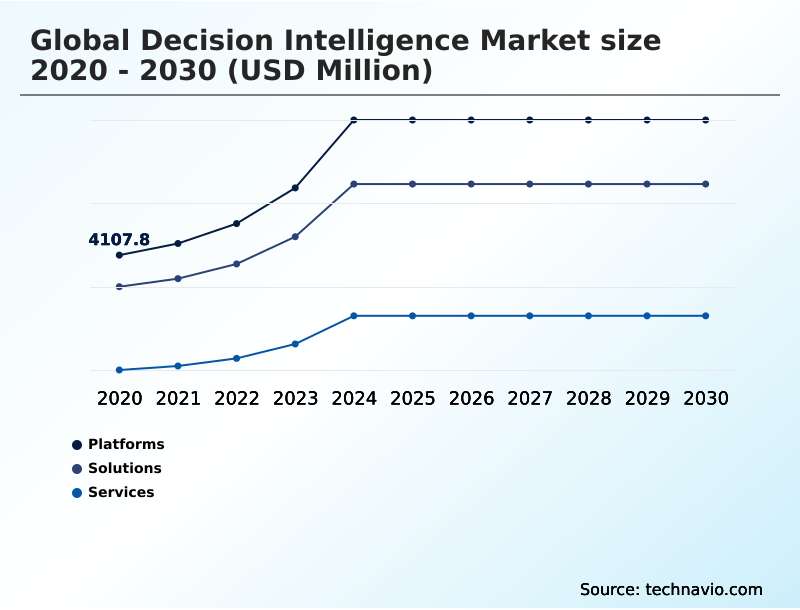
The decision intelligence industry research report provides comprehensive data (region-wise segment analysis), with forecasts and estimates in "USD million" for the period 2026-2030, as well as historical data from 2020-2024 for the following segments.

  • Component
    • Platforms
    • Solutions
    • Services
  • Deployment
    • On-premises
    • Cloud-based
  • End-user
    • Large enterprises
    • SMEs
  • Geography
    • North America
      • US
      • Canada
      • Mexico
    • Europe
      • Germany
      • UK
      • France
    • APAC
      • China
      • Japan
      • India
    • South America
      • Brazil
      • Argentina
    • Middle East and Africa
      • Saudi Arabia
      • UAE
      • South Africa
    • Rest of World (ROW)

By Component Insights

The platforms segment is estimated to witness significant growth during the forecast period.

Platforms represent the foundational architecture enabling a unified analytics environment for decision intelligence. These systems are shifting from descriptive tools to agentic AI systems that manage autonomous workflows and support sovereign artificial intelligence mandates.

Key functionalities include relational knowledge graph management and behavioral analytics engine integration for deeper insights. The emphasis is on business logic formalization to support end-to-end supply chain visibility and human expertise augmentation.

For example, some platforms deliver a nearly 40% reduction in decision-making errors in logistics. This evolution is supported by contextual intelligence platform capabilities and ethical AI advisory services, especially for applications like sustainable credit assessments.

Request Free Sample

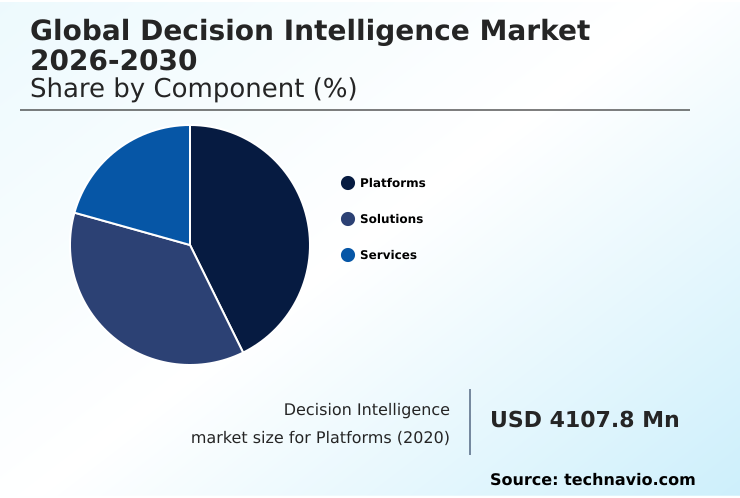
The Platforms segment was valued at USD 6.60 billion in 2024 and showed a gradual increase during the forecast period.

Request Free Sample

Regional Analysis

North America is estimated to contribute 38.7% to the growth of the global market during the forecast period.Technavio’s analysts have elaborately explained the regional trends and drivers that shape the market during the forecast period.

See How Decision Intelligence Market Demand is Rising in North America Request Free Sample

North America accounts for 38.7% of the incremental growth, leading innovation in cloud-native decisioning and prescriptive analytics. The region’s focus on regulated industry compliance fuels demand for solutions that ensure operational continuity management and data sovereignty compliance.

APAC is the fastest-growing region, driven by investments in digital twin technology and real-time decisioning for smart manufacturing. European firms prioritize prescriptive guidance systems that integrate sustainability metrics.

Across regions, the use of a graph analytics engine and mathematical optimization solvers for unstructured data processing and real-time data ingestion is standard. For instance, entity resolution analytics improves supply chain accuracy significantly.

Market Dynamics

Our researchers analyzed the data with 2025 as the base year, along with the key drivers, trends, and challenges. A holistic analysis of drivers will help companies refine their marketing strategies to gain a competitive advantage.

  • The market's strategic imperative is centered on integrating generative intelligence into enterprise architectures to transform operational capabilities. A key application involves automating supply chain decisions with agentic AI, where firms are achieving greater resilience and efficiency compared to manual methods. The critical need for regulatory adherence is addressed by implementing human-in-the-loop for financial compliance, which balances automation with necessary oversight.
  • In industrial settings, businesses are using digital twins for operational scenario modeling to pre-emptively test strategies and de-risk investments. The democratization of technology is evident in the adoption of low-code decision automation for business users, empowering non-technical staff to build and manage workflows.
  • In finance, there is a strong focus on deploying explainable AI in credit risk assessment models to ensure transparency and fairness. Logistics firms are pioneering multi-agent orchestration for logistics optimization, coordinating complex fleet movements in real-time. The need for structured oversight is met by establishing robust AI governance frameworks for regulated industries.
  • Security and compliance are further enhanced by using a relational knowledge graph for fraud detection. For complex planning, companies rely on mathematical optimization for production scheduling and real-time decisioning in high-frequency trading. Customer-centric strategies are powered by behavioral analytics for customer retention strategies, while cybersecurity benefits from context-driven intelligence for threat detection.
  • A significant hurdle remains migrating legacy decision systems to cloud infrastructure. Enterprises are also focused on ensuring data sovereignty in hybrid cloud analytics and building autonomous agents for business processes. Standardization is achieved by applying decision modeling and notation standards, while HR departments are transformed by AI-powered talent matching for unbiased hiring.
  • A core challenge is mitigating algorithmic bias in automated decisions, and many firms are using prescriptive analytics for inventory management to cut costs. Ultimately, the most successful implementations are those balancing automation with human expertise in healthcare and other critical sectors.

What are the key market drivers leading to the rise in the adoption of Decision Intelligence Industry?

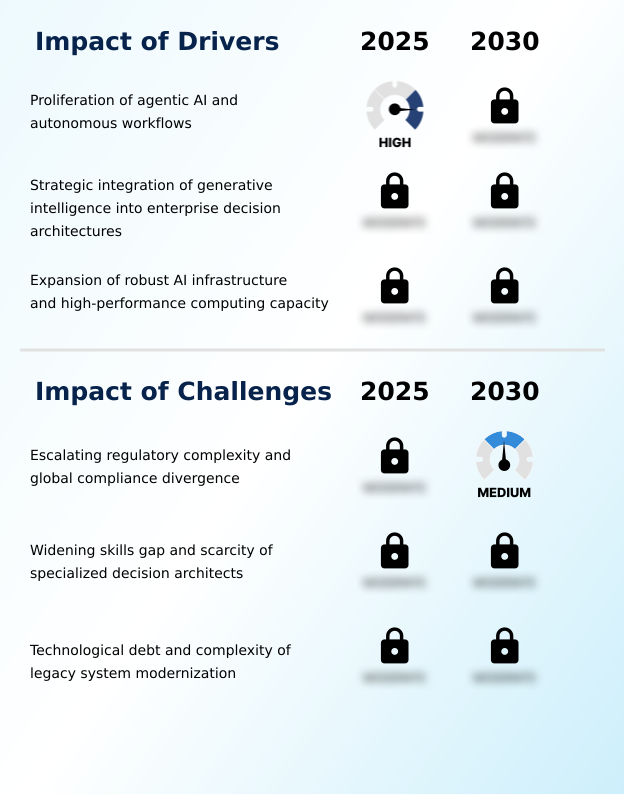
  • The proliferation of agentic AI and autonomous workflows is a primary driver, transforming business operations from manual oversight to automated, intelligent execution.

  • The maturation of generative intelligence is a primary driver, becoming a cornerstone of enterprise decision architecture. Organizations are pursuing digital transformation projects to achieve operational agility improvement by deploying enterprise-wide agentic systems.
  • The expansion of high-performance computing and AI-ready data centers enables decisioning at scale, with some firms achieving record-breaking quarterly revenues from these hardware investments. This infrastructure supports automated scenario modeling and automated decision execution.
  • Strategic decision validation is increasingly common, and a focus on inference throughput optimization promises to improve processing speeds. This trend is coupled with a drive for AI literacy enhancement at the executive level.

What are the market trends shaping the Decision Intelligence Industry?

  • The market is shifting from isolated AI tools toward sophisticated multi-agent orchestration frameworks. This evolution prioritizes collaborative intelligence, where specialized agents work in concert to resolve complex business challenges.

  • A defining trend is the move toward multi-agent orchestration, where governed decision modeling frameworks coordinate specialized agents. This is supported by explainable AI interfaces and human-in-the-loop oversight, ensuring that decisioning logic validation is maintained. Such systems, often leveraging no-code business rules and complex event processing, are becoming accessible through decisioning-as-a-service models.
  • The adoption of human-on-the-loop models has enhanced productivity by over 80% in some sectors. Furthermore, the application of agentic analytics in areas like AI-powered talent matching demonstrates the move toward creating resilient decision frameworks that feature explainability by design.

What challenges does the Decision Intelligence Industry face during its growth?

  • Escalating regulatory complexity and divergent global compliance mandates present a significant challenge, creating hurdles for the seamless deployment of unified decision intelligence platforms.

  • A key challenge is the complexity of legacy system modernization and the need for technological debt reduction, as over 60% of organizations still rely on older systems. Integrating low-code decision automation and hybrid cloud analytics is often hindered by poor data quality management.
  • The scarcity of specialized decision architect skillsets further complicates the adoption of a decision-centric approach that enables autonomous trade-off negotiations. Firms are investing in automated governance modules to ensure black-box algorithm transparency and facilitate algorithmic bias mitigation. Without reliable context-driven intelligence and predictive insights generation, many projects fail to move beyond pilot stages.

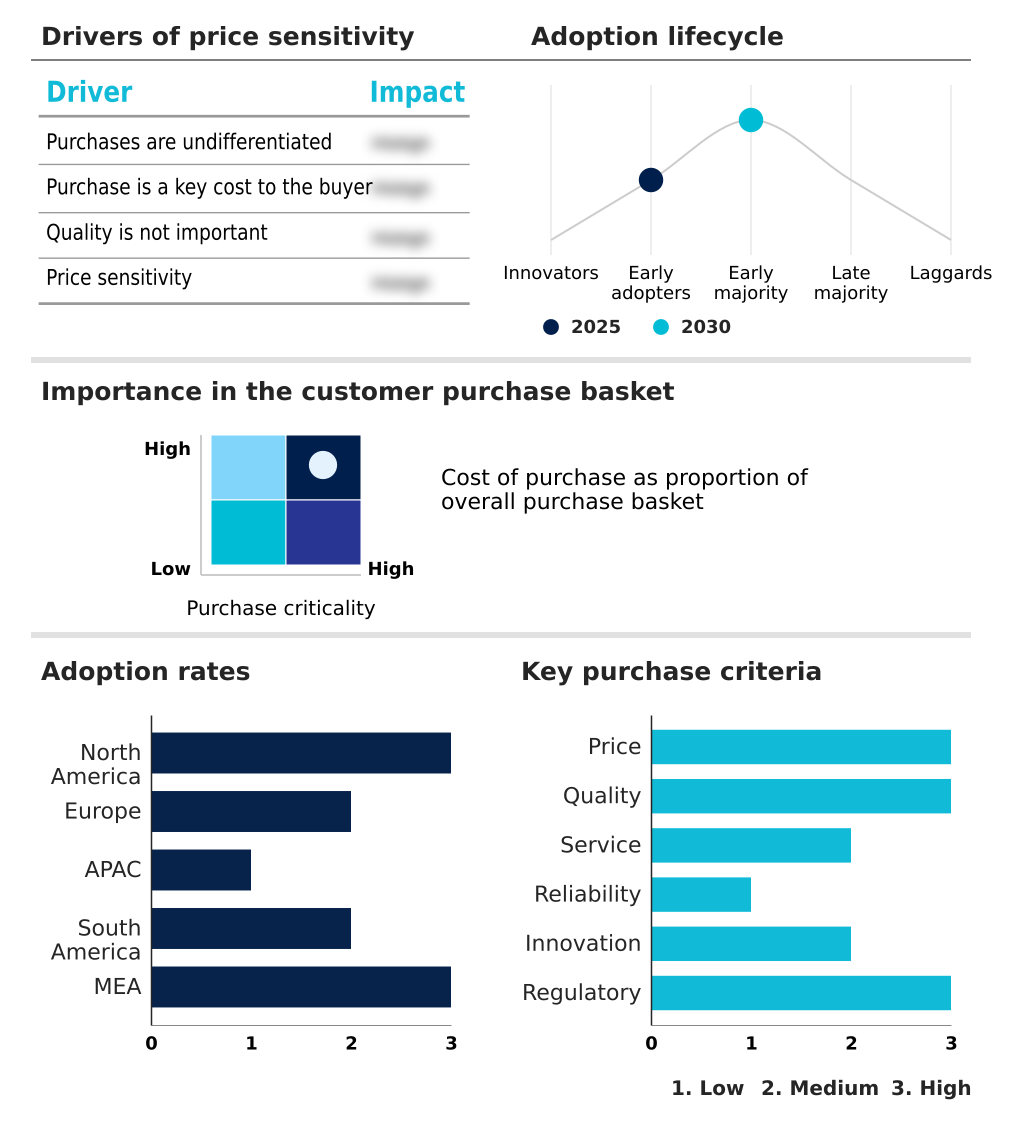
Exclusive Technavio Analysis on Customer Landscape

The decision intelligence market forecasting report includes the adoption lifecycle of the market, covering from the innovator’s stage to the laggard’s stage. It focuses on adoption rates in different regions based on penetration. Furthermore, the decision intelligence market report also includes key purchase criteria and drivers of price sensitivity to help companies evaluate and develop their market growth analysis strategies.

Customer Landscape of Decision Intelligence Industry

Competitive Landscape

Companies are implementing various strategies, such as strategic alliances, decision intelligence market forecast, partnerships, mergers and acquisitions, geographical expansion, and product/service launches, to enhance their presence in the industry.

Aera Technology - The Decision Cloud platform utilizes AI to automate and augment complex business decisions, focusing on optimizing supply chain and finance functions through unified data models and autonomous execution.

The industry research and growth report includes detailed analyses of the competitive landscape of the market and information about key companies, including:

  • Aera Technology
  • ClearBox Decisions Inc.
  • Cogility Software
  • Decisions LLC
  • Diwo
  • Fair Isaac Corp.
  • FlexRule
  • Gurobi Optimization
  • IBM Corp.
  • InRule Technology Inc.
  • Logility SCS Inc.
  • project44
  • Pyramid Analytics BV
  • Quantexa Ltd.
  • RelationalAI
  • Rulex Inc.
  • SAS Institute Inc.
  • Snowfire Corp.
  • Sparkling Logic
  • Trisotech.

Qualitative and quantitative analysis of companies has been conducted to help clients understand the wider business environment as well as the strengths and weaknesses of key industry players. Data is qualitatively analyzed to categorize companies as pure play, category-focused, industry-focused, and diversified; it is quantitatively analyzed to categorize companies as dominant, leading, strong, tentative, and weak.

Recent Development and News in Decision intelligence market

  • In April 2025, TATA Consultancy Services partnered with Vianai Systems to introduce the hila Platform, a solution enabling natural language interaction with enterprise data for business leaders.
  • In March 2025, the African Union formed the AI Advisory Group on Governance, Peace, and Security to address regulatory concerns across the continent.
  • In February 2025, Gurobi Optimization released a report highlighting the integration of mathematical optimization with machine learning to enhance decision-making frameworks.
  • In February 2025, enforcement of key provisions in the European Union's Artificial Intelligence Act began, prohibiting certain high-risk AI practices like social scoring.

Dive into Technavio’s robust research methodology, blending expert interviews, extensive data synthesis, and validated models for unparalleled Decision Intelligence Market insights. See full methodology.

Market Scope
Page number 285
Base year 2025
Historic period 2020-2024
Forecast period 2026-2030
Growth momentum & CAGR Accelerate at a CAGR of 29.8%
Market growth 2026-2030 USD 49839.6 million
Market structure Fragmented
YoY growth 2025-2026(%) 25.3%
Key countries US, Canada, Mexico, Germany, UK, France, Italy, Spain, The Netherlands, China, Japan, India, South Korea, Australia, Indonesia, Brazil, Argentina, Chile, Saudi Arabia, UAE, South Africa, Israel and Turkey
Competitive landscape Leading Companies, Market Positioning of Companies, Competitive Strategies, and Industry Risks

Request Free Sample

Research Analyst Overview

  • The market is evolving beyond conventional analytics toward the deployment of sophisticated agentic AI systems and autonomous workflows. This shift is underpinned by advancements in generative intelligence and high-performance computing, enabling a decision-centric approach within the modern enterprise decision architecture.
  • Organizations are leveraging cloud-native decisioning and hybrid cloud analytics platforms equipped with mathematical optimization solvers and graph analytics engine capabilities to manage complexity. At a strategic level, boards are increasingly concerned with establishing a robust AI governance framework to guide the use of multi-agent orchestration and ensure algorithmic bias mitigation.
  • Solutions now integrate end-to-end supply chain visibility through context-driven intelligence and entity resolution analytics. The adoption of digital twin technology for automated scenario modeling allows for risk-free strategy evaluation, with some firms reducing operational errors by over 30%. Core functionalities like low-code decision automation, behavioral analytics engine integration, and adherence to decision modeling and notation standards are becoming prerequisites.
  • The focus is on governed decision modeling with explainable AI interfaces and human-in-the-loop oversight to manage autonomous trade-off negotiations and facilitate predictive insights generation from contextual intelligence platforms. This is supported by AI-ready data centers designed for inference throughput optimization, alongside applications like AI-powered talent matching that use no-code business rules for automated decision execution.
  • The use of a relational knowledge graph is also becoming central to connecting disparate data points.

What are the Key Data Covered in this Decision Intelligence Market Research and Growth Report?

  • What is the expected growth of the Decision Intelligence Market between 2026 and 2030?

    • USD 49.84 billion, at a CAGR of 29.8%

  • What segmentation does the market report cover?

    • The report is segmented by Component (Platforms, Solutions, and Services), Deployment (On-premises, and Cloud-based), End-user (Large enterprises, and SMEs) and Geography (North America, Europe, APAC, South America, Middle East and Africa)

  • Which regions are analyzed in the report?

    • North America, Europe, APAC, South America and Middle East and Africa

  • What are the key growth drivers and market challenges?

    • Proliferation of agentic AI and autonomous workflows, Escalating regulatory complexity and global compliance divergence

  • Who are the major players in the Decision Intelligence Market?

    • Aera Technology, ClearBox Decisions Inc., Cogility Software, Decisions LLC, Diwo, Fair Isaac Corp., FlexRule, Gurobi Optimization, IBM Corp., InRule Technology Inc., Logility SCS Inc., project44, Pyramid Analytics BV, Quantexa Ltd., RelationalAI, Rulex Inc., SAS Institute Inc., Snowfire Corp., Sparkling Logic and Trisotech.

Market Research Insights

  • Market dynamics are shaped by the drive for operational agility improvement and the complexities of legacy system modernization. Enterprises are re-architecting decision flows, with over 80% deploying human-on-the-loop models for strategic decision validation, which improves productivity by nearly four times in AI-exposed industries. A focus on explainability by design and black-box algorithm transparency is paramount for regulated industry compliance.
  • The need for specialized decision architect skillsets remains a challenge, even as decisioning-as-a-service models and AI literacy enhancement programs emerge. Firms are leveraging a unified analytics environment to manage unstructured data processing and ensure data quality management, with a quarter of organizations reporting significant losses from poor data.
  • The rise of sovereign artificial intelligence and demand for data sovereignty compliance influence infrastructure choices, while ethical AI advisory services guide the implementation of resilient decision frameworks.

We can help! Our analysts can customize this decision intelligence market research report to meet your requirements.

Get in touch

1. Executive Summary

1.1 Market overview

Executive Summary - Chart on Market Overview
Executive Summary - Data Table on Market Overview
Executive Summary - Chart on Global Market Characteristics
Executive Summary - Chart on Market by Geography
Executive Summary - Chart on Market Segmentation by Component
Executive Summary - Chart on Market Segmentation by Deployment
Executive Summary - Chart on Market Segmentation by End-user
Executive Summary - Chart on Incremental Growth
Executive Summary - Data Table on Incremental Growth
Executive Summary - Chart on Company Market Positioning

2. Technavio Analysis

2.1 Analysis of price sensitivity, lifecycle, customer purchase basket, adoption rates, and purchase criteria

2.2 Criticality of inputs and Factors of differentiation

Chart on Overview on criticality of inputs and factors of differentiation

2.3 Factors of disruption

Chart on Overview on factors of disruption

2.4 Impact of drivers and challenges

Chart on Impact of drivers and challenges in 2025 and 2030

3. Market Landscape

3.1 Market ecosystem

Chart on Parent Market
Data Table on - Parent Market

3.2 Market characteristics

Chart on Market characteristics analysis

3.3 Value chain analysis

Chart on Value chain analysis

4. Market Sizing

4.1 Market definition

Data Table on Offerings of companies included in the market definition

4.2 Market segment analysis

Market segments

4.3 Market size 2025

4.4 Market outlook: Forecast for 2025-2030

Chart on Global - Market size and forecast 2025-2030 ($ million)
Data Table on Global - Market size and forecast 2025-2030 ($ million)
Chart on Global Market: Year-over-year growth 2025-2030 (%)
Data Table on Global Market: Year-over-year growth 2025-2030 (%)

5. Historic Market Size

5.1 Global Decision Intelligence Market 2020 - 2024

Historic Market Size - Data Table on Global Decision Intelligence Market 2020 - 2024 ($ million)

5.2 Component segment analysis 2020 - 2024

Historic Market Size - Component Segment 2020 - 2024 ($ million)

5.3 Deployment segment analysis 2020 - 2024

Historic Market Size - Deployment Segment 2020 - 2024 ($ million)

5.4 End-user segment analysis 2020 - 2024

Historic Market Size - End-user Segment 2020 - 2024 ($ million)

5.5 Geography segment analysis 2020 - 2024

Historic Market Size - Geography Segment 2020 - 2024 ($ million)

5.6 Country segment analysis 2020 - 2024

Historic Market Size - Country Segment 2020 - 2024 ($ million)

6. Qualitative Analysis

6.1 Impact of Geopolitical Conflict on Global Decision Intelligence Market

7. Five Forces Analysis

7.1 Five forces summary

Five forces analysis - Comparison between 2025 and 2030

7.2 Bargaining power of buyers

Bargaining power of buyers - Impact of key factors 2025 and 2030

7.3 Bargaining power of suppliers

Bargaining power of suppliers - Impact of key factors in 2025 and 2030

7.4 Threat of new entrants

Threat of new entrants - Impact of key factors in 2025 and 2030

7.5 Threat of substitutes

Threat of substitutes - Impact of key factors in 2025 and 2030

7.6 Threat of rivalry

Threat of rivalry - Impact of key factors in 2025 and 2030

7.7 Market condition

Chart on Market condition - Five forces 2025 and 2030

8. Market Segmentation by Component

8.1 Market segments

Chart on Component - Market share 2025-2030 (%)
Data Table on Component - Market share 2025-2030 (%)

8.2 Comparison by Component

Chart on Comparison by Component
Data Table on Comparison by Component

8.3 Platforms - Market size and forecast 2025-2030

Chart on Platforms - Market size and forecast 2025-2030 ($ million)
Data Table on Platforms - Market size and forecast 2025-2030 ($ million)
Chart on Platforms - Year-over-year growth 2025-2030 (%)
Data Table on Platforms - Year-over-year growth 2025-2030 (%)

8.4 Solutions - Market size and forecast 2025-2030

Chart on Solutions - Market size and forecast 2025-2030 ($ million)
Data Table on Solutions - Market size and forecast 2025-2030 ($ million)
Chart on Solutions - Year-over-year growth 2025-2030 (%)
Data Table on Solutions - Year-over-year growth 2025-2030 (%)

8.5 Services - Market size and forecast 2025-2030

Chart on Services - Market size and forecast 2025-2030 ($ million)
Data Table on Services - Market size and forecast 2025-2030 ($ million)
Chart on Services - Year-over-year growth 2025-2030 (%)
Data Table on Services - Year-over-year growth 2025-2030 (%)

8.6 Market opportunity by Component

Market opportunity by Component ($ million)
Data Table on Market opportunity by Component ($ million)

9. Market Segmentation by Deployment

9.1 Market segments

Chart on Deployment - Market share 2025-2030 (%)
Data Table on Deployment - Market share 2025-2030 (%)

9.2 Comparison by Deployment

Chart on Comparison by Deployment
Data Table on Comparison by Deployment

9.3 On-premises - Market size and forecast 2025-2030

Chart on On-premises - Market size and forecast 2025-2030 ($ million)
Data Table on On-premises - Market size and forecast 2025-2030 ($ million)
Chart on On-premises - Year-over-year growth 2025-2030 (%)
Data Table on On-premises - Year-over-year growth 2025-2030 (%)

9.4 Cloud-based - Market size and forecast 2025-2030

Chart on Cloud-based - Market size and forecast 2025-2030 ($ million)
Data Table on Cloud-based - Market size and forecast 2025-2030 ($ million)
Chart on Cloud-based - Year-over-year growth 2025-2030 (%)
Data Table on Cloud-based - Year-over-year growth 2025-2030 (%)

9.5 Market opportunity by Deployment

Market opportunity by Deployment ($ million)
Data Table on Market opportunity by Deployment ($ million)

10. Market Segmentation by End-user

10.1 Market segments

Chart on End-user - Market share 2025-2030 (%)
Data Table on End-user - Market share 2025-2030 (%)

10.2 Comparison by End-user

Chart on Comparison by End-user
Data Table on Comparison by End-user

10.3 Large enterprises - Market size and forecast 2025-2030

Chart on Large enterprises - Market size and forecast 2025-2030 ($ million)
Data Table on Large enterprises - Market size and forecast 2025-2030 ($ million)
Chart on Large enterprises - Year-over-year growth 2025-2030 (%)
Data Table on Large enterprises - Year-over-year growth 2025-2030 (%)

10.4 SMEs - Market size and forecast 2025-2030

Chart on SMEs - Market size and forecast 2025-2030 ($ million)
Data Table on SMEs - Market size and forecast 2025-2030 ($ million)
Chart on SMEs - Year-over-year growth 2025-2030 (%)
Data Table on SMEs - Year-over-year growth 2025-2030 (%)

10.5 Market opportunity by End-user

Market opportunity by End-user ($ million)
Data Table on Market opportunity by End-user ($ million)

11. Customer Landscape

11.1 Customer landscape overview

Analysis of price sensitivity, lifecycle, customer purchase basket, adoption rates, and purchase criteria

12. Geographic Landscape

12.1 Geographic segmentation

Chart on Market share by geography 2025-2030 (%)
Data Table on Market share by geography 2025-2030 (%)

12.2 Geographic comparison

Chart on Geographic comparison
Data Table on Geographic comparison

12.3 North America - Market size and forecast 2025-2030

Chart on North America - Market size and forecast 2025-2030 ($ million)
Data Table on North America - Market size and forecast 2025-2030 ($ million)
Chart on North America - Year-over-year growth 2025-2030 (%)
Data Table on North America - Year-over-year growth 2025-2030 (%)
Chart on Regional Comparison - North America
Data Table on Regional Comparison - North America

12.3.1 US - Market size and forecast 2025-2030

Chart on US - Market size and forecast 2025-2030 ($ million)
Data Table on US - Market size and forecast 2025-2030 ($ million)
Chart on US - Year-over-year growth 2025-2030 (%)
Data Table on US - Year-over-year growth 2025-2030 (%)

12.3.2 Canada - Market size and forecast 2025-2030

Chart on Canada - Market size and forecast 2025-2030 ($ million)
Data Table on Canada - Market size and forecast 2025-2030 ($ million)
Chart on Canada - Year-over-year growth 2025-2030 (%)
Data Table on Canada - Year-over-year growth 2025-2030 (%)

12.3.3 Mexico - Market size and forecast 2025-2030

Chart on Mexico - Market size and forecast 2025-2030 ($ million)
Data Table on Mexico - Market size and forecast 2025-2030 ($ million)
Chart on Mexico - Year-over-year growth 2025-2030 (%)
Data Table on Mexico - Year-over-year growth 2025-2030 (%)

12.4 Europe - Market size and forecast 2025-2030

Chart on Europe - Market size and forecast 2025-2030 ($ million)
Data Table on Europe - Market size and forecast 2025-2030 ($ million)
Chart on Europe - Year-over-year growth 2025-2030 (%)
Data Table on Europe - Year-over-year growth 2025-2030 (%)
Chart on Regional Comparison - Europe
Data Table on Regional Comparison - Europe

12.4.1 Germany - Market size and forecast 2025-2030

Chart on Germany - Market size and forecast 2025-2030 ($ million)
Data Table on Germany - Market size and forecast 2025-2030 ($ million)
Chart on Germany - Year-over-year growth 2025-2030 (%)
Data Table on Germany - Year-over-year growth 2025-2030 (%)

12.4.2 UK - Market size and forecast 2025-2030

Chart on UK - Market size and forecast 2025-2030 ($ million)
Data Table on UK - Market size and forecast 2025-2030 ($ million)
Chart on UK - Year-over-year growth 2025-2030 (%)
Data Table on UK - Year-over-year growth 2025-2030 (%)

12.4.3 France - Market size and forecast 2025-2030

Chart on France - Market size and forecast 2025-2030 ($ million)
Data Table on France - Market size and forecast 2025-2030 ($ million)
Chart on France - Year-over-year growth 2025-2030 (%)
Data Table on France - Year-over-year growth 2025-2030 (%)

12.4.4 Italy - Market size and forecast 2025-2030

Chart on Italy - Market size and forecast 2025-2030 ($ million)
Data Table on Italy - Market size and forecast 2025-2030 ($ million)
Chart on Italy - Year-over-year growth 2025-2030 (%)
Data Table on Italy - Year-over-year growth 2025-2030 (%)

12.4.5 Spain - Market size and forecast 2025-2030

Chart on Spain - Market size and forecast 2025-2030 ($ million)
Data Table on Spain - Market size and forecast 2025-2030 ($ million)
Chart on Spain - Year-over-year growth 2025-2030 (%)
Data Table on Spain - Year-over-year growth 2025-2030 (%)

12.4.6 The Netherlands - Market size and forecast 2025-2030

Chart on The Netherlands - Market size and forecast 2025-2030 ($ million)
Data Table on The Netherlands - Market size and forecast 2025-2030 ($ million)
Chart on The Netherlands - Year-over-year growth 2025-2030 (%)
Data Table on The Netherlands - Year-over-year growth 2025-2030 (%)

12.5 APAC - Market size and forecast 2025-2030

Chart on APAC - Market size and forecast 2025-2030 ($ million)
Data Table on APAC - Market size and forecast 2025-2030 ($ million)
Chart on APAC - Year-over-year growth 2025-2030 (%)
Data Table on APAC - Year-over-year growth 2025-2030 (%)
Chart on Regional Comparison - APAC
Data Table on Regional Comparison - APAC

12.5.1 China - Market size and forecast 2025-2030

Chart on China - Market size and forecast 2025-2030 ($ million)
Data Table on China - Market size and forecast 2025-2030 ($ million)
Chart on China - Year-over-year growth 2025-2030 (%)
Data Table on China - Year-over-year growth 2025-2030 (%)

12.5.2 Japan - Market size and forecast 2025-2030

Chart on Japan - Market size and forecast 2025-2030 ($ million)
Data Table on Japan - Market size and forecast 2025-2030 ($ million)
Chart on Japan - Year-over-year growth 2025-2030 (%)
Data Table on Japan - Year-over-year growth 2025-2030 (%)

12.5.3 India - Market size and forecast 2025-2030

Chart on India - Market size and forecast 2025-2030 ($ million)
Data Table on India - Market size and forecast 2025-2030 ($ million)
Chart on India - Year-over-year growth 2025-2030 (%)
Data Table on India - Year-over-year growth 2025-2030 (%)

12.5.4 South Korea - Market size and forecast 2025-2030

Chart on South Korea - Market size and forecast 2025-2030 ($ million)
Data Table on South Korea - Market size and forecast 2025-2030 ($ million)
Chart on South Korea - Year-over-year growth 2025-2030 (%)
Data Table on South Korea - Year-over-year growth 2025-2030 (%)

12.5.5 Australia - Market size and forecast 2025-2030

Chart on Australia - Market size and forecast 2025-2030 ($ million)
Data Table on Australia - Market size and forecast 2025-2030 ($ million)
Chart on Australia - Year-over-year growth 2025-2030 (%)
Data Table on Australia - Year-over-year growth 2025-2030 (%)

12.5.6 Indonesia - Market size and forecast 2025-2030

Chart on Indonesia - Market size and forecast 2025-2030 ($ million)
Data Table on Indonesia - Market size and forecast 2025-2030 ($ million)
Chart on Indonesia - Year-over-year growth 2025-2030 (%)
Data Table on Indonesia - Year-over-year growth 2025-2030 (%)

12.6 South America - Market size and forecast 2025-2030

Chart on South America - Market size and forecast 2025-2030 ($ million)
Data Table on South America - Market size and forecast 2025-2030 ($ million)
Chart on South America - Year-over-year growth 2025-2030 (%)
Data Table on South America - Year-over-year growth 2025-2030 (%)
Chart on Regional Comparison - South America
Data Table on Regional Comparison - South America

12.6.1 Brazil - Market size and forecast 2025-2030

Chart on Brazil - Market size and forecast 2025-2030 ($ million)
Data Table on Brazil - Market size and forecast 2025-2030 ($ million)
Chart on Brazil - Year-over-year growth 2025-2030 (%)
Data Table on Brazil - Year-over-year growth 2025-2030 (%)

12.6.2 Argentina - Market size and forecast 2025-2030

Chart on Argentina - Market size and forecast 2025-2030 ($ million)
Data Table on Argentina - Market size and forecast 2025-2030 ($ million)
Chart on Argentina - Year-over-year growth 2025-2030 (%)
Data Table on Argentina - Year-over-year growth 2025-2030 (%)

12.6.3 Chile - Market size and forecast 2025-2030

Chart on Chile - Market size and forecast 2025-2030 ($ million)
Data Table on Chile - Market size and forecast 2025-2030 ($ million)
Chart on Chile - Year-over-year growth 2025-2030 (%)
Data Table on Chile - Year-over-year growth 2025-2030 (%)

12.7 Middle East and Africa - Market size and forecast 2025-2030

Chart on Middle East and Africa - Market size and forecast 2025-2030 ($ million)
Data Table on Middle East and Africa - Market size and forecast 2025-2030 ($ million)
Chart on Middle East and Africa - Year-over-year growth 2025-2030 (%)
Data Table on Middle East and Africa - Year-over-year growth 2025-2030 (%)
Chart on Regional Comparison - Middle East and Africa
Data Table on Regional Comparison - Middle East and Africa

12.7.1 Saudi Arabia - Market size and forecast 2025-2030

Chart on Saudi Arabia - Market size and forecast 2025-2030 ($ million)
Data Table on Saudi Arabia - Market size and forecast 2025-2030 ($ million)
Chart on Saudi Arabia - Year-over-year growth 2025-2030 (%)
Data Table on Saudi Arabia - Year-over-year growth 2025-2030 (%)

12.7.2 UAE - Market size and forecast 2025-2030

Chart on UAE - Market size and forecast 2025-2030 ($ million)
Data Table on UAE - Market size and forecast 2025-2030 ($ million)
Chart on UAE - Year-over-year growth 2025-2030 (%)
Data Table on UAE - Year-over-year growth 2025-2030 (%)

12.7.3 South Africa - Market size and forecast 2025-2030

Chart on South Africa - Market size and forecast 2025-2030 ($ million)
Data Table on South Africa - Market size and forecast 2025-2030 ($ million)
Chart on South Africa - Year-over-year growth 2025-2030 (%)
Data Table on South Africa - Year-over-year growth 2025-2030 (%)

12.7.4 Israel - Market size and forecast 2025-2030

Chart on Israel - Market size and forecast 2025-2030 ($ million)
Data Table on Israel - Market size and forecast 2025-2030 ($ million)
Chart on Israel - Year-over-year growth 2025-2030 (%)
Data Table on Israel - Year-over-year growth 2025-2030 (%)

12.7.5 Turkey - Market size and forecast 2025-2030

Chart on Turkey - Market size and forecast 2025-2030 ($ million)
Data Table on Turkey - Market size and forecast 2025-2030 ($ million)
Chart on Turkey - Year-over-year growth 2025-2030 (%)
Data Table on Turkey - Year-over-year growth 2025-2030 (%)

12.8 Market opportunity by geography

Market opportunity by geography ($ million)
Data Tables on Market opportunity by geography ($ million)

13. Drivers, Challenges, and Opportunity

13.1 Market drivers

Proliferation of agentic AI and autonomous workflows
Strategic integration of generative intelligence into enterprise decision architectures
Expansion of robust AI infrastructure and high-performance computing capacity

13.2 Market challenges

Escalating regulatory complexity and global compliance divergence
Widening skills gap and scarcity of specialized decision architects
Technological debt and complexity of legacy system modernization

13.3 Impact of drivers and challenges

Impact of drivers and challenges in 2025 and 2030

13.4 Market opportunities

Shift toward multi-agent orchestration and collaborative intelligence
Formalization of AI governance and regulatory frameworks globally
Integration of HITL and explainable AI interfaces

14. Competitive Landscape

14.1 Overview

14.2

Overview on criticality of inputs and factors of differentiation

14.3 Landscape disruption

Overview on factors of disruption

14.4 Industry risks

Impact of key risks on business

15. Competitive Analysis

15.1 Companies profiled

Companies covered

15.2 Company ranking index

15.3 Market positioning of companies

Matrix on companies position and classification

15.4 Aera Technology

Aera Technology - Overview
Aera Technology - Product / Service
Aera Technology - Key offerings
SWOT

15.5 Cogility Software

Cogility Software - Overview
Cogility Software - Product / Service
Cogility Software - Key offerings
SWOT

15.6 Decisions LLC

Decisions LLC - Overview
Decisions LLC - Product / Service
Decisions LLC - Key offerings
SWOT

15.7 Fair Isaac Corp.

Fair Isaac Corp. - Overview
Fair Isaac Corp. - Business segments
Fair Isaac Corp. - Key news
Fair Isaac Corp. - Key offerings
Fair Isaac Corp. - Segment focus
SWOT

15.8 Gurobi Optimization

Gurobi Optimization - Overview
Gurobi Optimization - Product / Service
Gurobi Optimization - Key offerings
SWOT

15.9 IBM Corp.

IBM Corp. - Overview
IBM Corp. - Business segments
IBM Corp. - Key news
IBM Corp. - Key offerings
IBM Corp. - Segment focus
SWOT

15.10 Logility SCS Inc.

Logility SCS Inc. - Overview
Logility SCS Inc. - Product / Service
Logility SCS Inc. - Key offerings
SWOT

15.11 project44

project44 - Overview
project44 - Product / Service
project44 - Key offerings
SWOT

15.12 Pyramid Analytics BV

Pyramid Analytics BV - Overview
Pyramid Analytics BV - Product / Service
Pyramid Analytics BV - Key offerings
SWOT

15.13 Quantexa Ltd.

Quantexa Ltd. - Overview
Quantexa Ltd. - Product / Service
Quantexa Ltd. - Key offerings
SWOT

15.14 RelationalAI

RelationalAI - Overview
RelationalAI - Product / Service
RelationalAI - Key offerings
SWOT

15.15 Rulex Inc.

Rulex Inc. - Overview
Rulex Inc. - Product / Service
Rulex Inc. - Key offerings
SWOT

15.16 SAS Institute Inc.

SAS Institute Inc. - Overview
SAS Institute Inc. - Product / Service
SAS Institute Inc. - Key offerings
SWOT

15.17 Sparkling Logic

Sparkling Logic - Overview
Sparkling Logic - Product / Service
Sparkling Logic - Key offerings
SWOT

15.18 Trisotech.

Trisotech. - Overview
Trisotech. - Product / Service
Trisotech. - Key offerings
SWOT

16. Appendix

16.1 Scope of the report

Market definition
Objectives
Notes and caveats

16.2 Inclusions and exclusions checklist

Inclusions checklist
Exclusions checklist

16.3 Currency conversion rates for US$

16.4 Research methodology

16.5 Data procurement

Information sources

16.6 Data validation

16.7 Validation techniques employed for market sizing

16.8 Data synthesis

16.9 360 degree market analysis

16.10 List of abbreviations

Research Methodology

Technavio presents a detailed picture of the market by way of study, synthesis, and summation of data from multiple sources. The analysts have presented the various facets of the market with a particular focus on identifying the key industry influencers. The data thus presented is comprehensive, reliable, and the result of extensive research, both primary and secondary.

INFORMATION SOURCES

Primary sources

  • Manufacturers and suppliers
  • Channel partners
  • Industry experts
  • Strategic decision makers

Secondary sources

  • Industry journals and periodicals
  • Government data
  • Financial reports of key industry players
  • Historical data
  • Press releases

DATA ANALYSIS

Data Synthesis

  • Collation of data
  • Estimation of key figures
  • Analysis of derived insights

Data Validation

  • Triangulation with data models
  • Reference against proprietary databases
  • Corroboration with industry experts

REPORT WRITING

Qualitative

  • Market drivers
  • Market challenges
  • Market trends
  • Five forces analysis

Quantitative

  • Market size and forecast
  • Market segmentation
  • Geographical insights
  • Competitive landscape

Interested in this report?

Get your sample now to see our research methodology and insights!

Download Now

Frequently Asked Questions

Decision Intelligence market growth will increase by USD 49839.6 million during 2026-2030.

The Decision Intelligence market is expected to grow at a CAGR of 29.8% during 2026-2030.

Decision Intelligence market is segmented by Component (Platforms, Solutions, Services) Deployment (On-premises, Cloud-based) End-user (Large enterprises, SMEs)

Aera Technology, ClearBox Decisions Inc., Cogility Software, Decisions LLC, Diwo, Fair Isaac Corp., FlexRule, Gurobi Optimization, IBM Corp., InRule Technology Inc., Logility SCS Inc., project44, Pyramid Analytics BV, Quantexa Ltd., RelationalAI, Rulex Inc., SAS Institute Inc., Snowfire Corp., Sparkling Logic, Trisotech. are a few of the key vendors in the Decision Intelligence market.

North America will register the highest growth rate of 38.7% among the other regions. Therefore, the Decision Intelligence market in North America is expected to garner significant business opportunities for the vendors during the forecast period.

US, Canada, Mexico, Germany, UK, France, Italy, Spain, The Netherlands, China, Japan, India, South Korea, Australia, Indonesia, Brazil, Argentina, Chile, Saudi Arabia, UAE, South Africa, Israel, Turkey

  • Proliferation of agentic AI and autonomous workflows is the driving factor this market.

The Decision Intelligence market vendors should focus on grabbing business opportunities from the Component segment as it accounted for the largest market share in the base year.
RIA - Research AI Assistant
Ask RIA