
Defoamers Market Analysis, Size, and Forecast 2026-2030: APAC (China, India, and Japan), North America (US, Canada, and Mexico), Europe (Germany, UK, and France), Middle East and Africa (Saudi Arabia, UAE, and South Africa), South America (Brazil, Argentina, and Chile), and Rest of World (ROW)

Defoamers Market Analysis, Size, and Forecast 2026-2030:
APAC (China, India, and Japan), North America (US, Canada, and Mexico), Europe (Germany, UK, and France), Middle East and Africa (Saudi Arabia, UAE, and South Africa), South America (Brazil, Argentina, and Chile), and Rest of World (ROW)

Published: Nov 2026 319 Pages SKU: IRTNTR70460

Market Overview at a Glance

$2.30 B
Market Opportunity
4.7%
CAGR 2025 - 2030
31.1%
APAC Growth
$3.86 B
Water-based segment 2024

Defoamers Market Size 2026-2030

The defoamers market size is valued to increase by USD 2.30 billion, at a CAGR of 4.7% from 2025 to 2030. Rapid expansion of global municipal and industrial wastewater treatment will drive the defoamers market.

Major Market Trends & Insights

  • APAC dominated the market and accounted for a 31.1% growth during the forecast period.
  • By Type - Water-based segment was valued at USD 3.86 billion in 2024
  • By Application - Architectural segment accounted for the largest market revenue share in 2024

Market Size & Forecast

  • Market Opportunities: USD 3.95 billion
  • Market Future Opportunities: USD 2.30 billion
  • CAGR from 2025 to 2030 : 4.7%

Market Summary

  • The Defoamers Market demonstrates structural acceleration driven by the imperative to manage fluid dynamics across heavy industrial and chemical processing sectors. In high-volume manufacturing environments, such as pulp and paper bleaching, rapid foam generation impedes operational throughput and damages delicate machinery.
  • Addressing this bottleneck, facility operators deploy specialized polydimethylsiloxane fluids and polyether modified siloxanes to achieve a 25% improvement in pump efficiency and continuous processing speed. The rapid expansion of municipal wastewater infrastructure acts as a primary catalyst for this sector, compelling authorities to utilize bio based surfactants to prevent hazardous fluid overflow in aeration basins.
  • Conversely, strict environmental regulations restricting volatile organic compound emissions present a significant compliance challenge, forcing formulators to reformulate legacy mineral oil carrier fluids at elevated developmental costs. Advanced organo modified silicones now deliver superior interfacial tension reduction compared to traditional hydrocarbon alternatives.
  • Consequently, plant managers prioritize low volatile organic compounds to maintain uninterrupted operational uptime while meeting regional ecological discharge mandates.

What will be the Size of the Defoamers Market during the forecast period?
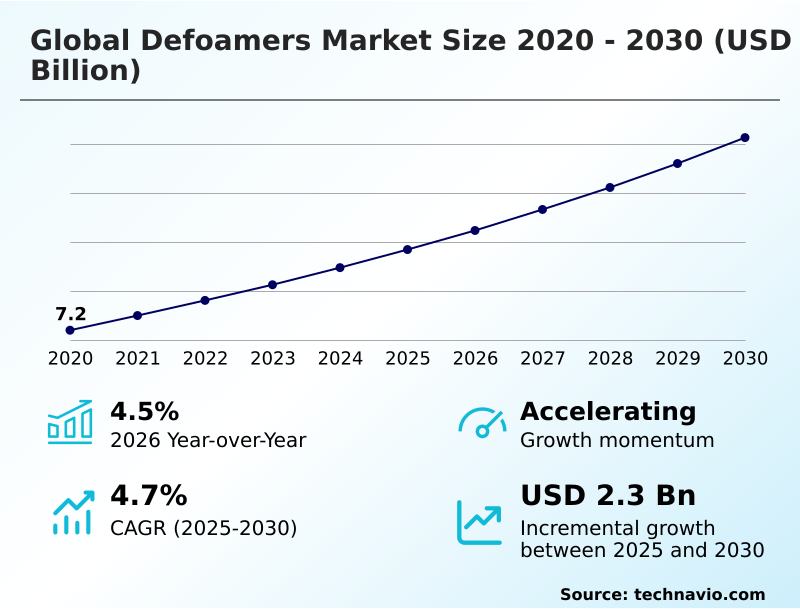
Get Key Insights on Market Forecast (PDF) Get Free Sample

How is the Defoamers Market Segmented?

The defoamers industry research report provides comprehensive data (region-wise segment analysis), with forecasts and estimates in "USD million" for the period 2026-2030, as well as historical data from 2020-2024 for the following segments.

  • Type
    • Water-based
    • Silicone-based
    • Mineral-oil based
    • Others
  • Application
    • Architectural
    • Industrial
    • Wood and furniture
    • Automotive
    • Others
  • Form factor
    • Liquid
    • Emulsion
    • Powder
  • Geography
    • APAC
      • China
      • India
      • Japan
      • South Korea
      • Indonesia
      • Australia
    • North America
      • US
      • Canada
      • Mexico
    • Europe
      • Germany
      • UK
      • France
      • Italy
      • Spain
      • The Netherlands
    • Middle East and Africa
      • Saudi Arabia
      • UAE
      • South Africa
      • Turkey
      • Israel
    • South America
      • Brazil
      • Argentina
      • Chile

By Type Insights

The water-based segment is estimated to witness significant growth during the forecast period.

Water-based defoamers represent a critical product category driven by stringent regulatory emission restrictions and the industrial shift toward sustainable processing architectures.

These formulations utilize an aqueous continuous phase to disperse active hydrophobic components, ensuring rapid bubble coalescence accelerators without introducing hazardous solvents.

End-users in architectural paints formulation and paper pulp bleaching heavily favor these agents for their non-flammable properties and excellent dispersibility.

Operational deployment of waterborne siloxane emulsions has allowed industrial facilities to reduce chemical residue cleanup times by 40% compared to legacy solvent systems. By optimizing high shear mixing stability, formulators deliver robust foam suppression that preserves fluid integrity.

This sub-segment continues to expand as enterprises mandate zero liquid discharge processing protocols and prioritize eco-friendly synthetic latex resins.
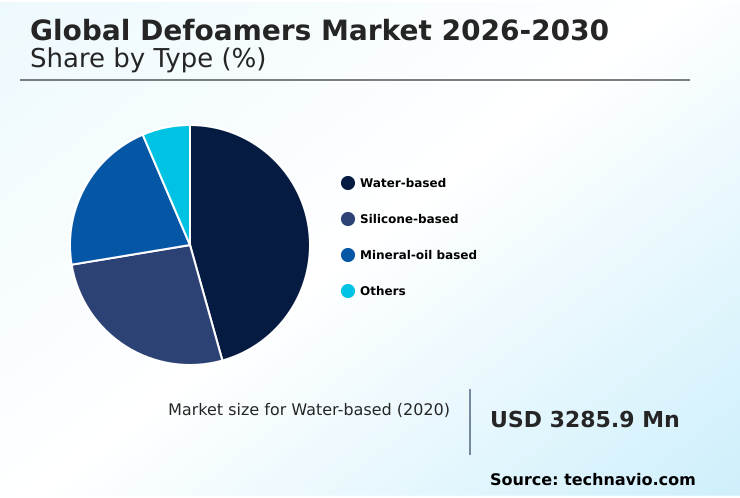
Get Free Sample

The Water-based segment was valued at USD 3.86 billion in 2024 and showed a gradual increase during the forecast period.
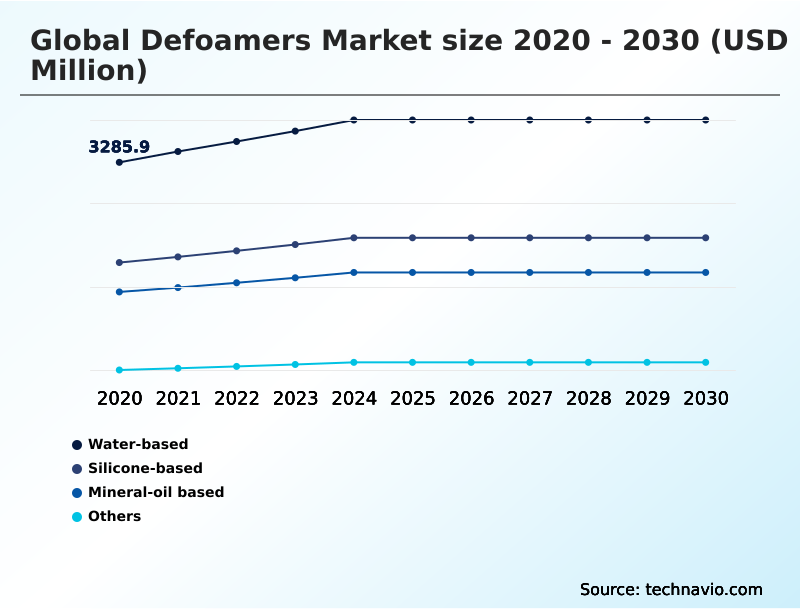
Get Free Sample

Regional Analysis

APAC is estimated to contribute 31.1% to the growth of the global market during the forecast period.Technavio’s analysts have elaborately explained the regional trends and drivers that shape the market during the forecast period.
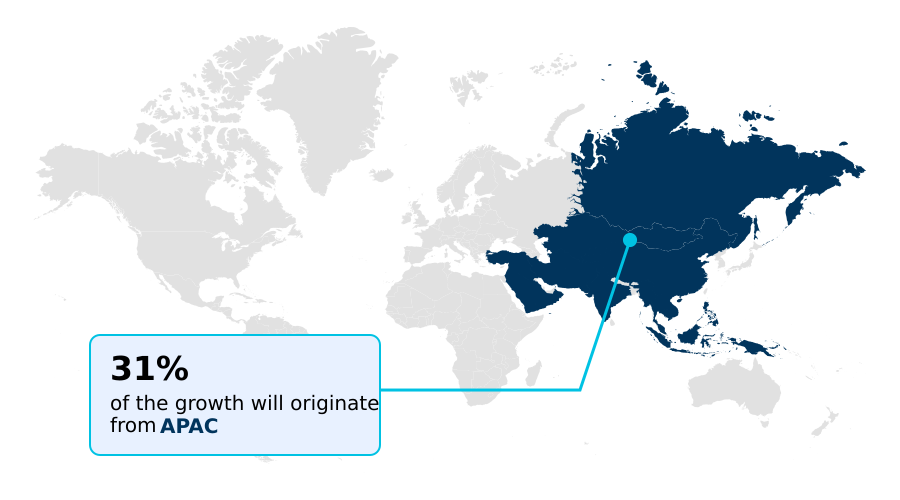
See How Defoamers Market Demand is Rising in APAC Get Free Sample

The geographic distribution of the Defoamers Market highlights distinct regional adoption patterns driven by industrial modernization and regulatory compliance. APAC currently outpaces North America in production output, fueled by extensive investments in seawater desalination facilities and massive paper mill expansions.

Facilities in APAC have achieved a 25% increase in manufacturing throughput by integrating cost-effective ethylene bis stearamide waxes and mineral oil carrier fluids.

In contrast, North America prioritizes eco-friendly solutions, where stringent environmental mandates have driven a 35% higher adoption rate of biodegradable antifoaming agents compared to emerging economies.

North American operators leverage closed loop manufacturing systems to reduce chemical waste processing costs by 18%.

This regional divergence underscores how distinct regulatory emission restrictions and industrial scaling priorities shape the procurement of customized fatty alcohol dispersions and high-performance foam control additives across global supply chains.

Market Dynamics

Our researchers analyzed the data with 2025 as the base year, along with the key drivers, trends, and challenges. A holistic analysis of drivers will help companies refine their marketing strategies to gain a competitive advantage.

  • The formulation and deployment of specialized chemical additives require precision engineering to address complex fluid dynamic challenges across diverse manufacturing sectors. Optimizing polyether modified siloxane surface tension is critical for ensuring rapid bubble rupture in high-stress industrial environments without compromising the chemical integrity of the primary fluid matrix.
  • In the paper manufacturing industry, the introduction of hydrophobic silica in paper pulp processing significantly enhances drainage rates and prevents equipment overflow during intensive bleaching sequences. Concurrently, the architectural construction sector heavily relies on advanced waterborne coatings foam control formulation techniques to eliminate micro-bubbles and prevent surface defects such as cratering and pinholes during high-speed application.
  • Facilities adopting these refined additive systems frequently observe a reduction in product rejection rates, achieving defect-free finishes at a ratio substantially higher than operations utilizing conventional unrefined surfactants. Furthermore, stringent environmental discharge mandates have accelerated the transition toward biodegradable defoamers for wastewater treatment, ensuring that industrial effluent management systems remain compliant with ecological safety standards while maintaining continuous operational uptime.
  • In the food and beverage sector, maintaining food grade silicone emulsion stability remains paramount during high-temperature sugar extraction and fermentation processes. By securing reliable raw material supply chains and deploying highly specialized liquid management formulations, facility operators successfully mitigate the risks associated with excessive air entrainment, ultimately safeguarding continuous production schedules and maximizing overall manufacturing yield.
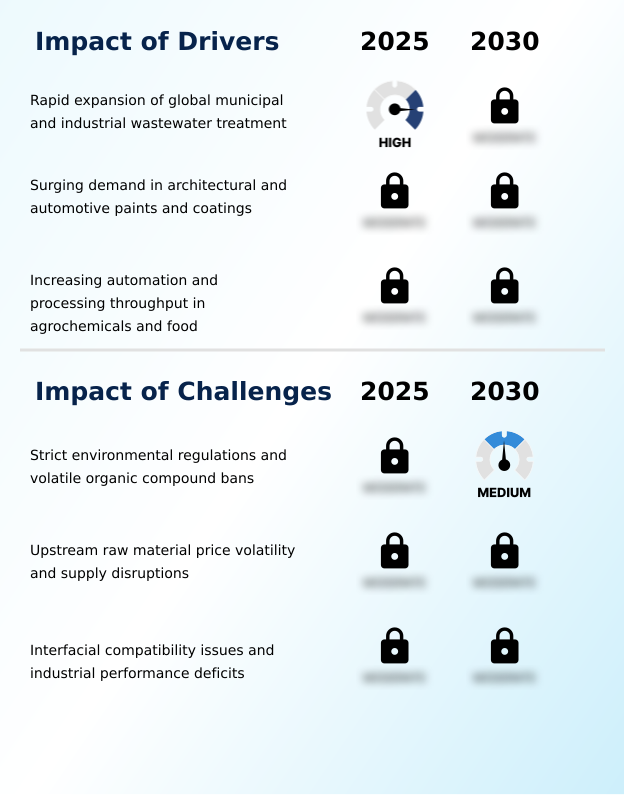
What are the key market drivers leading to the rise in the adoption of Defoamers Industry?

  • The rapid expansion of municipal wastewater infrastructure and industrial effluent treatment facilities serves as a primary catalyst for increased consumption of specialized defoaming agents.

  • The escalating complexity of global manufacturing infrastructure necessitates robust fluid control mechanisms to maintain uninterrupted production sequences.
  • A primary catalyst for this demand is the rapid expansion of agrochemical tank mixing and high-yield agricultural formulation processes, which inherently generate volatile micro-foams.
  • To counteract this, facility managers incorporate specialized polydimethylsiloxane fluids and thermal stability enhancers, achieving a 28% improvement in automated volumetric filling precision.
  • Additionally, the proliferation of flexographic inks packaging demands defect-free surface finishes, compelling commercial printers to adopt advanced interfacial compatibility testing protocols. This technical adoption reduces substrate rejection rates by 18% while optimizing high-speed printing operations.
  • Ultimately, the absolute necessity to eliminate supply chain bottlenecks and maintain continuous factory throughput forces heavy industrial sectors to secure reliable, high-performance chemical additives.

What are the market trends shaping the Defoamers Industry?

  • The commercial transition toward bio-based and renewable defoaming formulations represents a defining technological shift within the industry. Manufacturers are prioritizing sustainable chemical architectures to satisfy stringent environmental standards and corporate sustainability targets.

  • The continuous evolution of fluid management technology reveals a decisive transition toward highly specialized, environmentally benign additive chemistries across heavy manufacturing sectors. Formulators are aggressively engineering advanced organo modified silicones and natural triglyceride derivatives to replace persistent synthetic pollutants in sensitive ecosystems.
  • This chemical substitution directly addresses regulatory pressures, enabling wastewater facilities utilizing membrane bioreactor defoaming technology and hydrophobic silica particles to improve oxygen transfer efficiency by 22%. Furthermore, the integration of circular economy integration principles compels industrial operators to utilize recyclable packaging and renewable feedstock inputs, driving a 15% reduction in overall carbon emissions during production cycles.
  • The rising deployment of anaerobic adhesives bonding processes in automotive assembly lines further necessitates ultra-pure interfacial tension reducers that prevent microscopic air entrapment. Ultimately, these sustainable innovations allow commercial enterprises to maintain high performance metrics while fully complying with tightening global ecological safety directives.

What challenges does the Defoamers Industry face during its growth?

  • Strict environmental regulations and sweeping bans on volatile organic compounds present substantial formulation and compliance hurdles for specialty chemical manufacturers.

  • Navigating the stringent landscape of international chemical safety regulations presents a formidable barrier for formulators attempting to balance performance with ecological compliance. The mandate to achieve food grade compliance in processing sectors requires the absolute removal of toxic residues, fundamentally complicating the synthesis of traditional chemical additives.
  • Formulators addressing these constraints face a 35% increase in research and development expenditures to engineer stable alternatives. Furthermore, severe high temperature fluid dynamics in refining operations frequently cause spontaneous emulsion separation, reducing the operational lifespan of active chemical agents by up to 25%.
  • Addressing these physical limitations while overcoming unpredictable raw material price volatility forces specialty additive manufacturers to continuously adjust capital allocation, stretching profit margins across critical aerospace advanced polymers, synthetic latex resins, and heavy duty industrial cleaning supply chains.

Exclusive Technavio Analysis on Customer Landscape

The defoamers market forecasting report includes the adoption lifecycle of the market, covering from the innovator’s stage to the laggard’s stage. It focuses on adoption rates in different regions based on penetration. Furthermore, the defoamers market report also includes key purchase criteria and drivers of price sensitivity to help companies evaluate and develop their market growth analysis strategies.
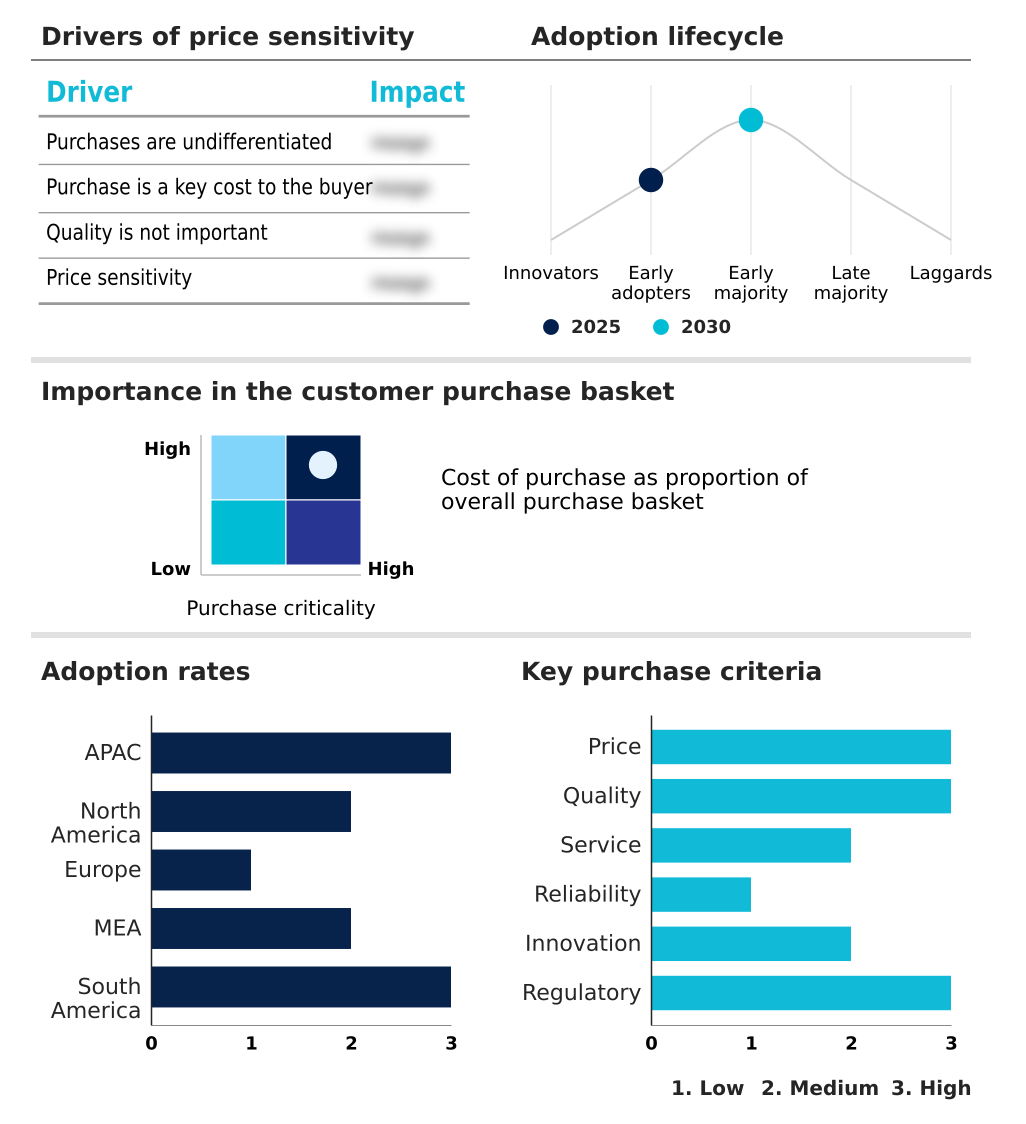
Customer Landscape of Defoamers Industry

Competitive Landscape

Companies are implementing various strategies, such as strategic alliances, defoamers market forecast, partnerships, mergers and acquisitions, geographical expansion, and product/service launches, to enhance their presence in the industry.

Air Products and Chem Inc. - The organization provides specialized foam control formulations designed to optimize fluid dynamics and prevent surface defects across demanding industrial, chemical, and manufacturing processing applications.

The industry research and growth report includes detailed analyses of the competitive landscape of the market and information about key companies, including:

  • Air Products and Chem Inc.
  • Ashland Inc.
  • BASF SE
  • BYK Chemie GmbH
  • CHT Germany GmbH
  • Clariant International Ltd.
  • Croda International Plc
  • Dow Chemical Co.
  • Elementis Plc
  • Elkem ASA
  • Evonik Industries AG
  • Fine Organic Industries Ltd.
  • Huntsman International LLC
  • Hydrite Chemical Co.
  • Kao Corp.
  • KCC Co. Ltd.
  • Kemira Oyj
  • King Industries Inc.
  • Solvay SA
  • Wacker Chemie AG

Qualitative and quantitative analysis of companies has been conducted to help clients understand the wider business environment as well as the strengths and weaknesses of key industry players. Data is qualitatively analyzed to categorize companies as pure play, category-focused, industry-focused, and diversified; it is quantitatively analyzed to categorize companies as dominant, leading, strong, tentative, and weak.

Recent Development and News in Defoamers market

  • In the Specialty Chemicals industry, the widespread transition toward waterborne coating architectures has mandated the elimination of solvent-based additives, directly impacting Defoamers demand by requiring advanced low-emission foam control formulations.
  • The enforcement of stringent zero liquid discharge regulations in industrial wastewater management has forced processing facilities to maximize membrane filtration efficiency, pulling higher volumes of specialized biodegradable antifoaming agents into the Defoamers market.
  • Advancements in synthetic biology and renewable feedstock processing have enabled the mass production of plant-derived ester derivatives, creating new commercial opportunities for bio-based surfactants within the Defoamers market.
  • The tightening of food-contact safety standards by international regulatory bodies has restricted the use of traditional cyclic siloxane impurities, shifting Defoamers demand toward ultra-pure silicone polyether copolymers for commercial food processing.

Dive into Technavio’s robust research methodology, blending expert interviews, extensive data synthesis, and validated models for unparalleled Defoamers Market insights. See full methodology.

Market Scope
Page number 319
Base year 2025
Historic period 2020-2024
Forecast period 2026-2030
Growth momentum & CAGR Accelerate at a CAGR of 4.7%
Market growth 2026-2030 USD 2296.2 million
Market structure Fragmented
YoY growth 2025-2026(%) 4.5%
Key countries China, India, Japan, South Korea, Indonesia, Australia, US, Canada, Mexico, Germany, UK, France, Italy, Spain, The Netherlands, Saudi Arabia, UAE, South Africa, Turkey, Israel, Brazil, Argentina and Chile
Competitive landscape Leading Companies, Market Positioning of Companies, Competitive Strategies, and Industry Risks

Request Free Sample

Research Analyst Overview

  • Strategic decision-makers across the chemical manufacturing sector are increasingly prioritizing sustainable raw material sourcing to align with global environmental mandates and corporate governance objectives. The aggressive transition toward bio based surfactants and vegetable oil emulsions fundamentally reshapes product development pipelines, forcing procurement directors to evaluate alternative supply chains that mitigate reliance on volatile petrochemical feedstocks.
  • This shift away from legacy hydrocarbon chemistries enables enterprises to launch formulations with low volatile organic compounds, directly appealing to environmentally conscious consumers and heavily regulated industrial end-users. By replacing outdated additives with advanced silicone polyether copolymers and waterborne siloxane emulsions, plant operators have successfully realized a 30% reduction in processing time during complex separation phases.
  • The integration of high-purity polyurethane foam additives and precision acrylic surface coatings further enhances defect-free finishes in commercial applications. Furthermore, the proactive elimination of cyclic siloxane impurities from product portfolios allows multinational chemical suppliers to secure premium certifications, solidifying long-term market competitiveness while ensuring consistent operational safety across high-shear manufacturing environments.

What are the Key Data Covered in this Defoamers Market Research and Growth Report?

  • What is the expected growth of the Defoamers Market between 2026 and 2030?

    • USD 2.30 billion, at a CAGR of 4.7%

  • What segmentation does the market report cover?

    • The report is segmented by Type (Water-based, Silicone-based, Mineral-oil based, and Others), Application (Architectural, Industrial, Wood and furniture, Automotive, and Others), Form Factor (Liquid, Emulsion, and Powder) and Geography (APAC, North America, Europe, Middle East and Africa, South America)

  • Which regions are analyzed in the report?

    • APAC, North America, Europe, Middle East and Africa and South America

  • What are the key growth drivers and market challenges?

    • Rapid expansion of global municipal and industrial wastewater treatment, Strict environmental regulations and volatile organic compound bans

  • Who are the major players in the Defoamers Market?

    • Air Products and Chem Inc., Ashland Inc., BASF SE, BYK Chemie GmbH, CHT Germany GmbH, Clariant International Ltd., Croda International Plc, Dow Chemical Co., Elementis Plc, Elkem ASA, Evonik Industries AG, Fine Organic Industries Ltd., Huntsman International LLC, Hydrite Chemical Co., Kao Corp., KCC Co. Ltd., Kemira Oyj, King Industries Inc., Solvay SA and Wacker Chemie AG

Market Research Insights

  • The Defoamers Market operates as a foundational pillar within industrial fluid management, ensuring uninterrupted operational throughput across complex manufacturing environments. Enterprises managing municipal wastewater infrastructure and industrial effluent treatment integrate advanced additives to accelerate processing cycles and prevent mechanical cavitation.
  • Facilities adopting these high-efficiency foam control solutions report a 30% reduction in equipment downtime and a 20% improvement in volumetric container filling accuracy during commercial beverage bottling operations. Furthermore, the integration of automated dosing systems allows plant operators to optimize chemical consumption rates, achieving a 15% decrease in overall operational costs.
  • By mitigating raw material price volatility through diversified chemical sourcing, industry participants ensure consistent supply chain stability across critical sectors like textile dyeing processes.

We can help! Our analysts can customize this defoamers market research report to meet your requirements.

Get in touch

1. Executive Summary

1.1 Market overview

Executive Summary - Chart on Market Overview
Executive Summary - Data Table on Market Overview
Executive Summary - Chart on Global Market Characteristics
Executive Summary - Chart on Market by Geography
Executive Summary - Chart on Market Segmentation by Type
Executive Summary - Chart on Market Segmentation by Application
Executive Summary - Chart on Market Segmentation by Form Factor
Executive Summary - Chart on Incremental Growth
Executive Summary - Data Table on Incremental Growth
Executive Summary - Chart on Company Market Positioning

2. Technavio Analysis

2.1 Analysis of price sensitivity, lifecycle, customer purchase basket, adoption rates, and purchase criteria

2.2 Criticality of inputs and Factors of differentiation

Chart on Overview on criticality of inputs and factors of differentiation

2.3 Factors of disruption

Chart on Overview on factors of disruption

2.4 Impact of drivers and challenges

Chart on Impact of drivers and challenges in 2025 and 2030

3. Market Landscape

3.1 Market ecosystem

Chart on Parent Market
Data Table on - Parent Market

3.2 Market characteristics

Chart on Market characteristics analysis

3.3 Value chain analysis

Chart on Value chain analysis

4. Market Sizing

4.1 Market definition

Data Table on Offerings of companies included in the market definition

4.2 Market segment analysis

Market segments

4.3 Market size 2025

4.4 Market outlook: Forecast for 2025-2030

Chart on Global - Market size and forecast 2025-2030 ($ million)
Data Table on Global - Market size and forecast 2025-2030 ($ million)
Chart on Global Market: Year-over-year growth 2025-2030 (%)
Data Table on Global Market: Year-over-year growth 2025-2030 (%)

5. Historic Market Size

5.1 Global Defoamers Market 2020 - 2024

Historic Market Size - Data Table on Global Defoamers Market 2020 - 2024 ($ million)

5.2 Type segment analysis 2020 - 2024

Historic Market Size - Type Segment 2020 - 2024 ($ million)

5.3 Application segment analysis 2020 - 2024

Historic Market Size - Application Segment 2020 - 2024 ($ million)

5.4 Form Factor segment analysis 2020 - 2024

Historic Market Size - Form Factor Segment 2020 - 2024 ($ million)

5.5 Geography segment analysis 2020 - 2024

Historic Market Size - Geography Segment 2020 - 2024 ($ million)

5.6 Country segment analysis 2020 - 2024

Historic Market Size - Country Segment 2020 - 2024 ($ million)

6. Qualitative Analysis

6.1 Impact of AI on global defoamers market

6.2 Impact of geopolitical conflicts on global defoamers market

7. Five Forces Analysis

7.1 Five forces summary

Five forces analysis - Comparison between 2025 and 2030

7.2 Bargaining power of buyers

Bargaining power of buyers - Impact of key factors 2025 and 2030

7.3 Bargaining power of suppliers

Bargaining power of suppliers - Impact of key factors in 2025 and 2030

7.4 Threat of new entrants

Threat of new entrants - Impact of key factors in 2025 and 2030

7.5 Threat of substitutes

Threat of substitutes - Impact of key factors in 2025 and 2030

7.6 Threat of rivalry

Threat of rivalry - Impact of key factors in 2025 and 2030

7.7 Market condition

Chart on Market condition - Five forces 2025 and 2030

8. Market Segmentation by Type

8.1 Market segments

Chart on Type - Market share 2025-2030 (%)
Data Table on Type - Market share 2025-2030 (%)

8.2 Comparison by Type

Chart on Comparison by Type
Data Table on Comparison by Type

8.3 Water-based - Market size and forecast 2025-2030

Chart on Water-based - Market size and forecast 2025-2030 ($ million)
Data Table on Water-based - Market size and forecast 2025-2030 ($ million)
Chart on Water-based - Year-over-year growth 2025-2030 (%)
Data Table on Water-based - Year-over-year growth 2025-2030 (%)

8.4 Silicone-based - Market size and forecast 2025-2030

Chart on Silicone-based - Market size and forecast 2025-2030 ($ million)
Data Table on Silicone-based - Market size and forecast 2025-2030 ($ million)
Chart on Silicone-based - Year-over-year growth 2025-2030 (%)
Data Table on Silicone-based - Year-over-year growth 2025-2030 (%)

8.5 Mineral-oil based - Market size and forecast 2025-2030

Chart on Mineral-oil based - Market size and forecast 2025-2030 ($ million)
Data Table on Mineral-oil based - Market size and forecast 2025-2030 ($ million)
Chart on Mineral-oil based - Year-over-year growth 2025-2030 (%)
Data Table on Mineral-oil based - Year-over-year growth 2025-2030 (%)

8.6 Others - Market size and forecast 2025-2030

Chart on Others - Market size and forecast 2025-2030 ($ million)
Data Table on Others - Market size and forecast 2025-2030 ($ million)
Chart on Others - Year-over-year growth 2025-2030 (%)
Data Table on Others - Year-over-year growth 2025-2030 (%)

8.7 Market opportunity by Type

Market opportunity by Type ($ million)
Data Table on Market opportunity by Type ($ million)

9. Market Segmentation by Application

9.1 Market segments

Chart on Application - Market share 2025-2030 (%)
Data Table on Application - Market share 2025-2030 (%)

9.2 Comparison by Application

Chart on Comparison by Application
Data Table on Comparison by Application

9.3 Architectural - Market size and forecast 2025-2030

Chart on Architectural - Market size and forecast 2025-2030 ($ million)
Data Table on Architectural - Market size and forecast 2025-2030 ($ million)
Chart on Architectural - Year-over-year growth 2025-2030 (%)
Data Table on Architectural - Year-over-year growth 2025-2030 (%)

9.4 Industrial - Market size and forecast 2025-2030

Chart on Industrial - Market size and forecast 2025-2030 ($ million)
Data Table on Industrial - Market size and forecast 2025-2030 ($ million)
Chart on Industrial - Year-over-year growth 2025-2030 (%)
Data Table on Industrial - Year-over-year growth 2025-2030 (%)

9.5 Wood and furniture - Market size and forecast 2025-2030

Chart on Wood and furniture - Market size and forecast 2025-2030 ($ million)
Data Table on Wood and furniture - Market size and forecast 2025-2030 ($ million)
Chart on Wood and furniture - Year-over-year growth 2025-2030 (%)
Data Table on Wood and furniture - Year-over-year growth 2025-2030 (%)

9.6 Automotive - Market size and forecast 2025-2030

Chart on Automotive - Market size and forecast 2025-2030 ($ million)
Data Table on Automotive - Market size and forecast 2025-2030 ($ million)
Chart on Automotive - Year-over-year growth 2025-2030 (%)
Data Table on Automotive - Year-over-year growth 2025-2030 (%)

9.7 Others - Market size and forecast 2025-2030

Chart on Others - Market size and forecast 2025-2030 ($ million)
Data Table on Others - Market size and forecast 2025-2030 ($ million)
Chart on Others - Year-over-year growth 2025-2030 (%)
Data Table on Others - Year-over-year growth 2025-2030 (%)

9.8 Market opportunity by Application

Market opportunity by Application ($ million)
Data Table on Market opportunity by Application ($ million)

10. Market Segmentation by Form Factor

10.1 Market segments

Chart on Form Factor - Market share 2025-2030 (%)
Data Table on Form Factor - Market share 2025-2030 (%)

10.2 Comparison by Form Factor

Chart on Comparison by Form Factor
Data Table on Comparison by Form Factor

10.3 Liquid - Market size and forecast 2025-2030

Chart on Liquid - Market size and forecast 2025-2030 ($ million)
Data Table on Liquid - Market size and forecast 2025-2030 ($ million)
Chart on Liquid - Year-over-year growth 2025-2030 (%)
Data Table on Liquid - Year-over-year growth 2025-2030 (%)

10.4 Emulsion - Market size and forecast 2025-2030

Chart on Emulsion - Market size and forecast 2025-2030 ($ million)
Data Table on Emulsion - Market size and forecast 2025-2030 ($ million)
Chart on Emulsion - Year-over-year growth 2025-2030 (%)
Data Table on Emulsion - Year-over-year growth 2025-2030 (%)

10.5 Powder - Market size and forecast 2025-2030

Chart on Powder - Market size and forecast 2025-2030 ($ million)
Data Table on Powder - Market size and forecast 2025-2030 ($ million)
Chart on Powder - Year-over-year growth 2025-2030 (%)
Data Table on Powder - Year-over-year growth 2025-2030 (%)

10.6 Market opportunity by Form Factor

Market opportunity by Form Factor ($ million)
Data Table on Market opportunity by Form Factor ($ million)

11. Customer Landscape

11.1 Customer landscape overview

Analysis of price sensitivity, lifecycle, customer purchase basket, adoption rates, and purchase criteria

12. Geographic Landscape

12.1 Geographic segmentation

Chart on Market share by geography 2025-2030 (%)
Data Table on Market share by geography 2025-2030 (%)

12.2 Geographic comparison

Chart on Geographic comparison
Data Table on Geographic comparison

12.3 APAC - Market size and forecast 2025-2030

Chart on APAC - Market size and forecast 2025-2030 ($ million)
Data Table on APAC - Market size and forecast 2025-2030 ($ million)
Chart on APAC - Year-over-year growth 2025-2030 (%)
Data Table on APAC - Year-over-year growth 2025-2030 (%)
Chart on Regional Comparison - APAC
Data Table on Regional Comparison - APAC

12.3.1 China - Market size and forecast 2025-2030

Chart on China - Market size and forecast 2025-2030 ($ million)
Data Table on China - Market size and forecast 2025-2030 ($ million)
Chart on China - Year-over-year growth 2025-2030 (%)
Data Table on China - Year-over-year growth 2025-2030 (%)

12.3.2 India - Market size and forecast 2025-2030

Chart on India - Market size and forecast 2025-2030 ($ million)
Data Table on India - Market size and forecast 2025-2030 ($ million)
Chart on India - Year-over-year growth 2025-2030 (%)
Data Table on India - Year-over-year growth 2025-2030 (%)

12.3.3 Japan - Market size and forecast 2025-2030

Chart on Japan - Market size and forecast 2025-2030 ($ million)
Data Table on Japan - Market size and forecast 2025-2030 ($ million)
Chart on Japan - Year-over-year growth 2025-2030 (%)
Data Table on Japan - Year-over-year growth 2025-2030 (%)

12.3.4 South Korea - Market size and forecast 2025-2030

Chart on South Korea - Market size and forecast 2025-2030 ($ million)
Data Table on South Korea - Market size and forecast 2025-2030 ($ million)
Chart on South Korea - Year-over-year growth 2025-2030 (%)
Data Table on South Korea - Year-over-year growth 2025-2030 (%)

12.3.5 Indonesia - Market size and forecast 2025-2030

Chart on Indonesia - Market size and forecast 2025-2030 ($ million)
Data Table on Indonesia - Market size and forecast 2025-2030 ($ million)
Chart on Indonesia - Year-over-year growth 2025-2030 (%)
Data Table on Indonesia - Year-over-year growth 2025-2030 (%)

12.3.6 Australia - Market size and forecast 2025-2030

Chart on Australia - Market size and forecast 2025-2030 ($ million)
Data Table on Australia - Market size and forecast 2025-2030 ($ million)
Chart on Australia - Year-over-year growth 2025-2030 (%)
Data Table on Australia - Year-over-year growth 2025-2030 (%)

12.4 North America - Market size and forecast 2025-2030

Chart on North America - Market size and forecast 2025-2030 ($ million)
Data Table on North America - Market size and forecast 2025-2030 ($ million)
Chart on North America - Year-over-year growth 2025-2030 (%)
Data Table on North America - Year-over-year growth 2025-2030 (%)
Chart on Regional Comparison - North America
Data Table on Regional Comparison - North America

12.4.1 US - Market size and forecast 2025-2030

Chart on US - Market size and forecast 2025-2030 ($ million)
Data Table on US - Market size and forecast 2025-2030 ($ million)
Chart on US - Year-over-year growth 2025-2030 (%)
Data Table on US - Year-over-year growth 2025-2030 (%)

12.4.2 Canada - Market size and forecast 2025-2030

Chart on Canada - Market size and forecast 2025-2030 ($ million)
Data Table on Canada - Market size and forecast 2025-2030 ($ million)
Chart on Canada - Year-over-year growth 2025-2030 (%)
Data Table on Canada - Year-over-year growth 2025-2030 (%)

12.4.3 Mexico - Market size and forecast 2025-2030

Chart on Mexico - Market size and forecast 2025-2030 ($ million)
Data Table on Mexico - Market size and forecast 2025-2030 ($ million)
Chart on Mexico - Year-over-year growth 2025-2030 (%)
Data Table on Mexico - Year-over-year growth 2025-2030 (%)

12.5 Europe - Market size and forecast 2025-2030

Chart on Europe - Market size and forecast 2025-2030 ($ million)
Data Table on Europe - Market size and forecast 2025-2030 ($ million)
Chart on Europe - Year-over-year growth 2025-2030 (%)
Data Table on Europe - Year-over-year growth 2025-2030 (%)
Chart on Regional Comparison - Europe
Data Table on Regional Comparison - Europe

12.5.1 Germany - Market size and forecast 2025-2030

Chart on Germany - Market size and forecast 2025-2030 ($ million)
Data Table on Germany - Market size and forecast 2025-2030 ($ million)
Chart on Germany - Year-over-year growth 2025-2030 (%)
Data Table on Germany - Year-over-year growth 2025-2030 (%)

12.5.2 UK - Market size and forecast 2025-2030

Chart on UK - Market size and forecast 2025-2030 ($ million)
Data Table on UK - Market size and forecast 2025-2030 ($ million)
Chart on UK - Year-over-year growth 2025-2030 (%)
Data Table on UK - Year-over-year growth 2025-2030 (%)

12.5.3 France - Market size and forecast 2025-2030

Chart on France - Market size and forecast 2025-2030 ($ million)
Data Table on France - Market size and forecast 2025-2030 ($ million)
Chart on France - Year-over-year growth 2025-2030 (%)
Data Table on France - Year-over-year growth 2025-2030 (%)

12.5.4 Italy - Market size and forecast 2025-2030

Chart on Italy - Market size and forecast 2025-2030 ($ million)
Data Table on Italy - Market size and forecast 2025-2030 ($ million)
Chart on Italy - Year-over-year growth 2025-2030 (%)
Data Table on Italy - Year-over-year growth 2025-2030 (%)

12.5.5 Spain - Market size and forecast 2025-2030

Chart on Spain - Market size and forecast 2025-2030 ($ million)
Data Table on Spain - Market size and forecast 2025-2030 ($ million)
Chart on Spain - Year-over-year growth 2025-2030 (%)
Data Table on Spain - Year-over-year growth 2025-2030 (%)

12.5.6 The Netherlands - Market size and forecast 2025-2030

Chart on The Netherlands - Market size and forecast 2025-2030 ($ million)
Data Table on The Netherlands - Market size and forecast 2025-2030 ($ million)
Chart on The Netherlands - Year-over-year growth 2025-2030 (%)
Data Table on The Netherlands - Year-over-year growth 2025-2030 (%)

12.6 Middle East and Africa - Market size and forecast 2025-2030

Chart on Middle East and Africa - Market size and forecast 2025-2030 ($ million)
Data Table on Middle East and Africa - Market size and forecast 2025-2030 ($ million)
Chart on Middle East and Africa - Year-over-year growth 2025-2030 (%)
Data Table on Middle East and Africa - Year-over-year growth 2025-2030 (%)
Chart on Regional Comparison - Middle East and Africa
Data Table on Regional Comparison - Middle East and Africa

12.6.1 Saudi Arabia - Market size and forecast 2025-2030

Chart on Saudi Arabia - Market size and forecast 2025-2030 ($ million)
Data Table on Saudi Arabia - Market size and forecast 2025-2030 ($ million)
Chart on Saudi Arabia - Year-over-year growth 2025-2030 (%)
Data Table on Saudi Arabia - Year-over-year growth 2025-2030 (%)

12.6.2 UAE - Market size and forecast 2025-2030

Chart on UAE - Market size and forecast 2025-2030 ($ million)
Data Table on UAE - Market size and forecast 2025-2030 ($ million)
Chart on UAE - Year-over-year growth 2025-2030 (%)
Data Table on UAE - Year-over-year growth 2025-2030 (%)

12.6.3 South Africa - Market size and forecast 2025-2030

Chart on South Africa - Market size and forecast 2025-2030 ($ million)
Data Table on South Africa - Market size and forecast 2025-2030 ($ million)
Chart on South Africa - Year-over-year growth 2025-2030 (%)
Data Table on South Africa - Year-over-year growth 2025-2030 (%)

12.6.4 Turkey - Market size and forecast 2025-2030

Chart on Turkey - Market size and forecast 2025-2030 ($ million)
Data Table on Turkey - Market size and forecast 2025-2030 ($ million)
Chart on Turkey - Year-over-year growth 2025-2030 (%)
Data Table on Turkey - Year-over-year growth 2025-2030 (%)

12.6.5 Israel - Market size and forecast 2025-2030

Chart on Israel - Market size and forecast 2025-2030 ($ million)
Data Table on Israel - Market size and forecast 2025-2030 ($ million)
Chart on Israel - Year-over-year growth 2025-2030 (%)
Data Table on Israel - Year-over-year growth 2025-2030 (%)

12.7 South America - Market size and forecast 2025-2030

Chart on South America - Market size and forecast 2025-2030 ($ million)
Data Table on South America - Market size and forecast 2025-2030 ($ million)
Chart on South America - Year-over-year growth 2025-2030 (%)
Data Table on South America - Year-over-year growth 2025-2030 (%)
Chart on Regional Comparison - South America
Data Table on Regional Comparison - South America

12.7.1 Brazil - Market size and forecast 2025-2030

Chart on Brazil - Market size and forecast 2025-2030 ($ million)
Data Table on Brazil - Market size and forecast 2025-2030 ($ million)
Chart on Brazil - Year-over-year growth 2025-2030 (%)
Data Table on Brazil - Year-over-year growth 2025-2030 (%)

12.7.2 Argentina - Market size and forecast 2025-2030

Chart on Argentina - Market size and forecast 2025-2030 ($ million)
Data Table on Argentina - Market size and forecast 2025-2030 ($ million)
Chart on Argentina - Year-over-year growth 2025-2030 (%)
Data Table on Argentina - Year-over-year growth 2025-2030 (%)

12.7.3 Chile - Market size and forecast 2025-2030

Chart on Chile - Market size and forecast 2025-2030 ($ million)
Data Table on Chile - Market size and forecast 2025-2030 ($ million)
Chart on Chile - Year-over-year growth 2025-2030 (%)
Data Table on Chile - Year-over-year growth 2025-2030 (%)

12.8 Market opportunity by geography

Market opportunity by geography ($ million)
Data Tables on Market opportunity by geography ($ million)

13. Drivers, Challenges, and Opportunity

13.1 Market drivers

Rapid expansion of global municipal and industrial wastewater treatment
Surging demand in architectural and automotive paints and coatings
Increasing automation and processing throughput in agrochemicals and food

13.2 Market challenges

Strict environmental regulations and volatile organic compound bans
Upstream raw material price volatility and supply disruptions
Interfacial compatibility issues and industrial performance deficits

13.3 Impact of drivers and challenges

Impact of drivers and challenges in 2025 and 2030

13.4 Market opportunities

Commercial shift toward bio based and renewable defoaming formulations
Development of high performance silicone polyether hybrid topologies
Expansion of specialized food grade and pharmaceutical compliance formulations

14. Competitive Landscape

14.1 Overview

14.2

Overview on criticality of inputs and factors of differentiation

14.3 Landscape disruption

Overview on factors of disruption

14.4 Industry risks

Impact of key risks on business

15. Competitive Analysis

15.1 Companies profiled

Companies covered

15.2 Company ranking index

15.3 Market positioning of companies

Matrix on companies position and classification

15.4 Air Products and Chem Inc.

Air Products and Chem Inc. - Overview
Air Products and Chem Inc. - Business segments
Air Products and Chem Inc. - Key offerings
Air Products and Chem Inc. - Segment focus
SWOT

15.5 Ashland Inc.

Ashland Inc. - Overview
Ashland Inc. - Business segments
Ashland Inc. - Key news
Ashland Inc. - Key offerings
Ashland Inc. - Segment focus
SWOT

15.6 BASF SE

BASF SE - Overview
BASF SE - Business segments
BASF SE - Key news
BASF SE - Key offerings
BASF SE - Segment focus
SWOT

15.7 Clariant International Ltd.

Clariant International Ltd. - Overview
Clariant International Ltd. - Business segments
Clariant International Ltd. - Key offerings
Clariant International Ltd. - Segment focus
SWOT

15.8 Croda International Plc

Croda International Plc - Overview
Croda International Plc - Business segments
Croda International Plc - Key offerings
Croda International Plc - Segment focus
SWOT

15.9 Dow Chemical Co.

Dow Chemical Co. - Overview
Dow Chemical Co. - Business segments
Dow Chemical Co. - Key news
Dow Chemical Co. - Key offerings
Dow Chemical Co. - Segment focus
SWOT

15.10 Elementis Plc

Elementis Plc - Overview
Elementis Plc - Business segments
Elementis Plc - Key offerings
Elementis Plc - Segment focus
SWOT

15.11 Elkem ASA

Elkem ASA - Overview
Elkem ASA - Business segments
Elkem ASA - Key offerings
Elkem ASA - Segment focus
SWOT

15.12 Evonik Industries AG

Evonik Industries AG - Overview
Evonik Industries AG - Business segments
Evonik Industries AG - Key news
Evonik Industries AG - Key offerings
Evonik Industries AG - Segment focus
SWOT

15.13 Fine Organic Industries Ltd.

Fine Organic Industries Ltd. - Overview
Fine Organic Industries Ltd. - Product / Service
Fine Organic Industries Ltd. - Key offerings
SWOT

15.14 Huntsman International LLC

Huntsman International LLC - Overview
Huntsman International LLC - Business segments
Huntsman International LLC - Key news
Huntsman International LLC - Key offerings
Huntsman International LLC - Segment focus
SWOT

15.15 Kao Corp.

Kao Corp. - Overview
Kao Corp. - Business segments
Kao Corp. - Key news
Kao Corp. - Key offerings
Kao Corp. - Segment focus
SWOT

15.16 KCC Co. Ltd.

KCC Co. Ltd. - Overview
KCC Co. Ltd. - Product / Service
KCC Co. Ltd. - Key offerings
SWOT

15.17 Solvay SA

Solvay SA - Overview
Solvay SA - Business segments
Solvay SA - Key offerings
Solvay SA - Segment focus
SWOT

15.18 Wacker Chemie AG

Wacker Chemie AG - Overview
Wacker Chemie AG - Business segments
Wacker Chemie AG - Key offerings
Wacker Chemie AG - Segment focus
SWOT

16. Appendix

16.1 Scope of the report

Market definition
Objectives
Notes and caveats

16.2 Inclusions and exclusions checklist

Inclusions checklist
Exclusions checklist

16.3 Currency conversion rates for US$

16.4 Research methodology

16.5 Data procurement

Information sources

16.6 Data validation

16.7 Validation techniques employed for market sizing

16.8 Data synthesis

16.9 360 degree market analysis

16.10 List of abbreviations

Research Methodology

Technavio presents a detailed picture of the market by way of study, synthesis, and summation of data from multiple sources. The analysts have presented the various facets of the market with a particular focus on identifying the key industry influencers. The data thus presented is comprehensive, reliable, and the result of extensive research, both primary and secondary.

INFORMATION SOURCES

Primary sources

  • Manufacturers and suppliers
  • Channel partners
  • Industry experts
  • Strategic decision makers

Secondary sources

  • Industry journals and periodicals
  • Government data
  • Financial reports of key industry players
  • Historical data
  • Press releases

DATA ANALYSIS

Data Synthesis

  • Collation of data
  • Estimation of key figures
  • Analysis of derived insights

Data Validation

  • Triangulation with data models
  • Reference against proprietary databases
  • Corroboration with industry experts

REPORT WRITING

Qualitative

  • Market drivers
  • Market challenges
  • Market trends
  • Five forces analysis

Quantitative

  • Market size and forecast
  • Market segmentation
  • Geographical insights
  • Competitive landscape

Interested in this report?

Get your sample now to see our research methodology and insights!

Download Now

Frequently Asked Questions

Defoamers market growth will increase by USD 2296.2 million during 2026-2030.

The Defoamers market is expected to grow at a CAGR of 4.7% during 2026-2030.

Defoamers market is segmented by Type (Water-based, Silicone-based, Mineral-oil based, Others) Application (Architectural, Industrial, Wood and furniture, Automotive, Others) Form factor (Liquid, Emulsion, Powder)

Air Products and Chem Inc., Ashland Inc., BASF SE, BYK Chemie GmbH, CHT Germany GmbH, Clariant International Ltd., Croda International Plc, Dow Chemical Co., Elementis Plc, Elkem ASA, Evonik Industries AG, Fine Organic Industries Ltd., Huntsman International LLC, Hydrite Chemical Co., Kao Corp., KCC Co. Ltd., Kemira Oyj, King Industries Inc., Solvay SA, Wacker Chemie AG are a few of the key vendors in the Defoamers market.

APAC will register the highest growth rate of 31.1% among the other regions. Therefore, the Defoamers market in APAC is expected to garner significant business opportunities for the vendors during the forecast period.

China, India, Japan, South Korea, Indonesia, Australia, US, Canada, Mexico, Germany, UK, France, Italy, Spain, The Netherlands, Saudi Arabia, UAE, South Africa, Turkey, Israel, Brazil, Argentina, Chile

  • Rapid expansion of global municipal and industrial wastewater treatment is the driving factor this market.

The Defoamers market vendors should focus on grabbing business opportunities from the Type segment as it accounted for the largest market share in the base year.
RIA - Research AI Assistant
Ask RIA
