
Europe Diagnostic Imaging Market Analysis, Size, and Forecast 2026-2030: Europe (Germany, UK, and Sweden)

Europe Diagnostic Imaging Market Analysis, Size, and Forecast 2026-2030:
Europe (Germany, UK, and Sweden)

Published: Oct 2026 256 Pages SKU: IRTNTR72157

Market Overview at a Glance

$3.18 B
Market Opportunity
6%
CAGR 2025 - 2030
5.8%
YoY growth 2025-2026(%)
$3.41 B
X-rays segment 2024

Europe Diagnostic Imaging Market Size 2026-2030

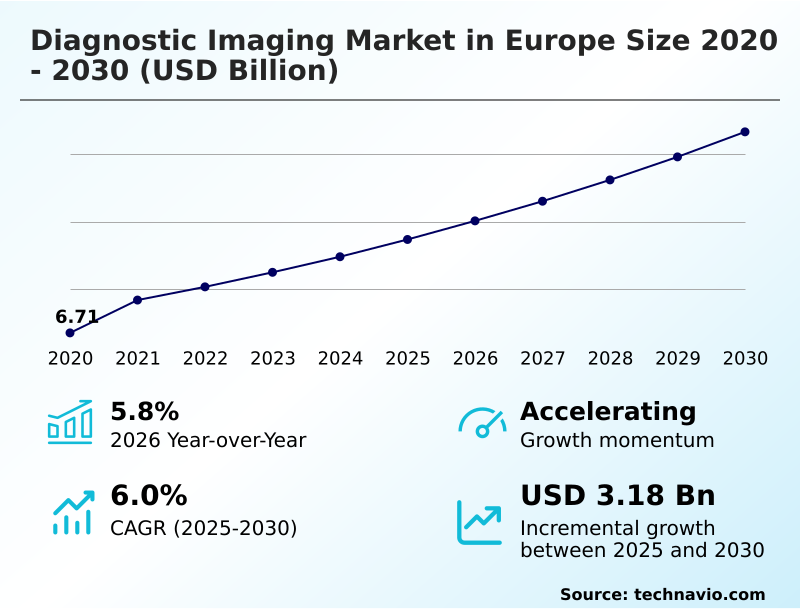
The europe diagnostic imaging market size is valued to increase by USD 3.18 billion, at a CAGR of 6% from 2025 to 2030. Increasing prevalence of chronic diseases and aging demographic will drive the europe diagnostic imaging market.

Major Market Trends & Insights

  • By Type - X-rays segment was valued at USD 3.41 billion in 2024
  • By Application - Cardiology segment accounted for the largest market revenue share in 2024

Market Size & Forecast

  • Market Opportunities: USD 5.93 billion
  • Market Future Opportunities: USD 3.18 billion
  • CAGR from 2025 to 2030 : 6%

Market Summary

  • The Diagnostic Imaging Market in Europe 2026-2030 demonstrates accelerating momentum as healthcare systems transition toward intelligent, data-driven patient care models. Clinical providers continuously upgrade their technological infrastructure to manage rising patient volumes safely and efficiently. For example, large regional hospital networks implementing centralized digital archiving systems have reduced image retrieval delays by 35%, significantly improving inter-departmental consultation times.
  • The fundamental driver propelling this ecosystem is the escalating prevalence of chronic conditions among an aging population, which necessitates high-volume, precision-focused clinical assessments to ensure timely therapeutic interventions. Conversely, severe budgetary constraints within public health sectors present a substantial challenge, often delaying the procurement of premium high-tier scanners and forcing institutions to extend the lifecycle of legacy equipment.
  • Despite these fiscal hurdles, the operational necessity for advanced anatomical visualization ensures continuous technological integration. Facilities prioritize scalable, AI-enhanced systems that maximize diagnostic yield and reduce operational bottlenecks, establishing a resilient foundation for modern medical workflows.

What will be the Size of the Europe Diagnostic Imaging Market during the forecast period?
Get Key Insights on Market Forecast (PDF) Get Free Sample

How is the Europe Diagnostic Imaging Market Segmented?

The europe diagnostic imaging industry research report provides comprehensive data (region-wise segment analysis), with forecasts and estimates in "USD million" for the period 2026-2030, as well as historical data from 2020-2024 for the following segments.

  • Type
    • X-rays
    • Ultrasound
    • MRI scans
    • CT scans
    • Others
  • Application
    • Cardiology
    • Oncology
    • Orthopedics
    • Neurology
    • Others
  • End-user
    • Hospital
    • Diagnostic and imaging centers
    • Specialty clinics
    • ASCs
  • Technology
    • Two dimensional imaging
    • Three dimensional and four dimensional imaging
    • AI-based imaging
  • Geography
    • Europe
      • Germany
      • UK
      • Sweden
      • Finland

By Type Insights

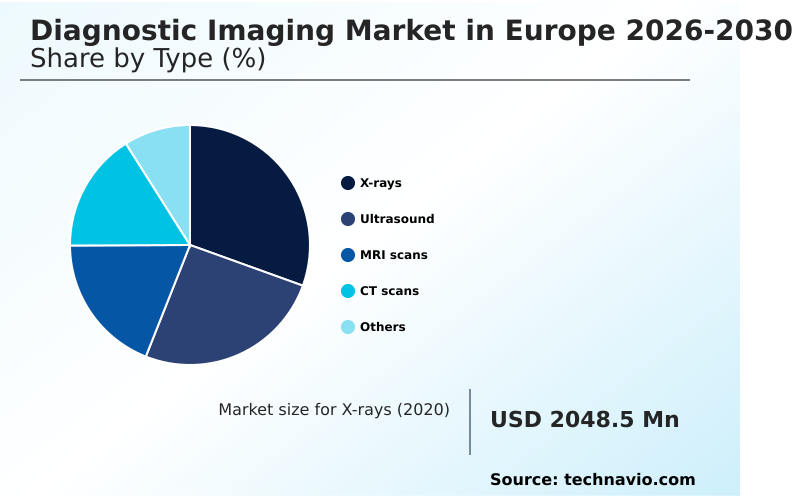
The x-rays segment is estimated to witness significant growth during the forecast period.

The X-rays segment of the Diagnostic Imaging landscape remains essential for initial clinical assessments. Providers leverage picture archiving and communication systems to ensure seamless data flow, directly improving diagnostic throughput across emergency environments.

The integration of advanced computational tools facilitates optimized patient workflow optimization while supporting early disease detection protocols. Clinical decision support tools embedded within the hardware guide technicians, leading to a 15% improvement in diagnostic accuracy compared to legacy analog setups.

Although magnetic resonance imaging and computed tomography dominate complex anatomical evaluations, standard radiography provides rapid structural insights.

Furthermore, modern equipment incorporates high field mri and photon counting ct capabilities at the enterprise level, bridging the gap toward deeper soft tissue characterization. These refinements optimize resource allocation, ensuring immediate, cost-effective structural evaluations for acute patient presentations.
Get Free Sample

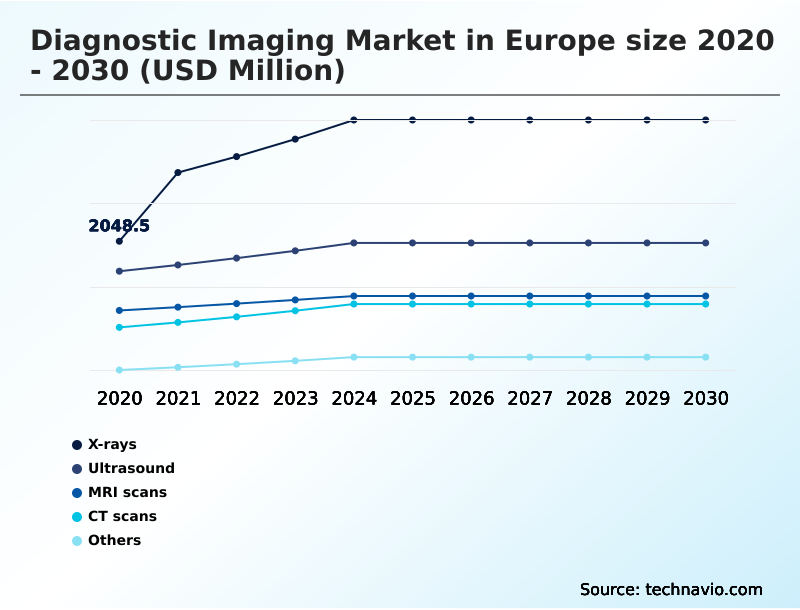
The X-rays segment was valued at USD 3.41 billion in 2024 and showed a gradual increase during the forecast period.
Get Free Sample

Market Dynamics

Our researchers analyzed the data with 2025 as the base year, along with the key drivers, trends, and challenges. A holistic analysis of drivers will help companies refine their marketing strategies to gain a competitive advantage.

  • The Diagnostic Imaging sector operates at the intersection of advanced hardware engineering and intelligent software integration. As clinical facilities manage unprecedented patient volumes, the demand for decentralized point of care diagnostic solutions has surged, enabling rapid triage in emergency and outpatient environments. These localized setups minimize patient transport risks while matching the throughput efficiency of centralized hospital departments.
  • Simultaneously, enterprise networks are transitioning toward interoperable cloud based imaging workflows, which reduce inter-facility data silos and allow multi-disciplinary teams to access critical patient scans instantaneously. This structural shift has improved remote consultation turnaround times by over 20% compared to legacy on-premise server models.
  • Clinical confidence is further bolstered by the integration of ai augmented radiological image reconstruction, which dramatically reduces image noise and enhances visual clarity without requiring increased radiation exposure. For complex pathologies, particularly in oncology and neurology, practitioners rely on high resolution soft tissue characterization to delineate tumor boundaries and assess metabolic responses accurately.
  • Complementing these structural assessments, the adoption of automated molecular imaging biomarker quantification provides objective, repeatable metrics that track disease progression over time. By unifying these advanced computational tools with versatile hardware, modern healthcare infrastructures ensure rapid, precise, and highly coordinated patient management, driving substantial operational efficiencies across the entire clinical continuum.
What are the key market drivers leading to the rise in the adoption of Europe Diagnostic Imaging Industry?

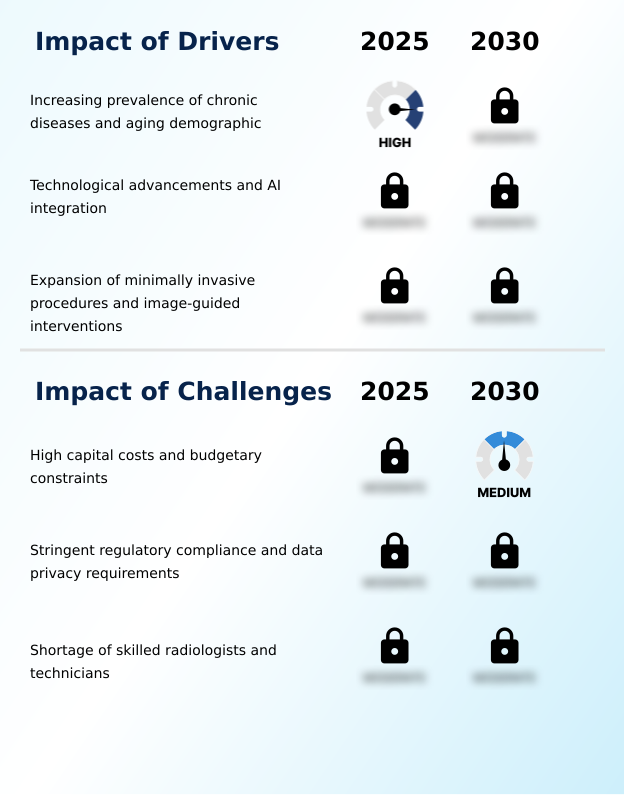
  • The increasing prevalence of chronic diseases and an aging demographic serve as the primary drivers accelerating market expansion.

  • Escalating clinical complexity serves as the primary catalyst propelling the Diagnostic Imaging ecosystem. The surging demand for image guided interventions necessitates the deployment of multi modal imaging platforms that provide instantaneous feedback.
  • By utilizing positron emission tomography alongside advanced contrast media, clinicians achieve superior lesion conspicuity enhancement, which is critical for multidisciplinary tumor boards making vital surgical decisions. This precision lowers exploratory procedural errors by 14%.
  • Furthermore, innovations in radiation dose modulation and volumetric image acquisition allow facilities to scan patients faster and safer, boosting daily throughput by 20%.
  • The adoption of weight bearing imaging and real time perfusion imaging ensures that structural and functional assessments are highly accurate, directly driving sustained capital investments across comprehensive healthcare networks.

What are the market trends shaping the Europe Diagnostic Imaging Industry?

  • Digital transformation and AI adoption represent the primary trends shaping current market dynamics. These technological shifts continuously enhance clinical workflows and diagnostic precision across the sector.

  • The integration of sophisticated digitalization defines current trends within the Diagnostic Imaging sector. Facilities are rapidly adopting dual energy ct and spectral ct to enhance spatial resolution, enabling deeper insights into complex pathologies. This shift toward molecular imaging is driven by the need for precise therapeutic targeting, which directly improves long-term patient recovery pathways.
  • The deployment of decentralized diagnostic care and point of care imaging has reduced critical triage delays by 18%. Furthermore, the transition toward enterprise level interoperability and cloud based image storage reduces data retrieval latency by over 22%, streamlining cross-departmental collaborations. By implementing digital radiography coupled with acoustic noise reduction technologies, clinics enhance patient comfort while maintaining high diagnostic yield.
  • These advancements collectively optimize operational flow and solidify the foundation for personalized, data-driven medical interventions.

What challenges does the Europe Diagnostic Imaging Industry face during its growth?

  • High capital costs and stringent budgetary constraints constitute major challenges limiting industry expansion.

  • Stringent operational and fiscal limitations severely constrain the Diagnostic Imaging landscape. Deploying iterative reconstruction and predictive anatomical analytics requires massive upfront capital, delaying equipment upgrades in underfunded regional hospitals. These budgetary deficits restrict the acquisition of advanced c arm fluoroscopy and intraoperative ultrasound systems, directly increasing surgical preparation times by 15%.
  • Additionally, navigating strict data privacy mandates complicates the implementation of remote diagnostic reporting, forcing administrative delays. Facilities struggle to balance the costs of upgrading portable digital radiography with the need for ambient noise reduction in premium suites.
  • The inability to consistently fund metal artifact suppression software and complex neurovascular health assessment tools reduces the overall diagnostic confidence, increasing secondary examination rates by 12% across resource-constrained clinical networks.

Exclusive Technavio Analysis on Customer Landscape

The europe diagnostic imaging market forecasting report includes the adoption lifecycle of the market, covering from the innovator’s stage to the laggard’s stage. It focuses on adoption rates in different regions based on penetration. Furthermore, the europe diagnostic imaging market report also includes key purchase criteria and drivers of price sensitivity to help companies evaluate and develop their market growth analysis strategies.
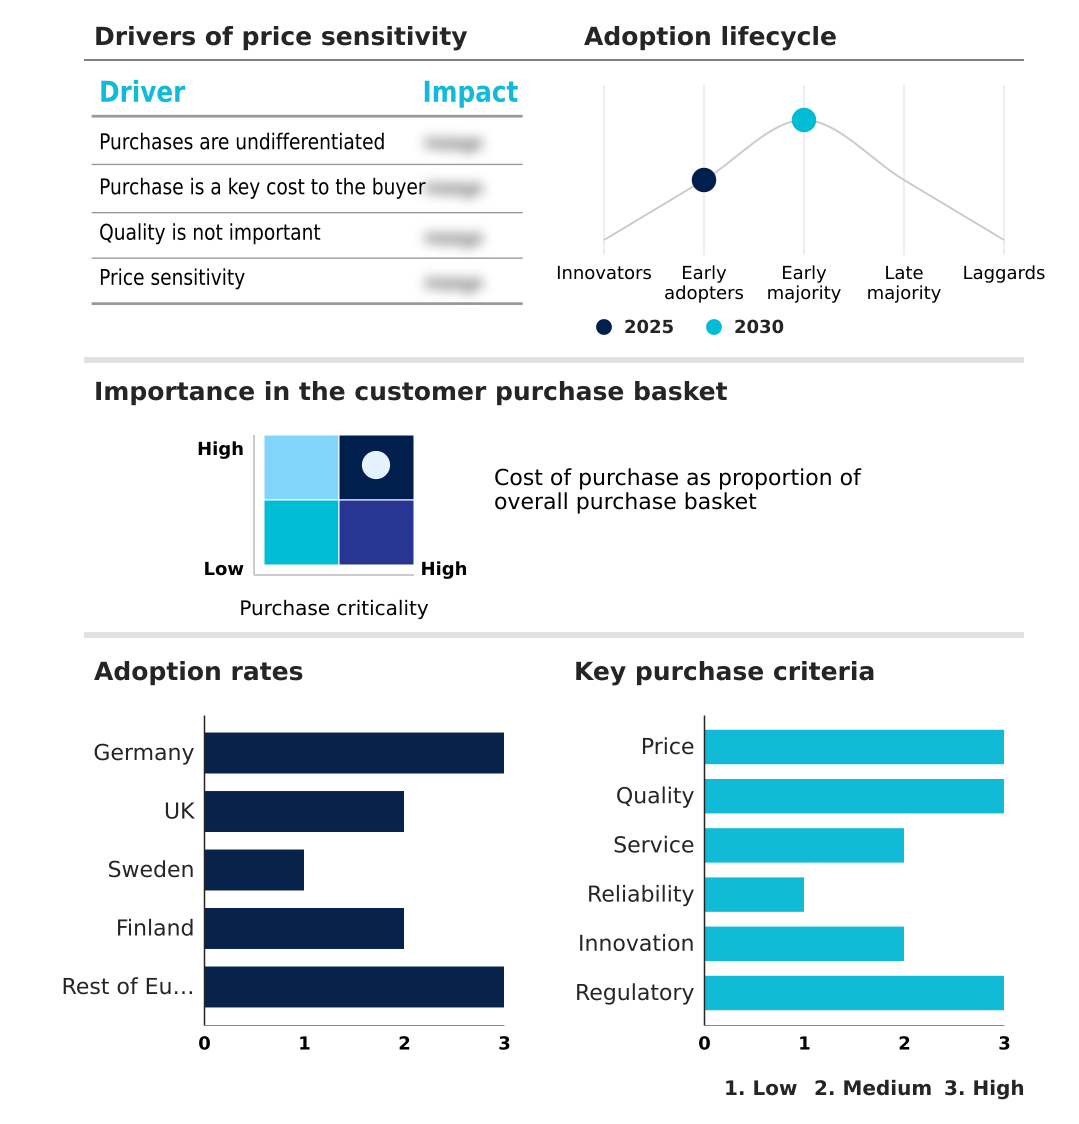
Customer Landscape of Europe Diagnostic Imaging Industry

Competitive Landscape

Companies are implementing various strategies, such as strategic alliances, europe diagnostic imaging market forecast, partnerships, mergers and acquisitions, geographical expansion, and product/service launches, to enhance their presence in the industry.

Arcoma AB - Provides advanced diagnostic imaging equipment, including comprehensive digital radiography platforms, high-resolution ultrasound machines, and intelligent medical image management software optimized for modern clinical and specialized surgical environments.

The industry research and growth report includes detailed analyses of the competitive landscape of the market and information about key companies, including:

  • Arcoma AB
  • BMI Biomedical International
  • Canon Inc.
  • Esaote SpA
  • FUJIFILM Holdings Corp.
  • GE HealthCare Technologies
  • Hologic Inc.
  • IME Group
  • Koninklijke Philips NV
  • Mediso Ltd.
  • OR Technology
  • Planmed Oy
  • PLH Medical Ltd.
  • Samsung Medison Co.Ltd.
  • Sedecal S.A.
  • Shanghai United Imaging
  • Shenzhen Mindray Co. Ltd.
  • Shimadzu Corp.
  • Siemens AG
  • SternMed GmbH
  • Technix Spa
  • Xograph Healthcare Ltd.

Qualitative and quantitative analysis of companies has been conducted to help clients understand the wider business environment as well as the strengths and weaknesses of key industry players. Data is qualitatively analyzed to categorize companies as pure play, category-focused, industry-focused, and diversified; it is quantitatively analyzed to categorize companies as dominant, leading, strong, tentative, and weak.

Recent Development and News in Europe diagnostic imaging market

  • In the Health Care Technology industry, the widespread adoption of AI-driven workflow interoperability standards has optimized enterprise resource planning, directly impacting Diagnostic Imaging demand by accelerating the deployment of connected multi-modal scanners across hospital networks.
  • In the Health Care Technology industry, stringent data privacy regulations like GDPR have mandated enhanced cybersecurity protocols for patient health information, directly impacting Diagnostic Imaging demand by forcing facilities to upgrade to secure cloud-based delivery models and encrypted image archiving systems.
  • In the Health Care Technology industry, the shift toward sustainable medical device manufacturing has introduced strict environmental compliance targets, directly impacting Diagnostic Imaging demand by driving the replacement of energy-intensive legacy scanners with eco-friendly systems.
  • In the Health Care Technology industry, the rapid expansion of enterprise automation software has streamlined administrative clinical tasks, directly impacting Diagnostic Imaging demand by increasing patient throughput capacity and necessitating high-speed automated image acquisition platforms.

Dive into Technavio’s robust research methodology, blending expert interviews, extensive data synthesis, and validated models for unparalleled Europe Diagnostic Imaging Market insights. See full methodology.

Market Scope
Page number 256
Base year 2025
Historic period 2020-2024
Forecast period 2026-2030
Growth momentum & CAGR Accelerate at a CAGR of 6%
Market growth 2026-2030 USD 3177.2 million
Market structure Fragmented
YoY growth 2025-2026(%) 5.8%
Key countries Germany, UK, Sweden, Finland and Rest of Europe
Competitive landscape Leading Companies, Market Positioning of Companies, Competitive Strategies, and Industry Risks

Request Free Sample

Research Analyst Overview

  • The Diagnostic Imaging sector stands as a critical pillar within modern healthcare infrastructure, characterized by continuous technological refinement and workflow integration. Executive boards increasingly prioritize the acquisition of intelligent visualization systems to ensure regulatory compliance and maximize departmental throughput.
  • By transitioning toward decentralized screening models, outpatient centers have achieved a 25% reduction in patient waiting times compared to traditional centralized hospital environments. This strategic shift directly influences capital budgeting decisions, prompting administrators to invest in modular, high-efficiency scanners over bulk legacy hardware.
  • The integration of intelligent diagnostic software reduces repetitive administrative burdens, empowering radiological staff to focus on complex, high-acuity interpretations. Furthermore, the emphasis on preventative medicine demands equipment capable of identifying subtle pathological anomalies long before overt symptoms manifest.
  • As health policies continue to advocate for early intervention and value-based care, the continuous deployment of sophisticated anatomical imaging tools remains a non-negotiable operational imperative. Facilities that align their procurement strategies with these evolving clinical standards consistently demonstrate superior diagnostic yield and enhanced overall patient management.

What are the Key Data Covered in this Europe Diagnostic Imaging Market Research and Growth Report?

  • What is the expected growth of the Europe Diagnostic Imaging Market between 2026 and 2030?

    • USD 3.18 billion, at a CAGR of 6%

  • What segmentation does the market report cover?

    • The report is segmented by Type (X-rays, Ultrasound, MRI scans, CT scans, and Others), Application (Cardiology, Oncology, Orthopedics, Neurology, and Others), End-user (Hospital, Diagnostic and imaging centers, Specialty clinics, and ASCs), Technology (Two dimensional imaging, Three dimensional and four dimensional imaging, and AI-based imaging) and Geography (Europe)

  • Which regions are analyzed in the report?

    • Europe

  • What are the key growth drivers and market challenges?

    • Increasing prevalence of chronic diseases and aging demographic, High capital costs and budgetary constraints

  • Who are the major players in the Europe Diagnostic Imaging Market?

    • Arcoma AB, BMI Biomedical International, Canon Inc., Esaote SpA, FUJIFILM Holdings Corp., GE HealthCare Technologies, Hologic Inc., IME Group, Koninklijke Philips NV, Mediso Ltd., OR Technology, Planmed Oy, PLH Medical Ltd., Samsung Medison Co.Ltd., Sedecal S.A., Shanghai United Imaging, Shenzhen Mindray Co. Ltd., Shimadzu Corp., Siemens AG, SternMed GmbH, Technix Spa and Xograph Healthcare Ltd.

Market Research Insights

  • The Diagnostic Imaging ecosystem requires continuous modernization to address escalating clinical demands and complex patient demographics. Facilities implementing automated lesion detection algorithms report a 22% reduction in false-positive diagnostic interpretations, streamlining subsequent clinical pathways. Furthermore, integrating cloud based image storage reduces localized server maintenance costs by over 18%, freeing capital for direct patient care initiatives.
  • These systemic improvements empower physicians with advanced clinical decision support, translating complex visual data into actionable therapeutic strategies. By emphasizing decentralized diagnostic care, regional health authorities have decreased acute emergency room congestion by 14%, routing routine assessments to specialized outpatient centers.
  • This strategic evolution ensures that high-fidelity anatomical evaluation remains highly accessible, efficient, and deeply embedded within modern preventative health protocols.

We can help! Our analysts can customize this europe diagnostic imaging market research report to meet your requirements.

Get in touch

1. Executive Summary

1.1 Market overview

Executive Summary - Chart on Market Overview
Executive Summary - Data Table on Market Overview
Executive Summary - Chart on Country Market Characteristics
Executive Summary - Chart on Market by Geography
Executive Summary - Chart on Market Segmentation by Type
Executive Summary - Chart on Market Segmentation by Application
Executive Summary - Chart on Market Segmentation by End-user
Executive Summary - Chart on Market Segmentation by Technology
Executive Summary - Chart on Incremental Growth
Executive Summary - Data Table on Incremental Growth
Executive Summary - Chart on Company Market Positioning

2. Technavio Analysis

2.1 Analysis of price sensitivity, lifecycle, customer purchase basket, adoption rates, and purchase criteria

2.2 Criticality of inputs and Factors of differentiation

Overview on criticality of inputs and factors of differentiation

2.3 Factors of disruption

Overview on factors of disruption

2.4 Impact of drivers and challenges

Impact of drivers and challenges in 2025 and 2030

3. Market Landscape

3.1 Market ecosystem

Chart on Parent Market
Data Table on - Parent Market

3.2 Market characteristics

Chart on Market characteristics analysis

3.3 Value chain analysis

Chart on Value chain analysis

4. Market Sizing

4.1 Market definition

Data Table on Offerings of companies included in the market definition

4.2 Market segment analysis

Market segments

4.3 Market size 2025

4.4 Market outlook: Forecast for 2025-2030

Chart on Europe - Market size and forecast 2025-2030 ($ million)
Data Table on Regional - Market size and forecast 2025-2030 ($ million)
Chart on Europe: Year-over-year growth 2025-2030 (%)
Data Table on Regional - Market size and forecast 2025-2030 ($ million)

5. Historic Market Size

5.1 Diagnostic Imaging Market in Europe 2020 - 2024

Historic Market Size - Data Table on Diagnostic Imaging Market in Europe 2020 - 2024 ($ million)

5.2 Type segment analysis 2020 - 2024

Historic Market Size - Type Segment 2020 - 2024 ($ million)

5.3 Application segment analysis 2020 - 2024

Historic Market Size - Application Segment 2020 - 2024 ($ million)

5.4 End-user segment analysis 2020 - 2024

Historic Market Size - End-user Segment 2020 - 2024 ($ million)

5.5 Technology segment analysis 2020 - 2024

Historic Market Size - Technology Segment 2020 - 2024 ($ million)

5.6 Geography segment analysis 2020 - 2024

Historic Market Size - Geography Segment 2020 - 2024 ($ million)

6. Qualitative Analysis

6.1 Impact of AI on diagnostic imaging market in Europe

6.2 Impact of geopolitical conflicts on diagnostic imaging market in Europe

7. Five Forces Analysis

7.1 Five forces summary

Five forces analysis - Comparison between 2025 and 2030

7.2 Bargaining power of buyers

Bargaining power of buyers - Impact of key factors 2025 and 2030

7.3 Bargaining power of suppliers

Bargaining power of suppliers - Impact of key factors in 2025 and 2030

7.4 Threat of new entrants

Threat of new entrants - Impact of key factors in 2025 and 2030

7.5 Threat of substitutes

Threat of substitutes - Impact of key factors in 2025 and 2030

7.6 Threat of rivalry

Threat of rivalry - Impact of key factors in 2025 and 2030

7.7 Market condition

Chart on Market condition - Five forces 2025 and 2030

8. Market Segmentation by Type

8.1 Market segments

Chart on Type - Market share 2025-2030 (%)
Data Table on Type - Market share 2025-2030 (%)

8.2 Comparison by Type

Chart on Comparison by Type
Data Table on Comparison by Type

8.3 X-rays - Market size and forecast 2025-2030

Chart on X-rays - Market size and forecast 2025-2030 ($ million)
Data Table on X-rays - Market size and forecast 2025-2030 ($ million)
Chart on X-rays - Year-over-year growth 2025-2030 (%)
Data Table on X-rays - Year-over-year growth 2025-2030 (%)

8.4 Ultrasound - Market size and forecast 2025-2030

Chart on Ultrasound - Market size and forecast 2025-2030 ($ million)
Data Table on Ultrasound - Market size and forecast 2025-2030 ($ million)
Chart on Ultrasound - Year-over-year growth 2025-2030 (%)
Data Table on Ultrasound - Year-over-year growth 2025-2030 (%)

8.5 MRI scans - Market size and forecast 2025-2030

Chart on MRI scans - Market size and forecast 2025-2030 ($ million)
Data Table on MRI scans - Market size and forecast 2025-2030 ($ million)
Chart on MRI scans - Year-over-year growth 2025-2030 (%)
Data Table on MRI scans - Year-over-year growth 2025-2030 (%)

8.6 CT scans - Market size and forecast 2025-2030

Chart on CT scans - Market size and forecast 2025-2030 ($ million)
Data Table on CT scans - Market size and forecast 2025-2030 ($ million)
Chart on CT scans - Year-over-year growth 2025-2030 (%)
Data Table on CT scans - Year-over-year growth 2025-2030 (%)

8.7 Others - Market size and forecast 2025-2030

Chart on Others - Market size and forecast 2025-2030 ($ million)
Data Table on Others - Market size and forecast 2025-2030 ($ million)
Chart on Others - Year-over-year growth 2025-2030 (%)
Data Table on Others - Year-over-year growth 2025-2030 (%)

8.8 Market opportunity by Type

Market opportunity by Type ($ million)
Data Table on Market opportunity by Type ($ million)

9. Market Segmentation by Application

9.1 Market segments

Chart on Application - Market share 2025-2030 (%)
Data Table on Application - Market share 2025-2030 (%)

9.2 Comparison by Application

Chart on Comparison by Application
Data Table on Comparison by Application

9.3 Cardiology - Market size and forecast 2025-2030

Chart on Cardiology - Market size and forecast 2025-2030 ($ million)
Data Table on Cardiology - Market size and forecast 2025-2030 ($ million)
Chart on Cardiology - Year-over-year growth 2025-2030 (%)
Data Table on Cardiology - Year-over-year growth 2025-2030 (%)

9.4 Oncology - Market size and forecast 2025-2030

Chart on Oncology - Market size and forecast 2025-2030 ($ million)
Data Table on Oncology - Market size and forecast 2025-2030 ($ million)
Chart on Oncology - Year-over-year growth 2025-2030 (%)
Data Table on Oncology - Year-over-year growth 2025-2030 (%)

9.5 Orthopedics - Market size and forecast 2025-2030

Chart on Orthopedics - Market size and forecast 2025-2030 ($ million)
Data Table on Orthopedics - Market size and forecast 2025-2030 ($ million)
Chart on Orthopedics - Year-over-year growth 2025-2030 (%)
Data Table on Orthopedics - Year-over-year growth 2025-2030 (%)

9.6 Neurology - Market size and forecast 2025-2030

Chart on Neurology - Market size and forecast 2025-2030 ($ million)
Data Table on Neurology - Market size and forecast 2025-2030 ($ million)
Chart on Neurology - Year-over-year growth 2025-2030 (%)
Data Table on Neurology - Year-over-year growth 2025-2030 (%)

9.7 Others - Market size and forecast 2025-2030

Chart on Others - Market size and forecast 2025-2030 ($ million)
Data Table on Others - Market size and forecast 2025-2030 ($ million)
Chart on Others - Year-over-year growth 2025-2030 (%)
Data Table on Others - Year-over-year growth 2025-2030 (%)

9.8 Market opportunity by Application

Market opportunity by Application ($ million)
Data Table on Market opportunity by Application ($ million)

10. Market Segmentation by End-user

10.1 Market segments

Chart on End-user - Market share 2025-2030 (%)
Data Table on End-user - Market share 2025-2030 (%)

10.2 Comparison by End-user

Chart on Comparison by End-user
Data Table on Comparison by End-user

10.3 Hospital - Market size and forecast 2025-2030

Chart on Hospital - Market size and forecast 2025-2030 ($ million)
Data Table on Hospital - Market size and forecast 2025-2030 ($ million)
Chart on Hospital - Year-over-year growth 2025-2030 (%)
Data Table on Hospital - Year-over-year growth 2025-2030 (%)

10.4 Diagnostic and imaging centers - Market size and forecast 2025-2030

Chart on Diagnostic and imaging centers - Market size and forecast 2025-2030 ($ million)
Data Table on Diagnostic and imaging centers - Market size and forecast 2025-2030 ($ million)
Chart on Diagnostic and imaging centers - Year-over-year growth 2025-2030 (%)
Data Table on Diagnostic and imaging centers - Year-over-year growth 2025-2030 (%)

10.5 Specialty clinics - Market size and forecast 2025-2030

Chart on Specialty clinics - Market size and forecast 2025-2030 ($ million)
Data Table on Specialty clinics - Market size and forecast 2025-2030 ($ million)
Chart on Specialty clinics - Year-over-year growth 2025-2030 (%)
Data Table on Specialty clinics - Year-over-year growth 2025-2030 (%)

10.6 ASCs - Market size and forecast 2025-2030

Chart on ASCs - Market size and forecast 2025-2030 ($ million)
Data Table on ASCs - Market size and forecast 2025-2030 ($ million)
Chart on ASCs - Year-over-year growth 2025-2030 (%)
Data Table on ASCs - Year-over-year growth 2025-2030 (%)

10.7 Market opportunity by End-user

Market opportunity by End-user ($ million)
Data Table on Market opportunity by End-user ($ million)

11. Market Segmentation by Technology

11.1 Market segments

Chart on Technology - Market share 2025-2030 (%)
Data Table on Technology - Market share 2025-2030 (%)

11.2 Comparison by Technology

Chart on Comparison by Technology
Data Table on Comparison by Technology

11.3 Two dimensional imaging - Market size and forecast 2025-2030

Chart on Two dimensional imaging - Market size and forecast 2025-2030 ($ million)
Data Table on Two dimensional imaging - Market size and forecast 2025-2030 ($ million)
Chart on Two dimensional imaging - Year-over-year growth 2025-2030 (%)
Data Table on Two dimensional imaging - Year-over-year growth 2025-2030 (%)

11.4 Three dimensional and four dimensional imaging - Market size and forecast 2025-2030

Chart on Three dimensional and four dimensional imaging - Market size and forecast 2025-2030 ($ million)
Data Table on Three dimensional and four dimensional imaging - Market size and forecast 2025-2030 ($ million)
Chart on Three dimensional and four dimensional imaging - Year-over-year growth 2025-2030 (%)
Data Table on Three dimensional and four dimensional imaging - Year-over-year growth 2025-2030 (%)

11.5 AI-based imaging - Market size and forecast 2025-2030

Chart on AI-based imaging - Market size and forecast 2025-2030 ($ million)
Data Table on AI-based imaging - Market size and forecast 2025-2030 ($ million)
Chart on AI-based imaging - Year-over-year growth 2025-2030 (%)
Data Table on AI-based imaging - Year-over-year growth 2025-2030 (%)

11.6 Market opportunity by Technology

Market opportunity by Technology ($ million)
Data Table on Market opportunity by Technology ($ million)

12. Customer Landscape

12.1 Customer landscape overview

Analysis of price sensitivity, lifecycle, customer purchase basket, adoption rates, and purchase criteria

13. Geographic Landscape

13.1 Geographic segmentation

Chart on Market share by geography - 2025-2030 (%)
Data Table on Market share by geography - 2025-2030 (%)

13.2 Geographic comparison

Chart on Geographic comparison
Data Table on Geographic comparison

13.3 Germany - Market size and forecast 2025-2030

Chart on Germany - Market size and forecast 2025-2030 ($ million)
Data Table on Germany - Market size and forecast 2025-2030 ($ million)
Chart on Germany - Year-over-year growth 2025-2030 (%)
Data Table on Germany - Year-over-year growth 2025-2030 (%)

13.4 UK - Market size and forecast 2025-2030

Chart on UK - Market size and forecast 2025-2030 ($ million)
Data Table on UK - Market size and forecast 2025-2030 ($ million)
Chart on UK - Year-over-year growth 2025-2030 (%)
Data Table on UK - Year-over-year growth 2025-2030 (%)

13.5 Sweden - Market size and forecast 2025-2030

Chart on Sweden - Market size and forecast 2025-2030 ($ million)
Data Table on Sweden - Market size and forecast 2025-2030 ($ million)
Chart on Sweden - Year-over-year growth 2025-2030 (%)
Data Table on Sweden - Year-over-year growth 2025-2030 (%)

13.6 Finland - Market size and forecast 2025-2030

Chart on Finland - Market size and forecast 2025-2030 ($ million)
Data Table on Finland - Market size and forecast 2025-2030 ($ million)
Chart on Finland - Year-over-year growth 2025-2030 (%)
Data Table on Finland - Year-over-year growth 2025-2030 (%)

13.7 Rest of Europe - Market size and forecast 2025-2030

Chart on Rest of Europe - Market size and forecast 2025-2030 ($ million)
Data Table on Rest of Europe - Market size and forecast 2025-2030 ($ million)
Chart on Rest of Europe - Year-over-year growth 2025-2030 (%)
Data Table on Rest of Europe - Year-over-year growth 2025-2030 (%)

13.8 Market opportunity by geography

Market opportunity by geography ($ million)
Data Table on Market opportunity by geography ($ million)

14. Drivers, Challenges, and Opportunity

14.1 Market drivers

Increasing prevalence of chronic diseases and aging demographic
Technological advancements and AI integration
Expansion of minimally invasive procedures and image-guided interventions

14.2 Market challenges

High capital costs and budgetary constraints
Stringent regulatory compliance and data privacy requirements
Shortage of skilled radiologists and technicians

14.3 Impact of drivers and challenges

Impact of drivers and challenges in 2025 and 2030

14.4 Market opportunities

Digital transformation and AI adoption
Advancements in precision and molecular imaging
Shift toward decentralized and point-of-care diagnostics

15. Competitive Landscape

15.1 Overview

15.2

Overview on criticality of inputs and factors of differentiation

15.3 Landscape disruption

Overview on factors of disruption

15.4 Industry risks

Impact of key risks on business

16. Competitive Analysis

16.1 Companies profiled

Companies covered

16.2 Company ranking index

16.3 Market positioning of companies

Matrix on companies position and classification

16.4 Arcoma AB

Arcoma AB - Overview
Arcoma AB - Product / Service
Arcoma AB - Key offerings
SWOT

16.5 BMI Biomedical International

BMI Biomedical International - Overview
BMI Biomedical International - Product / Service
BMI Biomedical International - Key offerings
SWOT

16.6 Canon Inc.

Canon Inc. - Overview
Canon Inc. - Business segments
Canon Inc. - Key news
Canon Inc. - Key offerings
Canon Inc. - Segment focus
SWOT

16.7 Esaote SpA

Esaote SpA - Overview
Esaote SpA - Product / Service
Esaote SpA - Key offerings
SWOT

16.8 FUJIFILM Holdings Corp.

FUJIFILM Holdings Corp. - Overview
FUJIFILM Holdings Corp. - Business segments
FUJIFILM Holdings Corp. - Key news
FUJIFILM Holdings Corp. - Key offerings
FUJIFILM Holdings Corp. - Segment focus
SWOT

16.9 GE HealthCare Technologies

GE HealthCare Technologies - Overview
GE HealthCare Technologies - Business segments
GE HealthCare Technologies - Key news
GE HealthCare Technologies - Key offerings
GE HealthCare Technologies - Segment focus
SWOT

16.10 Hologic Inc.

Hologic Inc. - Overview
Hologic Inc. - Product / Service
Hologic Inc. - Key offerings
SWOT

16.11 IME Group

IME Group - Overview
IME Group - Product / Service
IME Group - Key offerings
SWOT

16.12 Koninklijke Philips NV

Koninklijke Philips NV - Overview
Koninklijke Philips NV - Business segments
Koninklijke Philips NV - Key news
Koninklijke Philips NV - Key offerings
Koninklijke Philips NV - Segment focus
SWOT

16.13 Mediso Ltd.

Mediso Ltd. - Overview
Mediso Ltd. - Product / Service
Mediso Ltd. - Key offerings
SWOT

16.14 OR Technology

OR Technology - Overview
OR Technology - Product / Service
OR Technology - Key offerings
SWOT

16.15 Shanghai United Imaging

Shanghai United Imaging - Overview
Shanghai United Imaging - Product / Service
Shanghai United Imaging - Key offerings
SWOT

16.16 Shenzhen Mindray Co. Ltd.

Shenzhen Mindray Co. Ltd. - Overview
Shenzhen Mindray Co. Ltd. - Business segments
Shenzhen Mindray Co. Ltd. - Key offerings
Shenzhen Mindray Co. Ltd. - Segment focus
SWOT

16.17 Shimadzu Corp.

Shimadzu Corp. - Overview
Shimadzu Corp. - Business segments
Shimadzu Corp. - Key offerings
Shimadzu Corp. - Segment focus
SWOT

16.18 Siemens AG

Siemens AG - Overview
Siemens AG - Business segments
Siemens AG - Key news
Siemens AG - Key offerings
Siemens AG - Segment focus
SWOT

17. Appendix

17.1 Scope of the report

Market definition
Objectives
Notes and caveats

17.2 Inclusions and exclusions checklist

Inclusions checklist
Exclusions checklist

17.3 Currency conversion rates for US$

17.4 Research methodology

17.5 Data procurement

Information sources

17.6 Data validation

17.7 Validation techniques employed for market sizing

17.8 Data synthesis

17.9 360 degree market analysis

17.10 List of abbreviations

Research Methodology

Technavio presents a detailed picture of the market by way of study, synthesis, and summation of data from multiple sources. The analysts have presented the various facets of the market with a particular focus on identifying the key industry influencers. The data thus presented is comprehensive, reliable, and the result of extensive research, both primary and secondary.

INFORMATION SOURCES

Primary sources

  • Manufacturers and suppliers
  • Channel partners
  • Industry experts
  • Strategic decision makers

Secondary sources

  • Industry journals and periodicals
  • Government data
  • Financial reports of key industry players
  • Historical data
  • Press releases

DATA ANALYSIS

Data Synthesis

  • Collation of data
  • Estimation of key figures
  • Analysis of derived insights

Data Validation

  • Triangulation with data models
  • Reference against proprietary databases
  • Corroboration with industry experts

REPORT WRITING

Qualitative

  • Market drivers
  • Market challenges
  • Market trends
  • Five forces analysis

Quantitative

  • Market size and forecast
  • Market segmentation
  • Geographical insights
  • Competitive landscape

Interested in this report?

Get your sample now to see our research methodology and insights!

Download Now

Frequently Asked Questions

Europe Diagnostic Imaging market growth will increase by USD 3177.2 million during 2026-2030.

The Europe Diagnostic Imaging market is expected to grow at a CAGR of 6% during 2026-2030.

Europe Diagnostic Imaging market is segmented by Type (X-rays, Ultrasound, MRI scans, CT scans, Others) Application (Cardiology, Oncology, Orthopedics, Neurology, Others) End-user (Hospital, Diagnostic and imaging centers, Specialty clinics, ASCs) Technology (Two dimensional imaging, Three dimensional and four dimensional imaging, AI-based imaging)

Arcoma AB, BMI Biomedical International, Canon Inc., Esaote SpA, FUJIFILM Holdings Corp., GE HealthCare Technologies, Hologic Inc., IME Group, Koninklijke Philips NV, Mediso Ltd., OR Technology, Planmed Oy, PLH Medical Ltd., Samsung Medison Co.Ltd., Sedecal S.A., Shanghai United Imaging, Shenzhen Mindray Co. Ltd., Shimadzu Corp., Siemens AG, SternMed GmbH, Technix Spa, Xograph Healthcare Ltd. are a few of the key vendors in the Europe Diagnostic Imaging market.

Europe will register the highest growth rate of 100% among the other regions. Therefore, the Europe Diagnostic Imaging market in Europe is expected to garner significant business opportunities for the vendors during the forecast period.

Germany, UK, Sweden, Finland, Rest of Europe

  • Increasing prevalence of chronic diseases and aging demographic is the driving factor this market.

The Europe Diagnostic Imaging market vendors should focus on grabbing business opportunities from the Type segment as it accounted for the largest market share in the base year.
RIA - Research AI Assistant
Ask RIA
