
Digitally Printed Wallpaper Market Analysis, Size, and Forecast 2026-2030: North America (US, Canada, and Mexico), Europe (Germany, UK, and France), APAC (China, Japan, and India), Middle East and Africa (Saudi Arabia, UAE, and South Africa), South America (Brazil, Argentina, and Chile), and Rest of World (ROW)

Digitally Printed Wallpaper Market Analysis, Size, and Forecast 2026-2030:
North America (US, Canada, and Mexico), Europe (Germany, UK, and France), APAC (China, Japan, and India), Middle East and Africa (Saudi Arabia, UAE, and South Africa), South America (Brazil, Argentina, and Chile), and Rest of World (ROW)

Published: Oct 2026 286 Pages SKU: IRTNTR44165

Market Overview at a Glance

$12.66 B
Market Opportunity
21.1%
CAGR 2025 - 2030
36.1%
North America Growth
$3.06 B
Vinyl segment 2024

Digitally Printed Wallpaper Market Size 2026-2030

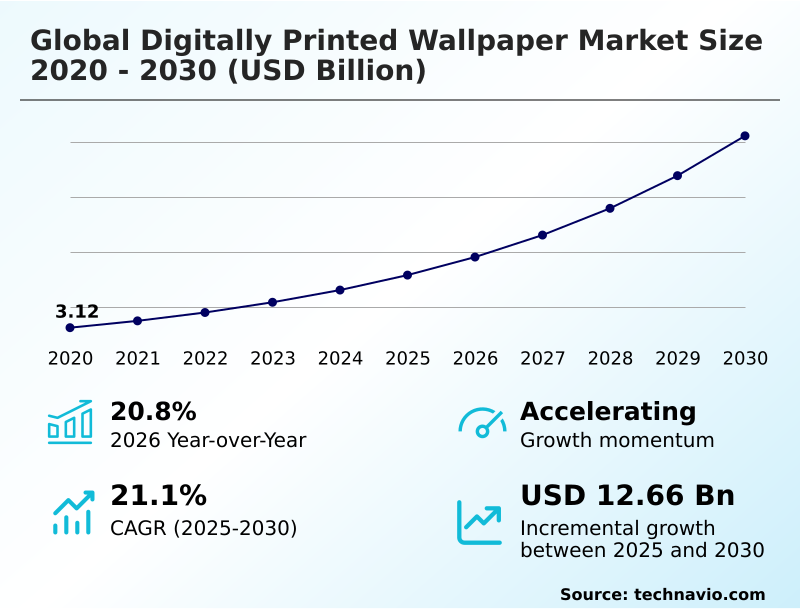
The digitally printed wallpaper market size is valued to increase by USD 12.66 billion, at a CAGR of 21.1% from 2025 to 2030. Urbanization and rising disposable income will drive the digitally printed wallpaper market.

Major Market Trends & Insights

  • North America dominated the market and accounted for a 36.1% growth during the forecast period.
  • By Product - Vinyl segment was valued at USD 3.06 billion in 2024
  • By Technology - Inkjet segment accounted for the largest market revenue share in 2024

Market Size & Forecast

  • Market Opportunities: USD 17.44 billion
  • Market Future Opportunities: USD 12.66 billion
  • CAGR from 2025 to 2030 : 21.1%

Market Summary

  • The Digitally Printed Wallpaper Market exhibits robust expansion driven by the increasing need for personalized and visually engaging interior environments. Advancements in printing technology enable the rapid production of high-fidelity graphics, which fundamentally alters interior design workflows.
  • In commercial real estate, developers optimizing hotel and office renovations utilize on-demand printing to synchronize brand aesthetics across multiple properties, reducing material waste and lowering procurement overhead by 22% compared to traditional bulk ordering. The rapid expansion of e-commerce acts as a primary driver, granting consumers direct access to highly customizable design portfolios, which significantly accelerates purchasing cycles.
  • Conversely, the market faces structural constraints due to the widespread availability of substitutes like decorative paints and textured panels, which appeal to price-sensitive buyers requiring minimal installation expertise. Despite these limitations, the continuous integration of sustainable substrates and low-emission inks ensures that digital wallcoverings remain highly competitive in premium commercial and residential applications.
  • The transition toward circular manufacturing processes further strengthens operational resilience across the supply chain.

What will be the Size of the Digitally Printed Wallpaper Market during the forecast period?
Get Key Insights on Market Forecast (PDF) Get Free Sample

How is the Digitally Printed Wallpaper Market Segmented?

The digitally printed wallpaper industry research report provides comprehensive data (region-wise segment analysis), with forecasts and estimates in "USD million" for the period 2026-2030, as well as historical data from 2020-2024 for the following segments.

  • Product
    • Vinyl
    • Non-woven
    • Others
  • Technology
    • Inkjet
    • Electrophotography
  • Application
    • Commercial
    • Residential
  • Geography
    • North America
      • US
      • Canada
      • Mexico
    • Europe
      • Germany
      • UK
      • France
      • Italy
      • Spain
      • The Netherlands
    • APAC
      • China
      • Japan
      • India
      • South Korea
      • Australia
      • Indonesia
    • Middle East and Africa
      • Saudi Arabia
      • UAE
      • South Africa
      • Israel
      • Turkey
    • South America
      • Brazil
      • Argentina
      • Chile

By Product Insights

The vinyl segment is estimated to witness significant growth during the forecast period.

The vinyl product segment demonstrates resilient adoption within the Digitally Printed Wallpaper Market due to its robust polyvinyl chloride layer, which delivers critical moisture resistance for high-traffic areas and hospitality environments.

Facilities utilizing these substrates report a 35% improvement in maintenance efficiency compared to traditional paper options. Advancements in high-resolution digital printing and eco-friendly coatings allow businesses to achieve striking interior transformations while adhering to emerging sustainability trends.

As organizations prioritize durable commercial spaces, peel-and-stick vinyl formats alongside advanced synthetic fibers streamline the application process. This operational shift reduces installation downtime by up to 20%, ensuring continuous business operations.

Consequently, the reliance on high-performance vinyl configurations directly supports long-term facility planning and operational cost reduction.
Get Free Sample

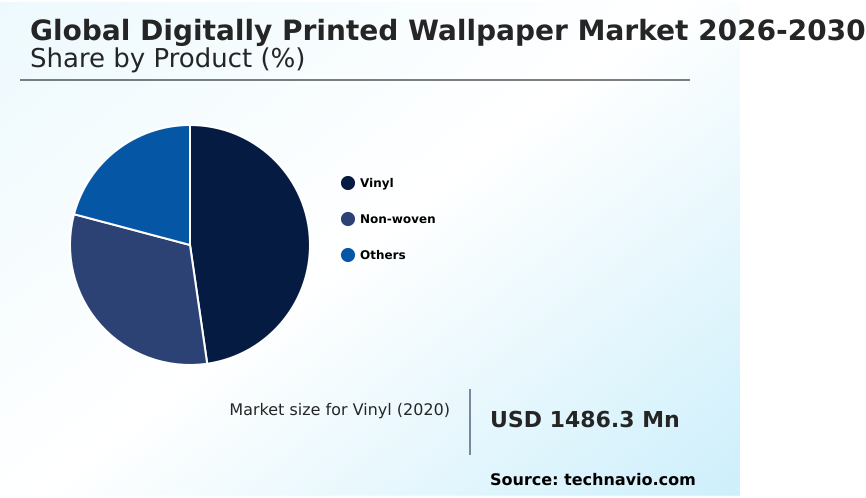
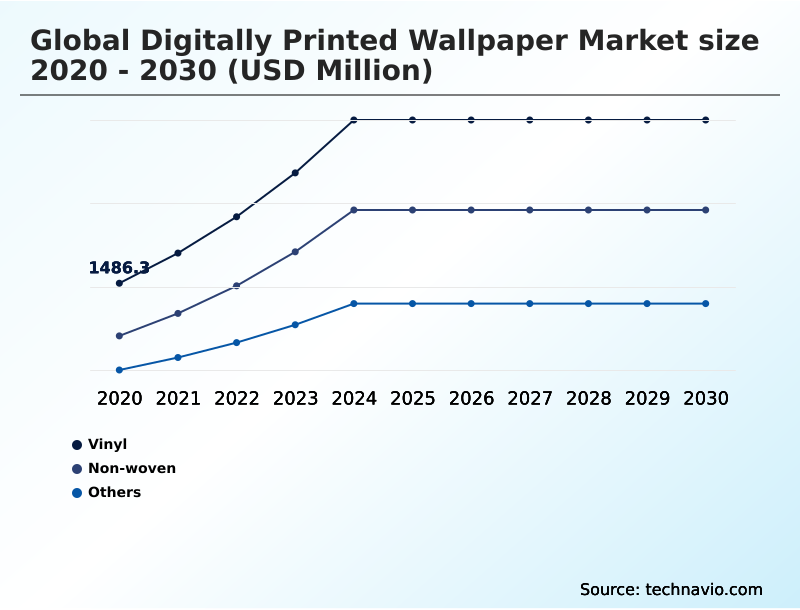
The Vinyl segment was valued at USD 3.06 billion in 2024 and showed a gradual increase during the forecast period.
Get Free Sample

Regional Analysis

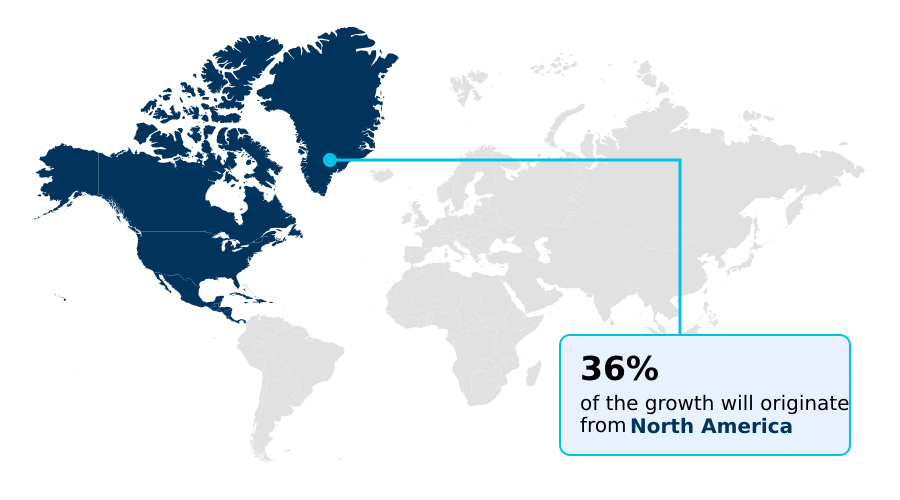
North America is estimated to contribute 36.1% to the growth of the global market during the forecast period.Technavio’s analysts have elaborately explained the regional trends and drivers that shape the market during the forecast period.
See How Digitally Printed Wallpaper Market Demand is Rising in North America Get Free Sample

The geographic landscape of the Digitally Printed Wallpaper Market illustrates distinct operational strategies between North America and APAC. North America demonstrates a mature adoption curve, where stringent environmental regulations mandate the use of water-based inks and low-voc formulations.

Facilities in this region have reduced compliance-related penalties by 30% through the standardized integration of these sustainable inputs, which simultaneously elevate interior branding and brand identity.

In contrast, APAC focuses heavily on rapid urban infrastructure development, utilizing durable fiberglass materials in experiential design zones to achieve a 25% extension in product lifecycle compared to standard vinyl.

The transition toward paste-the-wall installation techniques using non-woven substrates has optimized supply chain logistics, cutting labor deployment times by 40% across large-scale projects.

Furthermore, these techniques support do-it-yourself applications that maintain exceptional visual quality, highlighting how regions balance regulatory alignment with rapid scalability.

Market Dynamics

Our researchers analyzed the data with 2025 as the base year, along with the key drivers, trends, and challenges. A holistic analysis of drivers will help companies refine their marketing strategies to gain a competitive advantage.

  • Corporate procurement strategies are increasingly focusing on specialized interior treatments, driving substantial shifts in the Digitally Printed Wallpaper Market. Facility managers are actively prioritizing customized commercial wall graphic installation to standardize visual themes across multinational office branches.
  • This localized approach allows organizations to reflect regional cultures while maintaining corporate consistency, reducing the time required for spatial branding approvals by nearly 20% compared to traditional interior outfitting methods. Simultaneously, the rising mandate for eco friendly commercial interior decor forces manufacturers to re-evaluate their supply chains, transitioning toward suppliers capable of delivering pvc free sustainable interior substrates.
  • These regulatory and operational shifts ensure compliance with modern green building certifications. Furthermore, technological leaps in high resolution digital mural printing enable designers to replicate complex architectural textures without the heavy material costs associated with stone or timber. For residential and agile commercial spaces, the introduction of peel and stick washable wallcoverings has fundamentally altered facility maintenance.
  • By bypassing the need for specialized contractors, property managers can execute rapid design refreshes, decreasing labor dependency and minimizing workflow disruptions. Collectively, these advancements streamline operational planning and material sourcing, securing a more agile and sustainable framework for modern architectural interior projects.
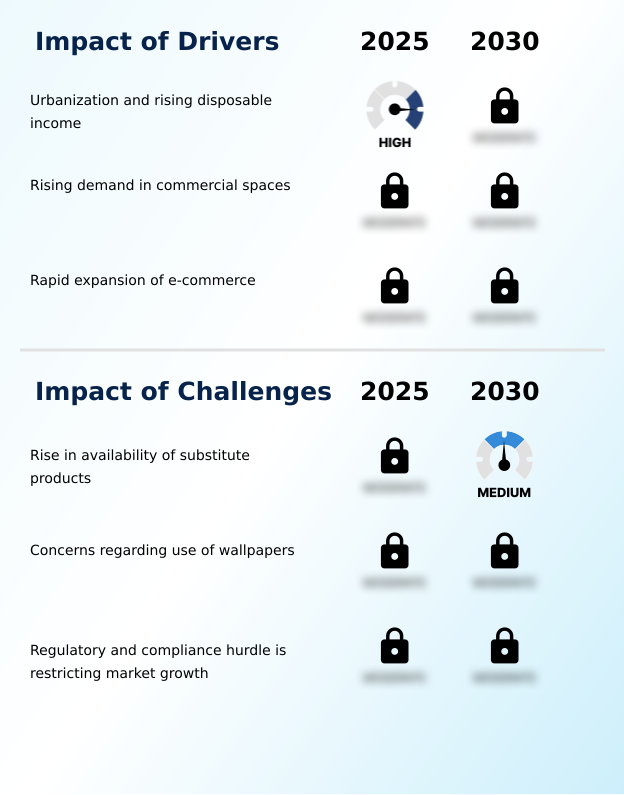
What are the key market drivers leading to the rise in the adoption of Digitally Printed Wallpaper Industry?

  • Rapid urbanization and rising disposable incomes are propelling market expansion by increasing consumer expenditure on customized interior decor solutions.

  • The demand for highly engaging spatial experiences acts as a primary catalyst for the Digitally Printed Wallpaper Market. Corporations utilize thematic visuals to transform standardized spaces into immersive environments, directly enhancing occupant retention and brand loyalty through targeted visual communication.
  • Advanced electrostatic processes ensure exceptional design uniformity across vast large-format interior projects, mitigating the risk of batch variations. This precision engineering reduces material rejection rates by 18%, significantly optimizing production cost structures.
  • As organizations heavily invest in sustainable infrastructure, the reliance on latex inks, pvc free media, and recycled paper bases grows exponentially.
  • Furthermore, properties implementing these tailored aesthetic frameworks alongside flame retardant materials report a 25% improvement in safety compliance ratings, proving that strategic interior customization directly drives measurable operational and commercial success.

What are the market trends shaping the Digitally Printed Wallpaper Industry?

  • The shift toward sustainability and eco-friendly practices has emerged as a prominent trend shaping the industry. Consumers and businesses increasingly prioritize environmentally responsible interior products.

  • Modern interior architectures increasingly rely on digital printing technologies to achieve unprecedented customization and agility. This technological transition allows businesses to deploy large-format wall murals that dynamically alter architectural features without structural renovations. By integrating rapid-curing uv-curable inks and transitioning to short-run manufacturing, production facilities have accelerated throughput, effectively reducing order-to-delivery lead times by 35%.
  • This operational efficiency enables designers to execute rapid updates in luxury interiors, aligning physical spaces with evolving seasonal trends through seamless on-demand printing. Furthermore, the adoption of circular economy practices and the specification of green building materials in sourcing has optimized end-of-life disposal protocols, lowering waste management expenditures by 22% for commercial operators.
  • These strategic shifts directly improve facility management agility, minimizing the downtime historically associated with extensive interior remodeling projects.

What challenges does the Digitally Printed Wallpaper Industry face during its growth?

  • The growing availability of cost-effective substitute products, such as paints and textured coatings, presents a significant barrier to market penetration.

  • Structural and operational limitations pose significant hurdles for the broad deployment of custom graphic wallcoverings in specialized facilities. Maintaining rigorous hygiene standards in healthcare and high-traffic zones demands exceptional moisture resistance, which some base substrates struggle to provide. Consequently, facility managers frequently report a 15% increase in maintenance overhead when deploying non-optimized customized decor in these demanding environments.
  • Transitioning to highly durable washable surfaces and breathable fabrics mitigates this risk but often introduces complex circular manufacturing processes that elevate initial procurement costs by nearly 20%. These financial barriers compel businesses and urban households to heavily weigh the aesthetic benefits of advanced prints against tangible lifecycle expenditures.
  • Overcoming these technical constraints requires continued innovation in substrate resilience to ensure long-term viability and reduced total cost of ownership.

Exclusive Technavio Analysis on Customer Landscape

The digitally printed wallpaper market forecasting report includes the adoption lifecycle of the market, covering from the innovator’s stage to the laggard’s stage. It focuses on adoption rates in different regions based on penetration. Furthermore, the digitally printed wallpaper market report also includes key purchase criteria and drivers of price sensitivity to help companies evaluate and develop their market growth analysis strategies.
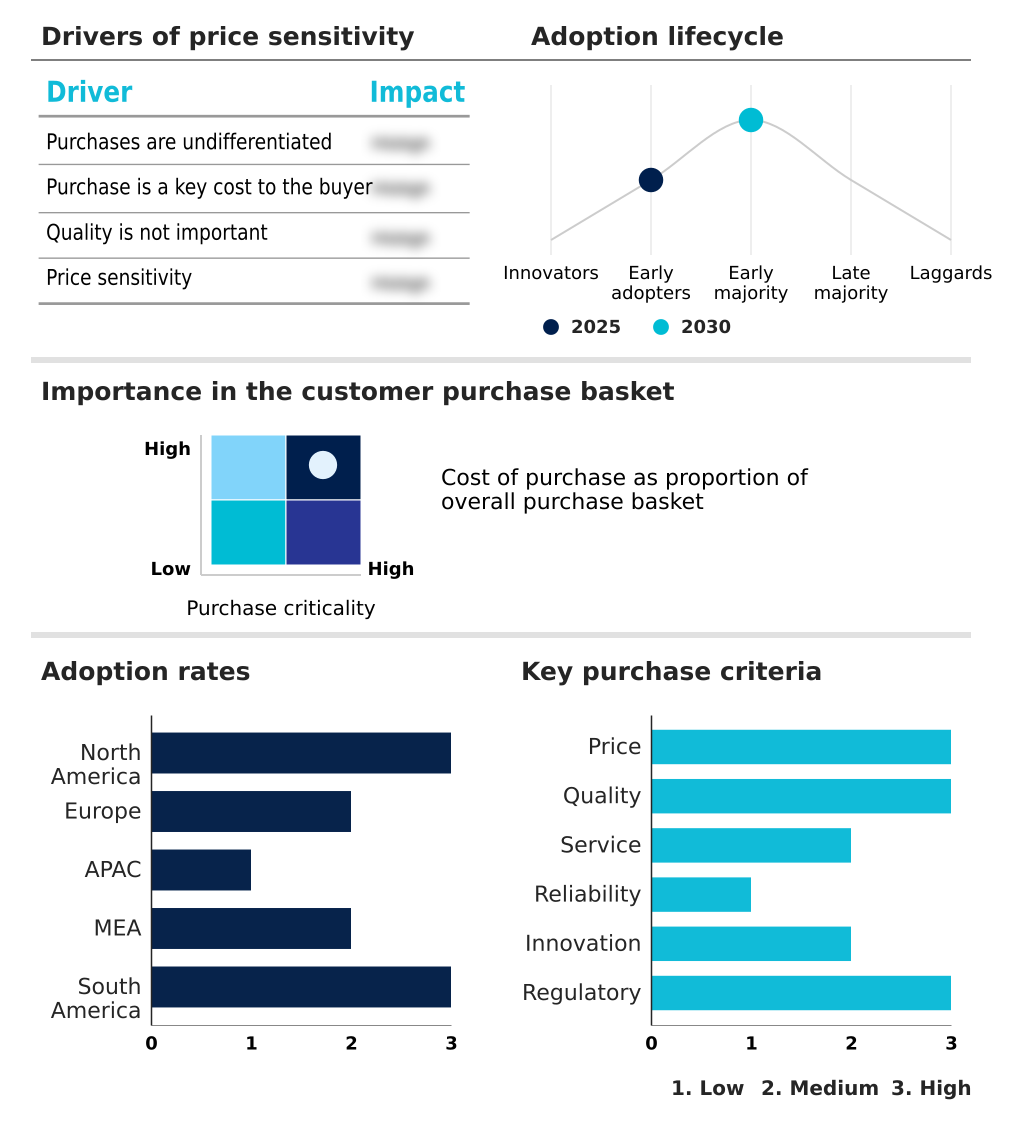
Customer Landscape of Digitally Printed Wallpaper Industry

Competitive Landscape

Companies are implementing various strategies, such as strategic alliances, digitally printed wallpaper market forecast, partnerships, mergers and acquisitions, geographical expansion, and product/service launches, to enhance their presence in the industry.

A.S. Creation Tapeten AG - The offering includes high-definition non-woven substrates and bespoke panoramic murals, providing scalable, customizable interior decoration solutions for commercial and residential environments.

The industry research and growth report includes detailed analyses of the competitive landscape of the market and information about key companies, including:

  • A.S. Creation Tapeten AG
  • Arte
  • Brewster Home Fashions
  • ELITIS
  • Flavor Paper Ltd.
  • Glamora
  • Graham and Brown Ltd.
  • Grandeco Wallfashion Group
  • Inkiostro Bianco
  • John Mark Ltd
  • Komar Products GmbH and Co. KG
  • Koroseal Interior Products LLC
  • LondonArt
  • MINDTHEGAP
  • Muraspec Decorative Solutions
  • MX Display Ltd.
  • Tapetenfabrik Gebr. Rasch
  • Tecnografica S.p.A.
  • Wallquest Inc.
  • York Wallcoverings Inc.

Qualitative and quantitative analysis of companies has been conducted to help clients understand the wider business environment as well as the strengths and weaknesses of key industry players. Data is qualitatively analyzed to categorize companies as pure play, category-focused, industry-focused, and diversified; it is quantitatively analyzed to categorize companies as dominant, leading, strong, tentative, and weak.

Recent Development and News in Digitally printed wallpaper market

  • In the Home Furnishings industry, the enforcement of stringent indoor air quality regulations across Europe restricted volatile organic compound emissions in building materials, directly impacting Digitally Printed Wallpaper demand by accelerating the transition toward water-based inks and achieving a 40% reduction in toxic emissions during production.
  • In the Home Furnishings industry, the rapid expansion of direct-to-consumer e-commerce platforms enabled localized customization at scale, directly impacting Digitally Printed Wallpaper demand by reducing inventory holding costs by 25% and facilitating on-demand printing models for residential consumers in North America.
  • In the Home Furnishings industry, the widespread adoption of sustainable procurement mandates within commercial real estate development required contractors to source eco-certified finishes, directly impacting Digitally Printed Wallpaper demand by driving a 30% increase in the utilization of recyclable non-woven substrates across large-scale hospitality projects in APAC.
  • In the Home Furnishings industry, the integration of augmented reality visualization tools in retail design workflows enhanced buyer confidence prior to installation, directly impacting Digitally Printed Wallpaper demand by reducing product return rates by 15% and increasing the specification of custom graphic murals in urban commercial spaces.

Dive into Technavio’s robust research methodology, blending expert interviews, extensive data synthesis, and validated models for unparalleled Digitally Printed Wallpaper Market insights. See full methodology.

Market Scope
Page number 286
Base year 2025
Historic period 2020-2024
Forecast period 2026-2030
Growth momentum & CAGR Accelerate at a CAGR of 21.1%
Market growth 2026-2030 USD 12662.3 million
Market structure Fragmented
YoY growth 2025-2026(%) 20.8%
Key countries US, Canada, Mexico, Germany, UK, France, Italy, Spain, The Netherlands, China, Japan, India, South Korea, Australia, Indonesia, Saudi Arabia, UAE, South Africa, Israel, Turkey, Brazil, Argentina and Chile
Competitive landscape Leading Companies, Market Positioning of Companies, Competitive Strategies, and Industry Risks

Request Free Sample

Research Analyst Overview

  • The continuous evolution of the Digitally Printed Wallpaper Market necessitates agile strategic planning within the architectural and design sectors. Boardrooms are increasingly aligning procurement strategies with localized short-run manufacturing to circumvent global supply chain disruptions. Transitioning to on-demand printing models allows enterprises to reduce excess inventory holding costs by a measurable 25%, drastically improving working capital allocation.
  • This operational shift coincides with stringent health and safety compliance, driving the specification of flame retardant materials in high-density public infrastructure. To satisfy aggressive corporate sustainability targets, procurement teams prioritize latex inks and pvc free media over traditional solvent-based alternatives. Furthermore, integrating recycled paper bases into the product matrix improves lifecycle circularity without compromising aesthetic fidelity.
  • Companies leveraging these advanced material frameworks achieve significantly higher compliance ratings in green building assessments compared to legacy installations. These targeted adaptations ensure that interior environments remain visually dynamic while strictly adhering to evolving environmental mandates and rigorous corporate governance frameworks.

What are the Key Data Covered in this Digitally Printed Wallpaper Market Research and Growth Report?

  • What is the expected growth of the Digitally Printed Wallpaper Market between 2026 and 2030?

    • USD 12.66 billion, at a CAGR of 21.1%

  • What segmentation does the market report cover?

    • The report is segmented by Product (Vinyl, Non-woven, and Others), Technology (Inkjet, and Electrophotography), Application (Commercial, and Residential) and Geography (North America, Europe, APAC, Middle East and Africa, South America)

  • Which regions are analyzed in the report?

    • North America, Europe, APAC, Middle East and Africa and South America

  • What are the key growth drivers and market challenges?

    • Urbanization and rising disposable income, Rise in availability of substitute products

  • Who are the major players in the Digitally Printed Wallpaper Market?

    • A.S. Creation Tapeten AG, Arte, Brewster Home Fashions, ELITIS, Flavor Paper Ltd., Glamora, Graham and Brown Ltd., Grandeco Wallfashion Group, Inkiostro Bianco, John Mark Ltd, Komar Products GmbH and Co. KG, Koroseal Interior Products LLC, LondonArt, MINDTHEGAP, Muraspec Decorative Solutions, MX Display Ltd., Tapetenfabrik Gebr. Rasch, Tecnografica S.p.A., Wallquest Inc. and York Wallcoverings Inc.

Market Research Insights

  • The Digitally Printed Wallpaper Market represents a critical segment for modern architectural planning, emphasizing visual quality and seamless interior branding. Businesses deploying experiential design strategies in commercial settings have observed a 28% improvement in customer engagement metrics, as bespoke graphics reinforce brand identity.
  • Furthermore, the rise of do-it-yourself applications within residential sectors reduces installation-related labor expenses by up to 35%, making high-end decor more accessible. Transitioning from traditional methods to advanced digital output minimizes material waste by 18%, significantly improving supply chain efficiency and compliance with environmental standards.
  • These strategic shifts enable organizations to optimize interior environments while maintaining strict operational budgets and high aesthetic benchmarks.

We can help! Our analysts can customize this digitally printed wallpaper market research report to meet your requirements.

Get in touch

1. Executive Summary

1.1 Market overview

Executive Summary - Chart on Market Overview
Executive Summary - Data Table on Market Overview
Executive Summary - Chart on Global Market Characteristics
Executive Summary - Chart on Market by Geography
Executive Summary - Chart on Market Segmentation by Product
Executive Summary - Chart on Market Segmentation by Technology
Executive Summary - Chart on Market Segmentation by Application
Executive Summary - Chart on Incremental Growth
Executive Summary - Data Table on Incremental Growth
Executive Summary - Chart on Company Market Positioning

2. Technavio Analysis

2.1 Analysis of price sensitivity, lifecycle, customer purchase basket, adoption rates, and purchase criteria

2.2 Criticality of inputs and Factors of differentiation

Chart on Overview on criticality of inputs and factors of differentiation

2.3 Factors of disruption

Chart on Overview on factors of disruption

2.4 Impact of drivers and challenges

Chart on Impact of drivers and challenges in 2025 and 2030

3. Market Landscape

3.1 Market ecosystem

Chart on Parent Market
Data Table on - Parent Market

3.2 Market characteristics

Chart on Market characteristics analysis

3.3 Value chain analysis

Chart on Value chain analysis

4. Market Sizing

4.1 Market definition

Data Table on Offerings of companies included in the market definition

4.2 Market segment analysis

Market segments

4.3 Market size 2025

4.4 Market outlook: Forecast for 2025-2030

Chart on Global - Market size and forecast 2025-2030 ($ million)
Data Table on Global - Market size and forecast 2025-2030 ($ million)
Chart on Global Market: Year-over-year growth 2025-2030 (%)
Data Table on Global Market: Year-over-year growth 2025-2030 (%)

5. Historic Market Size

5.1 Global Digitally Printed Wallpaper Market 2020 - 2024

Historic Market Size - Data Table on Global Digitally Printed Wallpaper Market 2020 - 2024 ($ million)

5.2 Product segment analysis 2020 - 2024

Historic Market Size - Product Segment 2020 - 2024 ($ million)

5.3 Technology segment analysis 2020 - 2024

Historic Market Size - Technology Segment 2020 - 2024 ($ million)

5.4 Application segment analysis 2020 - 2024

Historic Market Size - Application Segment 2020 - 2024 ($ million)

5.5 Geography segment analysis 2020 - 2024

Historic Market Size - Geography Segment 2020 - 2024 ($ million)

5.6 Country segment analysis 2020 - 2024

Historic Market Size - Country Segment 2020 - 2024 ($ million)

6. Qualitative Analysis

6.1 Impact of AI on Global Digitally Printed Wallpaper Market

6.2 Impact of Geopolitical Conflicts on Global Digitally Printed Wallpaper Market

7. Five Forces Analysis

7.1 Five forces summary

Five forces analysis - Comparison between 2025 and 2030

7.2 Bargaining power of buyers

Bargaining power of buyers - Impact of key factors 2025 and 2030

7.3 Bargaining power of suppliers

Bargaining power of suppliers - Impact of key factors in 2025 and 2030

7.4 Threat of new entrants

Threat of new entrants - Impact of key factors in 2025 and 2030

7.5 Threat of substitutes

Threat of substitutes - Impact of key factors in 2025 and 2030

7.6 Threat of rivalry

Threat of rivalry - Impact of key factors in 2025 and 2030

7.7 Market condition

Chart on Market condition - Five forces 2025 and 2030

8. Market Segmentation by Product

8.1 Market segments

Chart on Product - Market share 2025-2030 (%)
Data Table on Product - Market share 2025-2030 (%)

8.2 Comparison by Product

Chart on Comparison by Product
Data Table on Comparison by Product

8.3 Vinyl - Market size and forecast 2025-2030

Chart on Vinyl - Market size and forecast 2025-2030 ($ million)
Data Table on Vinyl - Market size and forecast 2025-2030 ($ million)
Chart on Vinyl - Year-over-year growth 2025-2030 (%)
Data Table on Vinyl - Year-over-year growth 2025-2030 (%)

8.4 Non-woven - Market size and forecast 2025-2030

Chart on Non-woven - Market size and forecast 2025-2030 ($ million)
Data Table on Non-woven - Market size and forecast 2025-2030 ($ million)
Chart on Non-woven - Year-over-year growth 2025-2030 (%)
Data Table on Non-woven - Year-over-year growth 2025-2030 (%)

8.5 Others - Market size and forecast 2025-2030

Chart on Others - Market size and forecast 2025-2030 ($ million)
Data Table on Others - Market size and forecast 2025-2030 ($ million)
Chart on Others - Year-over-year growth 2025-2030 (%)
Data Table on Others - Year-over-year growth 2025-2030 (%)

8.6 Market opportunity by Product

Market opportunity by Product ($ million)
Data Table on Market opportunity by Product ($ million)

9. Market Segmentation by Technology

9.1 Market segments

Chart on Technology - Market share 2025-2030 (%)
Data Table on Technology - Market share 2025-2030 (%)

9.2 Comparison by Technology

Chart on Comparison by Technology
Data Table on Comparison by Technology

9.3 Inkjet - Market size and forecast 2025-2030

Chart on Inkjet - Market size and forecast 2025-2030 ($ million)
Data Table on Inkjet - Market size and forecast 2025-2030 ($ million)
Chart on Inkjet - Year-over-year growth 2025-2030 (%)
Data Table on Inkjet - Year-over-year growth 2025-2030 (%)

9.4 Electrophotography - Market size and forecast 2025-2030

Chart on Electrophotography - Market size and forecast 2025-2030 ($ million)
Data Table on Electrophotography - Market size and forecast 2025-2030 ($ million)
Chart on Electrophotography - Year-over-year growth 2025-2030 (%)
Data Table on Electrophotography - Year-over-year growth 2025-2030 (%)

9.5 Market opportunity by Technology

Market opportunity by Technology ($ million)
Data Table on Market opportunity by Technology ($ million)

10. Market Segmentation by Application

10.1 Market segments

Chart on Application - Market share 2025-2030 (%)
Data Table on Application - Market share 2025-2030 (%)

10.2 Comparison by Application

Chart on Comparison by Application
Data Table on Comparison by Application

10.3 Commercial - Market size and forecast 2025-2030

Chart on Commercial - Market size and forecast 2025-2030 ($ million)
Data Table on Commercial - Market size and forecast 2025-2030 ($ million)
Chart on Commercial - Year-over-year growth 2025-2030 (%)
Data Table on Commercial - Year-over-year growth 2025-2030 (%)

10.4 Residential - Market size and forecast 2025-2030

Chart on Residential - Market size and forecast 2025-2030 ($ million)
Data Table on Residential - Market size and forecast 2025-2030 ($ million)
Chart on Residential - Year-over-year growth 2025-2030 (%)
Data Table on Residential - Year-over-year growth 2025-2030 (%)

10.5 Market opportunity by Application

Market opportunity by Application ($ million)
Data Table on Market opportunity by Application ($ million)

11. Customer Landscape

11.1 Customer landscape overview

Analysis of price sensitivity, lifecycle, customer purchase basket, adoption rates, and purchase criteria

12. Geographic Landscape

12.1 Geographic segmentation

Chart on Market share by geography 2025-2030 (%)
Data Table on Market share by geography 2025-2030 (%)

12.2 Geographic comparison

Chart on Geographic comparison
Data Table on Geographic comparison

12.3 North America - Market size and forecast 2025-2030

Chart on North America - Market size and forecast 2025-2030 ($ million)
Data Table on North America - Market size and forecast 2025-2030 ($ million)
Chart on North America - Year-over-year growth 2025-2030 (%)
Data Table on North America - Year-over-year growth 2025-2030 (%)
Chart on Regional Comparison - North America
Data Table on Regional Comparison - North America

12.3.1 US - Market size and forecast 2025-2030

Chart on US - Market size and forecast 2025-2030 ($ million)
Data Table on US - Market size and forecast 2025-2030 ($ million)
Chart on US - Year-over-year growth 2025-2030 (%)
Data Table on US - Year-over-year growth 2025-2030 (%)

12.3.2 Canada - Market size and forecast 2025-2030

Chart on Canada - Market size and forecast 2025-2030 ($ million)
Data Table on Canada - Market size and forecast 2025-2030 ($ million)
Chart on Canada - Year-over-year growth 2025-2030 (%)
Data Table on Canada - Year-over-year growth 2025-2030 (%)

12.3.3 Mexico - Market size and forecast 2025-2030

Chart on Mexico - Market size and forecast 2025-2030 ($ million)
Data Table on Mexico - Market size and forecast 2025-2030 ($ million)
Chart on Mexico - Year-over-year growth 2025-2030 (%)
Data Table on Mexico - Year-over-year growth 2025-2030 (%)

12.4 Europe - Market size and forecast 2025-2030

Chart on Europe - Market size and forecast 2025-2030 ($ million)
Data Table on Europe - Market size and forecast 2025-2030 ($ million)
Chart on Europe - Year-over-year growth 2025-2030 (%)
Data Table on Europe - Year-over-year growth 2025-2030 (%)
Chart on Regional Comparison - Europe
Data Table on Regional Comparison - Europe

12.4.1 Germany - Market size and forecast 2025-2030

Chart on Germany - Market size and forecast 2025-2030 ($ million)
Data Table on Germany - Market size and forecast 2025-2030 ($ million)
Chart on Germany - Year-over-year growth 2025-2030 (%)
Data Table on Germany - Year-over-year growth 2025-2030 (%)

12.4.2 UK - Market size and forecast 2025-2030

Chart on UK - Market size and forecast 2025-2030 ($ million)
Data Table on UK - Market size and forecast 2025-2030 ($ million)
Chart on UK - Year-over-year growth 2025-2030 (%)
Data Table on UK - Year-over-year growth 2025-2030 (%)

12.4.3 France - Market size and forecast 2025-2030

Chart on France - Market size and forecast 2025-2030 ($ million)
Data Table on France - Market size and forecast 2025-2030 ($ million)
Chart on France - Year-over-year growth 2025-2030 (%)
Data Table on France - Year-over-year growth 2025-2030 (%)

12.4.4 Italy - Market size and forecast 2025-2030

Chart on Italy - Market size and forecast 2025-2030 ($ million)
Data Table on Italy - Market size and forecast 2025-2030 ($ million)
Chart on Italy - Year-over-year growth 2025-2030 (%)
Data Table on Italy - Year-over-year growth 2025-2030 (%)

12.4.5 Spain - Market size and forecast 2025-2030

Chart on Spain - Market size and forecast 2025-2030 ($ million)
Data Table on Spain - Market size and forecast 2025-2030 ($ million)
Chart on Spain - Year-over-year growth 2025-2030 (%)
Data Table on Spain - Year-over-year growth 2025-2030 (%)

12.4.6 The Netherlands - Market size and forecast 2025-2030

Chart on The Netherlands - Market size and forecast 2025-2030 ($ million)
Data Table on The Netherlands - Market size and forecast 2025-2030 ($ million)
Chart on The Netherlands - Year-over-year growth 2025-2030 (%)
Data Table on The Netherlands - Year-over-year growth 2025-2030 (%)

12.5 APAC - Market size and forecast 2025-2030

Chart on APAC - Market size and forecast 2025-2030 ($ million)
Data Table on APAC - Market size and forecast 2025-2030 ($ million)
Chart on APAC - Year-over-year growth 2025-2030 (%)
Data Table on APAC - Year-over-year growth 2025-2030 (%)
Chart on Regional Comparison - APAC
Data Table on Regional Comparison - APAC

12.5.1 China - Market size and forecast 2025-2030

Chart on China - Market size and forecast 2025-2030 ($ million)
Data Table on China - Market size and forecast 2025-2030 ($ million)
Chart on China - Year-over-year growth 2025-2030 (%)
Data Table on China - Year-over-year growth 2025-2030 (%)

12.5.2 Japan - Market size and forecast 2025-2030

Chart on Japan - Market size and forecast 2025-2030 ($ million)
Data Table on Japan - Market size and forecast 2025-2030 ($ million)
Chart on Japan - Year-over-year growth 2025-2030 (%)
Data Table on Japan - Year-over-year growth 2025-2030 (%)

12.5.3 India - Market size and forecast 2025-2030

Chart on India - Market size and forecast 2025-2030 ($ million)
Data Table on India - Market size and forecast 2025-2030 ($ million)
Chart on India - Year-over-year growth 2025-2030 (%)
Data Table on India - Year-over-year growth 2025-2030 (%)

12.5.4 South Korea - Market size and forecast 2025-2030

Chart on South Korea - Market size and forecast 2025-2030 ($ million)
Data Table on South Korea - Market size and forecast 2025-2030 ($ million)
Chart on South Korea - Year-over-year growth 2025-2030 (%)
Data Table on South Korea - Year-over-year growth 2025-2030 (%)

12.5.5 Australia - Market size and forecast 2025-2030

Chart on Australia - Market size and forecast 2025-2030 ($ million)
Data Table on Australia - Market size and forecast 2025-2030 ($ million)
Chart on Australia - Year-over-year growth 2025-2030 (%)
Data Table on Australia - Year-over-year growth 2025-2030 (%)

12.5.6 Indonesia - Market size and forecast 2025-2030

Chart on Indonesia - Market size and forecast 2025-2030 ($ million)
Data Table on Indonesia - Market size and forecast 2025-2030 ($ million)
Chart on Indonesia - Year-over-year growth 2025-2030 (%)
Data Table on Indonesia - Year-over-year growth 2025-2030 (%)

12.6 Middle East and Africa - Market size and forecast 2025-2030

Chart on Middle East and Africa - Market size and forecast 2025-2030 ($ million)
Data Table on Middle East and Africa - Market size and forecast 2025-2030 ($ million)
Chart on Middle East and Africa - Year-over-year growth 2025-2030 (%)
Data Table on Middle East and Africa - Year-over-year growth 2025-2030 (%)
Chart on Regional Comparison - Middle East and Africa
Data Table on Regional Comparison - Middle East and Africa

12.6.1 Saudi Arabia - Market size and forecast 2025-2030

Chart on Saudi Arabia - Market size and forecast 2025-2030 ($ million)
Data Table on Saudi Arabia - Market size and forecast 2025-2030 ($ million)
Chart on Saudi Arabia - Year-over-year growth 2025-2030 (%)
Data Table on Saudi Arabia - Year-over-year growth 2025-2030 (%)

12.6.2 UAE - Market size and forecast 2025-2030

Chart on UAE - Market size and forecast 2025-2030 ($ million)
Data Table on UAE - Market size and forecast 2025-2030 ($ million)
Chart on UAE - Year-over-year growth 2025-2030 (%)
Data Table on UAE - Year-over-year growth 2025-2030 (%)

12.6.3 South Africa - Market size and forecast 2025-2030

Chart on South Africa - Market size and forecast 2025-2030 ($ million)
Data Table on South Africa - Market size and forecast 2025-2030 ($ million)
Chart on South Africa - Year-over-year growth 2025-2030 (%)
Data Table on South Africa - Year-over-year growth 2025-2030 (%)

12.6.4 Israel - Market size and forecast 2025-2030

Chart on Israel - Market size and forecast 2025-2030 ($ million)
Data Table on Israel - Market size and forecast 2025-2030 ($ million)
Chart on Israel - Year-over-year growth 2025-2030 (%)
Data Table on Israel - Year-over-year growth 2025-2030 (%)

12.6.5 Turkey - Market size and forecast 2025-2030

Chart on Turkey - Market size and forecast 2025-2030 ($ million)
Data Table on Turkey - Market size and forecast 2025-2030 ($ million)
Chart on Turkey - Year-over-year growth 2025-2030 (%)
Data Table on Turkey - Year-over-year growth 2025-2030 (%)

12.7 South America - Market size and forecast 2025-2030

Chart on South America - Market size and forecast 2025-2030 ($ million)
Data Table on South America - Market size and forecast 2025-2030 ($ million)
Chart on South America - Year-over-year growth 2025-2030 (%)
Data Table on South America - Year-over-year growth 2025-2030 (%)
Chart on Regional Comparison - South America
Data Table on Regional Comparison - South America

12.7.1 Brazil - Market size and forecast 2025-2030

Chart on Brazil - Market size and forecast 2025-2030 ($ million)
Data Table on Brazil - Market size and forecast 2025-2030 ($ million)
Chart on Brazil - Year-over-year growth 2025-2030 (%)
Data Table on Brazil - Year-over-year growth 2025-2030 (%)

12.7.2 Argentina - Market size and forecast 2025-2030

Chart on Argentina - Market size and forecast 2025-2030 ($ million)
Data Table on Argentina - Market size and forecast 2025-2030 ($ million)
Chart on Argentina - Year-over-year growth 2025-2030 (%)
Data Table on Argentina - Year-over-year growth 2025-2030 (%)

12.7.3 Chile - Market size and forecast 2025-2030

Chart on Chile - Market size and forecast 2025-2030 ($ million)
Data Table on Chile - Market size and forecast 2025-2030 ($ million)
Chart on Chile - Year-over-year growth 2025-2030 (%)
Data Table on Chile - Year-over-year growth 2025-2030 (%)

12.8 Market opportunity by geography

Market opportunity by geography ($ million)
Data Tables on Market opportunity by geography ($ million)

13. Drivers, Challenges, and Opportunity

13.1 Market drivers

Urbanization and rising disposable income
Rising demand in commercial spaces
Rapid expansion of e-commerce

13.2 Market challenges

Rise in availability of substitute products
Concerns regarding use of wallpapers
Regulatory and compliance hurdle is restricting market growth

13.3 Impact of drivers and challenges

Impact of drivers and challenges in 2025 and 2030

13.4 Market opportunities

Shift toward sustainability and eco-friendly practices
Rapid technological advancements are expediting market growth
Hyper-personalization and on-demand design

14. Competitive Landscape

14.1 Overview

14.2

Overview on criticality of inputs and factors of differentiation

14.3 Landscape disruption

Overview on factors of disruption

14.4 Industry risks

Impact of key risks on business

15. Competitive Analysis

15.1 Companies profiled

Companies covered

15.2 Company ranking index

15.3 Market positioning of companies

Matrix on companies position and classification

15.4 A.S. Creation Tapeten AG

A.S. Creation Tapeten AG - Overview
A.S. Creation Tapeten AG - Business segments
A.S. Creation Tapeten AG - Key offerings
A.S. Creation Tapeten AG - Segment focus
SWOT

15.5 Arte

Arte - Overview
Arte - Product / Service
Arte - Key offerings
SWOT

15.6 Brewster Home Fashions

Brewster Home Fashions - Overview
Brewster Home Fashions - Product / Service
Brewster Home Fashions - Key offerings
SWOT

15.7 ELITIS

ELITIS - Overview
ELITIS - Product / Service
ELITIS - Key offerings
SWOT

15.8 Flavor Paper Ltd.

Flavor Paper Ltd. - Overview
Flavor Paper Ltd. - Product / Service
Flavor Paper Ltd. - Key offerings
SWOT

15.9 Glamora

Glamora - Overview
Glamora - Product / Service
Glamora - Key offerings
SWOT

15.10 Grandeco Wallfashion Group

Grandeco Wallfashion Group - Overview
Grandeco Wallfashion Group - Product / Service
Grandeco Wallfashion Group - Key offerings
SWOT

15.11 John Mark Ltd

John Mark Ltd - Overview
John Mark Ltd - Product / Service
John Mark Ltd - Key offerings
SWOT

15.12 Komar Products GmbH and Co. KG

Komar Products GmbH and Co. KG - Overview
Komar Products GmbH and Co. KG - Product / Service
Komar Products GmbH and Co. KG - Key offerings
SWOT

15.13 LondonArt

LondonArt - Overview
LondonArt - Product / Service
LondonArt - Key offerings
SWOT

15.14 MINDTHEGAP

MINDTHEGAP - Overview
MINDTHEGAP - Product / Service
MINDTHEGAP - Key offerings
SWOT

15.15 MX Display Ltd.

MX Display Ltd. - Overview
MX Display Ltd. - Product / Service
MX Display Ltd. - Key offerings
SWOT

15.16 Tapetenfabrik Gebr. Rasch

Tapetenfabrik Gebr. Rasch - Overview
Tapetenfabrik Gebr. Rasch - Product / Service
Tapetenfabrik Gebr. Rasch - Key offerings
SWOT

15.17 Wallquest Inc.

Wallquest Inc. - Overview
Wallquest Inc. - Product / Service
Wallquest Inc. - Key offerings
SWOT

15.18 York Wallcoverings Inc.

York Wallcoverings Inc. - Overview
York Wallcoverings Inc. - Product / Service
York Wallcoverings Inc. - Key offerings
SWOT

16. Appendix

16.1 Scope of the report

Market definition
Objectives
Notes and caveats

16.2 Inclusions and exclusions checklist

Inclusions checklist
Exclusions checklist

16.3 Currency conversion rates for US$

16.4 Research methodology

16.5 Data procurement

Information sources

16.6 Data validation

16.7 Validation techniques employed for market sizing

16.8 Data synthesis

16.9 360 degree market analysis

16.10 List of abbreviations

Research Methodology

Technavio presents a detailed picture of the market by way of study, synthesis, and summation of data from multiple sources. The analysts have presented the various facets of the market with a particular focus on identifying the key industry influencers. The data thus presented is comprehensive, reliable, and the result of extensive research, both primary and secondary.

INFORMATION SOURCES

Primary sources

  • Manufacturers and suppliers
  • Channel partners
  • Industry experts
  • Strategic decision makers

Secondary sources

  • Industry journals and periodicals
  • Government data
  • Financial reports of key industry players
  • Historical data
  • Press releases

DATA ANALYSIS

Data Synthesis

  • Collation of data
  • Estimation of key figures
  • Analysis of derived insights

Data Validation

  • Triangulation with data models
  • Reference against proprietary databases
  • Corroboration with industry experts

REPORT WRITING

Qualitative

  • Market drivers
  • Market challenges
  • Market trends
  • Five forces analysis

Quantitative

  • Market size and forecast
  • Market segmentation
  • Geographical insights
  • Competitive landscape

Interested in this report?

Get your sample now to see our research methodology and insights!

Download Now

Frequently Asked Questions

Digitally Printed Wallpaper market growth will increase by USD 12662.3 million during 2026-2030.

The Digitally Printed Wallpaper market is expected to grow at a CAGR of 21.1% during 2026-2030.

Digitally Printed Wallpaper market is segmented by Product (Vinyl, Non-woven, Others) Technology (Inkjet, Electrophotography) Application (Commercial, Residential)

A.S. Creation Tapeten AG, Arte, Brewster Home Fashions, ELITIS, Flavor Paper Ltd., Glamora, Graham and Brown Ltd., Grandeco Wallfashion Group, Inkiostro Bianco, John Mark Ltd, Komar Products GmbH and Co. KG, Koroseal Interior Products LLC, LondonArt, MINDTHEGAP, Muraspec Decorative Solutions, MX Display Ltd., Tapetenfabrik Gebr. Rasch, Tecnografica S.p.A., Wallquest Inc., York Wallcoverings Inc. are a few of the key vendors in the Digitally Printed Wallpaper market.

North America will register the highest growth rate of 36.1% among the other regions. Therefore, the Digitally Printed Wallpaper market in North America is expected to garner significant business opportunities for the vendors during the forecast period.

US, Canada, Mexico, Germany, UK, France, Italy, Spain, The Netherlands, China, Japan, India, South Korea, Australia, Indonesia, Saudi Arabia, UAE, South Africa, Israel, Turkey, Brazil, Argentina, Chile

  • Urbanization and rising disposable income is the driving factor this market.

The Digitally Printed Wallpaper market vendors should focus on grabbing business opportunities from the Product segment as it accounted for the largest market share in the base year.
RIA - Research AI Assistant
Ask RIA
