
District Cooling Market Analysis, Size, and Forecast 2026-2030: Middle East and Africa (UAE, Saudi Arabia, and Qatar), North America (US, Canada, and Mexico), Europe (Sweden, Finland, and France), APAC (China, Japan, and South Korea), South America (Brazil, Chile, and Argentina), and Rest of World (ROW)

District Cooling Market Analysis, Size, and Forecast 2026-2030:
Middle East and Africa (UAE, Saudi Arabia, and Qatar), North America (US, Canada, and Mexico), Europe (Sweden, Finland, and France), APAC (China, Japan, and South Korea), South America (Brazil, Chile, and Argentina), and Rest of World (ROW)

Published: Oct 2026 318 Pages SKU: IRTNTR80046

Market Overview at a Glance

$13.77 B
Market Opportunity
7.1%
CAGR 2025 - 2030
43.8%
Middle East and Africa Growth
$13.87 B
Electric chillers segment 2024

District Cooling Market Size 2026-2030

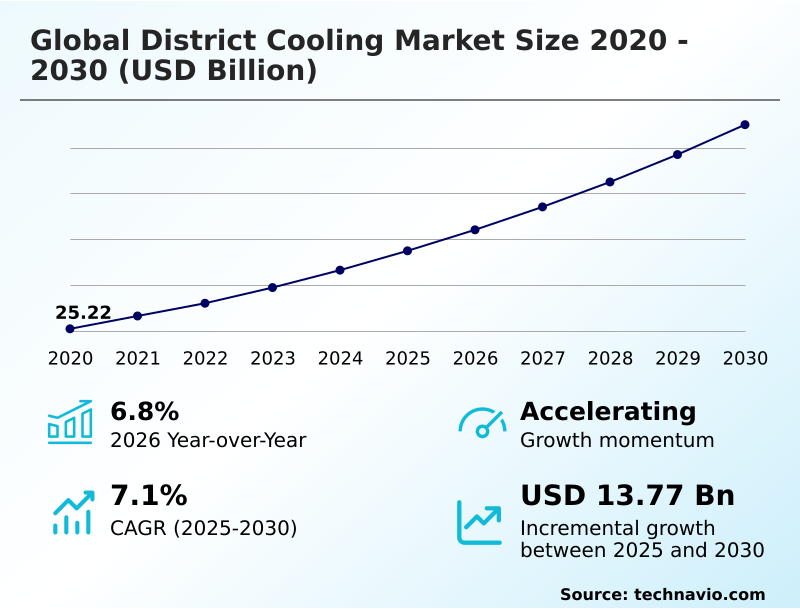
The district cooling market size is valued to increase by USD 13.77 billion, at a CAGR of 7.1% from 2025 to 2030. Rising demand for energy-efficient cooling solutions will drive the district cooling market.

Major Market Trends & Insights

  • Middle East and Africa dominated the market and accounted for a 43.8% growth during the forecast period.
  • By Product Type - Electric chillers segment was valued at USD 13.87 billion in 2024
  • By End-user - Commercial segment accounted for the largest market revenue share in 2024

Market Size & Forecast

  • Market Opportunities: USD 22.27 billion
  • Market Future Opportunities: USD 13.77 billion
  • CAGR from 2025 to 2030 : 7.1%

Market Summary

  • The District Cooling Market demonstrates robust expansion as urban centers shift toward centralized thermal energy distribution. A primary driver of this transition is the escalating need for energy-efficient cooling solutions to combat rising temperatures and urbanization, which directly reduces the electrical burden on municipal grids.
  • Conversely, the necessity for massive initial capital investments in underground distribution networks poses a significant barrier to entry, often delaying project implementation in emerging metropolitan areas. In a practical business scenario, large-scale commercial property developers are replacing decentralized air conditioning units with centralized connections, enabling a 35% improvement in floor space utilization by eliminating bulky rooftop chillers.
  • This operational shift allows facility managers to optimize maintenance schedules and stabilize utility expenses over long-term contracts. By aggregating thermal demand across multiple buildings, these systems achieve remarkable economies of scale, vastly outperforming standalone mechanical equipment.
  • As regulatory frameworks increasingly mandate stringent environmental compliance, stakeholders continue to prioritize these centralized solutions to meet sustainability targets while ensuring consistent, high-capacity climate control for dense urban populations.

What will be the Size of the District Cooling Market during the forecast period?
Get Key Insights on Market Forecast (PDF) Get Free Sample

How is the District Cooling Market Segmented?

The district cooling industry research report provides comprehensive data (region-wise segment analysis), with forecasts and estimates in "USD million" for the period 2026-2030, as well as historical data from 2020-2024 for the following segments.

  • Product type
    • Electric chillers
    • Free cooling
    • Absorption cooling
  • End-user
    • Commercial
    • Industrial
    • Residential
  • Source
    • Fossil fuel
    • Renewable energy
  • Technology
    • Chilled water systems
    • Thermal energy storage
  • Geography
    • Middle East and Africa
      • UAE
      • Saudi Arabia
      • Qatar
      • Kuwait
      • Bahrain
    • North America
      • US
      • Canada
      • Mexico
    • Europe
      • Sweden
      • Finland
      • France
      • Germany
      • Denmark
      • Italy
    • APAC
      • China
      • Japan
      • South Korea
      • Singapore
      • India
      • Thailand
    • South America
      • Brazil
      • Chile
      • Argentina

By Product Type Insights

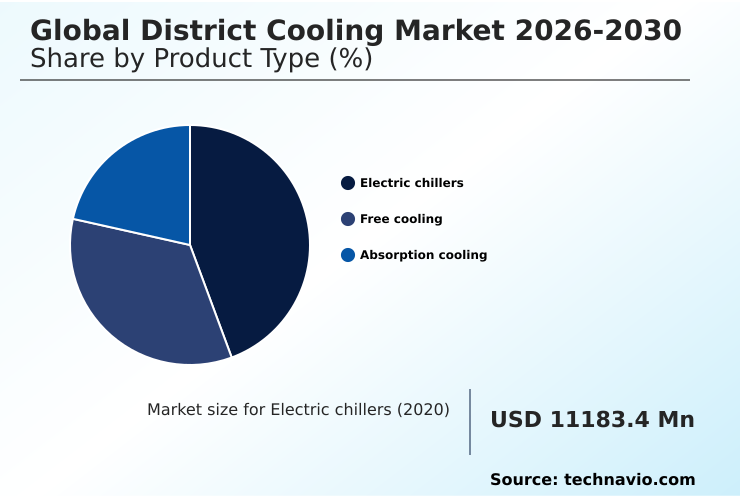
The electric chillers segment is estimated to witness significant growth during the forecast period.

Electric chillers function as the mechanical core of centralized cooling networks, heavily influencing industrial decarbonization roadmaps. These units offer superior full-load efficiency over decentralized alternatives, allowing operators to achieve operational sustainability mandates.

By integrating heat transfer systems and variable speed drives, plant managers improve partial-load precision, yielding a 22% reduction in overall electricity consumption during off-peak hours compared to traditional equipment.

This performance edge enables commercial properties to secure stringent green building certifications easily. Electric chillers seamlessly pair with thermal energy storage and absorption chillers, actively supporting urban heat island mitigation efforts.

Connecting these massive systems to insulated underground piping and free cooling technology optimizes peak load management, ensuring that energy delivery matches dynamic building demands perfectly without straining local grid limits.
Get Free Sample

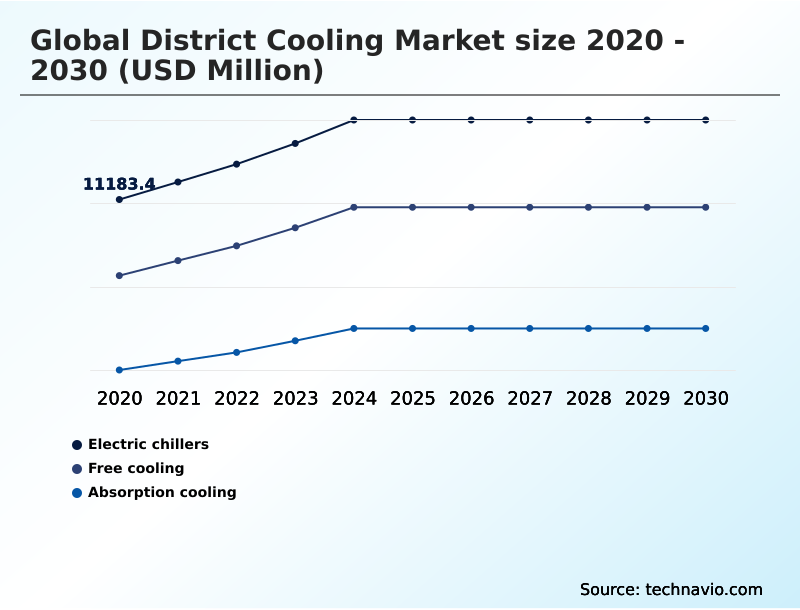
The Electric chillers segment was valued at USD 13.87 billion in 2024 and showed a gradual increase during the forecast period.
Get Free Sample

Regional Analysis

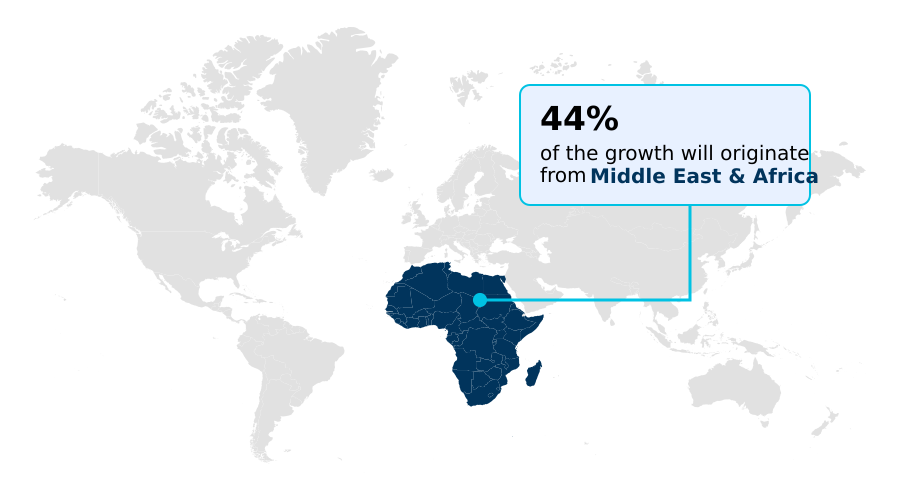
Middle East and Africa is estimated to contribute 43.8% to the growth of the global market during the forecast period.Technavio’s analysts have elaborately explained the regional trends and drivers that shape the market during the forecast period.
See How District Cooling Market Demand is Rising in Middle East and Africa Get Free Sample

The geographic adoption of District Cooling reveals stark contrasts driven by climate imperatives and regulatory frameworks. The Middle East and Africa region commands the sector due to extreme ambient temperatures, where rapid sustainable urban expansion necessitates aggressive cooling capacity scaling.

Facilities in this region experience a 45% higher baseline utilization rate compared to Europe, as centralized cooling operates as an essential, uninterrupted utility rather than a seasonal service.

Conversely, Europe prioritizes strict decarbonization, accelerating the deployment of air-to-water heat pumps and low-GWP refrigerants within smart utility management frameworks. European operators achieve a 30% reduction in thermal energy waste by integrating modular chiller plants with local heating networks.

While the Middle East relies heavily on massive water-cooled chillers for foundational capacity, North American markets are increasingly applying direct-to-chip cooling to support data center infrastructure.

This regional divergence highlights how local operational costs and environmental mandates dictate infrastructure design, altering procurement strategies globally.

Market Dynamics

Our researchers analyzed the data with 2025 as the base year, along with the key drivers, trends, and challenges. A holistic analysis of drivers will help companies refine their marketing strategies to gain a competitive advantage.

  • The continuous evolution of the District Cooling landscape is heavily reliant on the centralized production of cooling energy to satisfy escalating urban demands. As municipalities drive sustainable urban cooling network expansion, developers prioritize the integration of renewable energy sources to dramatically reduce grid dependency.
  • In modern business applications, the retrofit of aging urban infrastructure yields nearly double the energy efficiency compared to traditional decentralized air conditioning system replacement. This shift facilitates seamless compliance with building energy codes while optimizing lifecycle maintenance costs.
  • To address complex operational requirements, facility managers are adopting intelligent district energy management technologies that power real-time cooling demand forecasting models, cutting unnecessary energy expenditure by over a quarter. Furthermore, optimized architectures for thermal management heavily depend on automated chiller sequencing and pump performance to ensure consistent high-density commercial district temperature regulation.
  • Specialized environments now demand scalable liquid cooling in data centers, allowing for maximum computational output without overheating. Geographically favored regions are accelerating deep-sea water cooling process implementation alongside hybrid systems utilizing seawater cooling to leverage natural thermal sinks. Simultaneously, manufacturing hubs are deploying industrial waste heat utilization strategies, capturing residual energy to fuel cooling cycles.
  • These interconnected advancements demonstrate a profound transformation in how modern properties secure reliable, low-impact climate control across varying environmental and operational conditions.
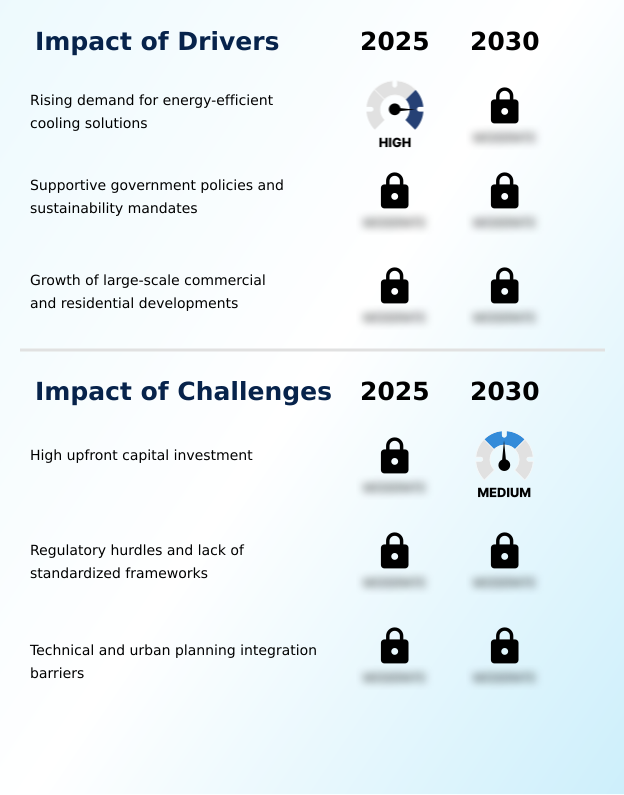
What are the key market drivers leading to the rise in the adoption of District Cooling Industry?

  • The escalating demand for energy-efficient cooling solutions functions as the primary catalyst propelling industry expansion.

  • The urgent need for comprehensive carbon footprint reduction heavily drives the adoption of utility-scale infrastructure across commercial real estate. Building owners are rapidly abandoning fragmented setups in favor of high-efficiency mechanical plants that anchor broader thermal management ecosystems.
  • By implementing IoT sensor integration and automated control systems, operators enable precise cooling load profiling, which decreases energy waste by 22% during partial occupancy periods. This demand-responsive management drastically lowers the electrical burden on local grids.
  • Furthermore, the fusion of smart building controls and predictive maintenance analytics within hybrid cooling architectures extends equipment lifespans by up to 30%, significantly mitigating unplanned downtime.
  • These data-driven efficiencies compel developers to prioritize centralized systems to maintain competitive leasing rates and ensure continuous operational stability.

What are the market trends shaping the District Cooling Industry?

  • Digitalization and the integration of smart grids represent a significant trend shaping the industry. These technological advancements enhance operational efficiency and enable proactive demand management.

  • The aggressive transition toward climate-resilient infrastructure has accelerated the adoption of advanced chilled water distribution frameworks. Municipalities are deeply embedding resource circularity principles into new developments, utilizing treated sewage effluent and geothermal energy extraction to minimize potable water consumption. This strategic pivot reduces fresh water reliance by 40% compared to legacy cooling towers.
  • Furthermore, the deployment of seawater cooling integration and waste heat recovery methods allows operators to optimize large-scale centrifugal compressor units. Facility operators utilizing these hybrid sources report a 25% improvement in overall thermal efficiency.
  • By pairing these generation techniques with massive stratified storage tanks and smart grid synchronization, energy managers can shift loads dynamically, bypassing the limitations of decentralized energy networks. Consequently, commercial tenants are increasingly entering stringent energy performance contracts, securing predictable operational expenses while meeting sustainability targets.

What challenges does the District Cooling Industry face during its growth?

  • Substantial upfront capital requirements remain a formidable barrier constraining widespread infrastructure deployment.

  • Complex retrofitting requirements and massive upfront capital expenditures severely restrict the immediate deployment of centralized thermal networks in established metropolitan areas. Integrating cooling substations and energy transfer stations into dense urban grids disrupts existing infrastructure, slowing the execution of smart city blueprints.
  • Achieving optimal thermal distribution efficiency demands precise coordination of variable frequency drives and extensive subterranean piping, which inflates initial construction budgets by over 40% compared to localized HVAC installations. Furthermore, maintaining facility energy security while ensuring precision temperature regulation for high-density IT loads complicates the engineering of circular energy cycles.
  • While leveraging natural thermal sinks and liquid cooling optimization offers long-term benefits, the extended return on investment deters private developers from abandoning legacy systems, severely delaying widespread market penetration.

Exclusive Technavio Analysis on Customer Landscape

The district cooling market forecasting report includes the adoption lifecycle of the market, covering from the innovator’s stage to the laggard’s stage. It focuses on adoption rates in different regions based on penetration. Furthermore, the district cooling market report also includes key purchase criteria and drivers of price sensitivity to help companies evaluate and develop their market growth analysis strategies.
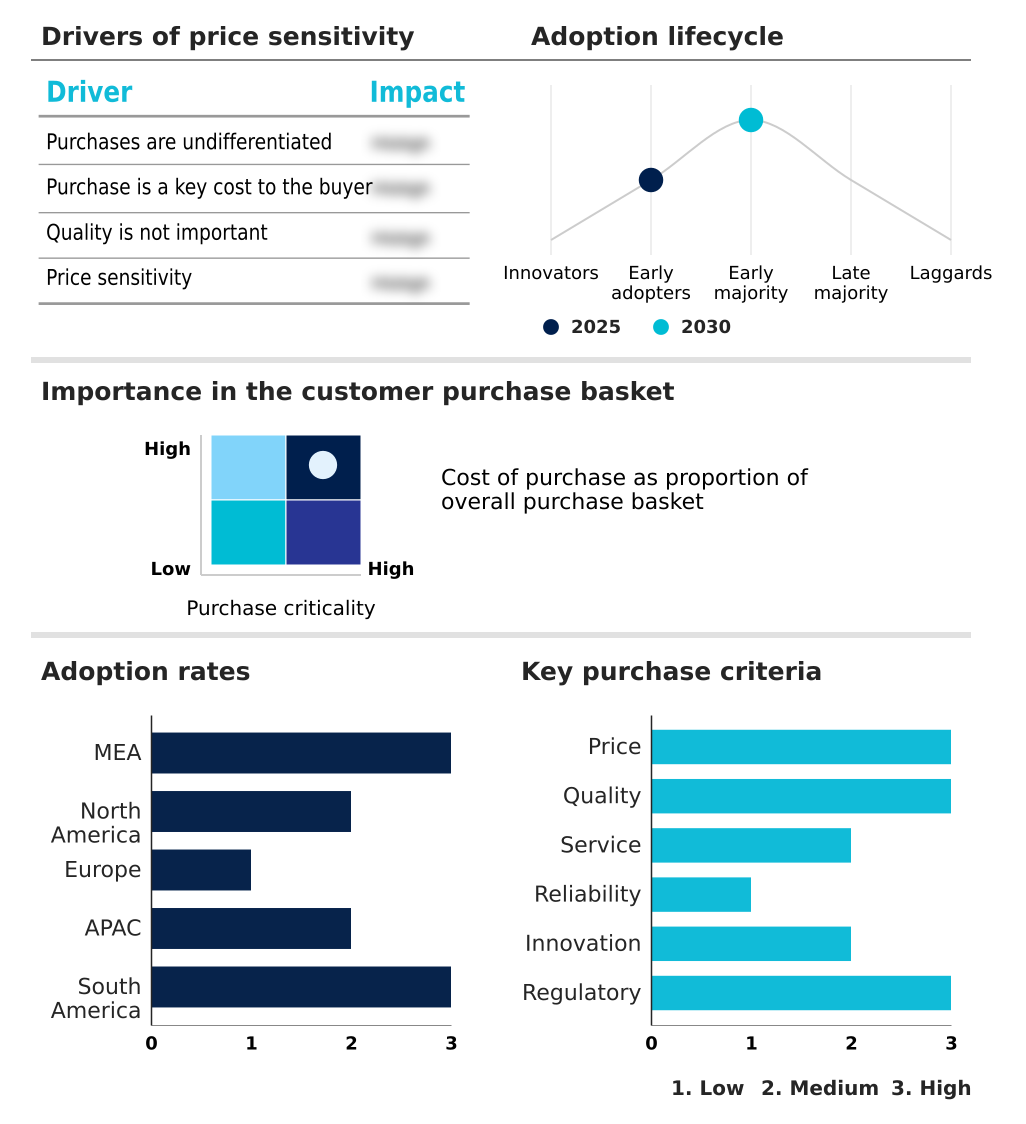
Customer Landscape of District Cooling Industry

Competitive Landscape

Companies are implementing various strategies, such as strategic alliances, district cooling market forecast, partnerships, mergers and acquisitions, geographical expansion, and product/service launches, to enhance their presence in the industry.

Alfa Laval AB - Delivers energy-efficient thermal management technologies, plate heat exchangers, and advanced pumping solutions designed to optimize centralized cooling networks and improve large-scale urban infrastructure performance.

The industry research and growth report includes detailed analyses of the competitive landscape of the market and information about key companies, including:

  • Alfa Laval AB
  • AtkinsRealis Group Inc.
  • Carrier Global Corp.
  • Daikin Industries Ltd.
  • Danfoss AS
  • E.ON SE
  • ENGIE SA
  • Fortum Oyj
  • Grundfos Holding AS
  • Johnson Controls International
  • Keppel Ltd.
  • Mitsubishi Heavy Industries
  • Ramboll Group AS
  • Shinryo Corp.
  • Siemens AG
  • Thermax Ltd.
  • Trane Technologies plc
  • Vattenfall AB
  • Veolia Environment SA
  • Xylem Inc.

Qualitative and quantitative analysis of companies has been conducted to help clients understand the wider business environment as well as the strengths and weaknesses of key industry players. Data is qualitatively analyzed to categorize companies as pure play, category-focused, industry-focused, and diversified; it is quantitatively analyzed to categorize companies as dominant, leading, strong, tentative, and weak.

Recent Development and News in District cooling market

  • In the Building Products industry, the widespread adoption of stringent green building certifications has forced commercial developers to integrate high-efficiency mechanical plants, directly impacting District Cooling demand by requiring utility-scale infrastructure to meet new efficiency thresholds.
  • The shift toward climate-resilient infrastructure in urban zoning regulations has mandated the implementation of thermal management ecosystems, driving District Cooling adoption as municipalities seek to optimize peak electricity demand by centralizing thermal distribution efficiency.
  • Material supply chain disruptions in the manufacturing of decentralized energy networks have accelerated the transition toward circular energy cycles, boosting District Cooling deployment as developers leverage centralized resource circularity principles to lower component procurement risks by 18%.
  • Tightening regional energy performance contracts for public facilities has necessitated the deployment of automated control systems, expanding District Cooling utilization as operators require unified smart grid synchronization to achieve mandated energy usage reductions.

Dive into Technavio’s robust research methodology, blending expert interviews, extensive data synthesis, and validated models for unparalleled District Cooling Market insights. See full methodology.

Market Scope
Page number 318
Base year 2025
Historic period 2020-2024
Forecast period 2026-2030
Growth momentum & CAGR Accelerate at a CAGR of 7.1%
Market growth 2026-2030 USD 13766.2 million
Market structure Fragmented
YoY growth 2025-2026(%) 6.8%
Key countries UAE, Saudi Arabia, Qatar, Kuwait, Bahrain, US, Canada, Mexico, Sweden, Finland, France, Germany, Denmark, Italy, China, Japan, South Korea, Singapore, India, Thailand, Brazil, Chile and Argentina
Competitive landscape Leading Companies, Market Positioning of Companies, Competitive Strategies, and Industry Risks

Request Free Sample

Research Analyst Overview

  • The District Cooling architecture is undergoing a profound structural evolution, shifting from basic utility provision to highly integrated thermal management. The expansion of centralized cooling networks is fundamentally altering urban infrastructure planning, allowing municipalities to decouple immediate cooling demand from real-time electrical grid capacity.
  • A critical component of this transition involves the deployment of thermal energy storage and absorption chillers, which collectively enable a 35% reduction in peak-hour electricity consumption. By leveraging insulated underground piping and variable speed drives, operators can continuously adapt fluid flow to match precise building loads.
  • Furthermore, the incorporation of IoT sensor integration empowers facility managers to utilize predictive maintenance analytics, reducing unexpected mechanical downtime by up to 20%. This technological shift directly influences boardroom-level budgeting decisions, transforming long-term capital expenditure models by extending the lifecycle of primary generation equipment.
  • These operational enhancements ensure that commercial real estate portfolios remain resilient against climate volatility while simultaneously achieving stringent environmental compliance mandates without sacrificing occupant comfort.

What are the Key Data Covered in this District Cooling Market Research and Growth Report?

  • What is the expected growth of the District Cooling Market between 2026 and 2030?

    • USD 13.77 billion, at a CAGR of 7.1%

  • What segmentation does the market report cover?

    • The report is segmented by Product Type (Electric chillers, Free cooling, and Absorption cooling), End-user (Commercial, Industrial, and Residential), Source (Fossil fuel, and Renewable energy), Technology (Chilled water systems, and Thermal energy storage) and Geography (Middle East and Africa, North America, Europe, APAC, South America)

  • Which regions are analyzed in the report?

    • Middle East and Africa, North America, Europe, APAC and South America

  • What are the key growth drivers and market challenges?

    • Rising demand for energy-efficient cooling solutions, High upfront capital investment

  • Who are the major players in the District Cooling Market?

    • Alfa Laval AB, AtkinsRealis Group Inc., Carrier Global Corp., Daikin Industries Ltd., Danfoss AS, E.ON SE, ENGIE SA, Fortum Oyj, Grundfos Holding AS, Johnson Controls International, Keppel Ltd., Mitsubishi Heavy Industries, Ramboll Group AS, Shinryo Corp., Siemens AG, Thermax Ltd., Trane Technologies plc, Vattenfall AB, Veolia Environment SA and Xylem Inc.

Market Research Insights

  • The District Cooling sector is fundamentally altering urban energy consumption models by replacing fragmented HVAC units with centralized utility networks. Municipalities are aggressively integrating these systems into smart city blueprints to enhance facility energy security and stabilize grid operations during extreme heat events.
  • This transition yields a 40% improvement in baseline electrical efficiency compared to traditional building-level chillers, directly supporting broader carbon footprint reduction targets. Furthermore, the deployment of centralized infrastructure modernization programs enables operators to achieve a 25% decrease in overall maintenance expenditures.
  • By utilizing these advanced networks, large-scale commercial complexes ensure precision temperature regulation, lowering peak energy draw by up to 30% and significantly aligning real estate portfolios with rigorous environmental compliance standards.

We can help! Our analysts can customize this district cooling market research report to meet your requirements.

Get in touch

1. Executive Summary

1.1 Market overview

Executive Summary - Chart on Market Overview
Executive Summary - Data Table on Market Overview
Executive Summary - Chart on Global Market Characteristics
Executive Summary - Chart on Market by Geography
Executive Summary - Chart on Market Segmentation by Product Type
Executive Summary - Chart on Market Segmentation by End-user
Executive Summary - Chart on Market Segmentation by Source
Executive Summary - Chart on Market Segmentation by Technology
Executive Summary - Chart on Incremental Growth
Executive Summary - Data Table on Incremental Growth
Executive Summary - Chart on Company Market Positioning

2. Technavio Analysis

2.1 Analysis of price sensitivity, lifecycle, customer purchase basket, adoption rates, and purchase criteria

2.2 Criticality of inputs and Factors of differentiation

Chart on Overview on criticality of inputs and factors of differentiation

2.3 Factors of disruption

Chart on Overview on factors of disruption

2.4 Impact of drivers and challenges

Chart on Impact of drivers and challenges in 2025 and 2030

3. Market Landscape

3.1 Market ecosystem

Chart on Parent Market
Data Table on - Parent Market

3.2 Market characteristics

Chart on Market characteristics analysis

3.3 Value chain analysis

Chart on Value chain analysis

4. Market Sizing

4.1 Market definition

Data Table on Offerings of companies included in the market definition

4.2 Market segment analysis

Market segments

4.3 Market size 2025

4.4 Market outlook: Forecast for 2025-2030

Chart on Global - Market size and forecast 2025-2030 ($ million)
Data Table on Global - Market size and forecast 2025-2030 ($ million)
Chart on Global Market: Year-over-year growth 2025-2030 (%)
Data Table on Global Market: Year-over-year growth 2025-2030 (%)

5. Historic Market Size

5.1 Global District Cooling Market 2020 - 2024

Historic Market Size - Data Table on Global District Cooling Market 2020 - 2024 ($ million)

5.2 Product Type segment analysis 2020 - 2024

Historic Market Size - Product Type Segment 2020 - 2024 ($ million)

5.3 End-user segment analysis 2020 - 2024

Historic Market Size - End-user Segment 2020 - 2024 ($ million)

5.4 Source segment analysis 2020 - 2024

Historic Market Size - Source Segment 2020 - 2024 ($ million)

5.5 Technology segment analysis 2020 - 2024

Historic Market Size - Technology Segment 2020 - 2024 ($ million)

5.6 Geography segment analysis 2020 - 2024

Historic Market Size - Geography Segment 2020 - 2024 ($ million)

5.7 Country segment analysis 2020 - 2024

Historic Market Size - Country Segment 2020 - 2024 ($ million)

6. Qualitative Analysis

6.1 Impact of AI on global district cooling market

6.2 Impact of geopolitical conflicts on global district cooling market

7. Five Forces Analysis

7.1 Five forces summary

Five forces analysis - Comparison between 2025 and 2030

7.2 Bargaining power of buyers

Bargaining power of buyers - Impact of key factors 2025 and 2030

7.3 Bargaining power of suppliers

Bargaining power of suppliers - Impact of key factors in 2025 and 2030

7.4 Threat of new entrants

Threat of new entrants - Impact of key factors in 2025 and 2030

7.5 Threat of substitutes

Threat of substitutes - Impact of key factors in 2025 and 2030

7.6 Threat of rivalry

Threat of rivalry - Impact of key factors in 2025 and 2030

7.7 Market condition

Chart on Market condition - Five forces 2025 and 2030

8. Market Segmentation by Product Type

8.1 Market segments

Chart on Product Type - Market share 2025-2030 (%)
Data Table on Product Type - Market share 2025-2030 (%)

8.2 Comparison by Product Type

Chart on Comparison by Product Type
Data Table on Comparison by Product Type

8.3 Electric chillers - Market size and forecast 2025-2030

Chart on Electric chillers - Market size and forecast 2025-2030 ($ million)
Data Table on Electric chillers - Market size and forecast 2025-2030 ($ million)
Chart on Electric chillers - Year-over-year growth 2025-2030 (%)
Data Table on Electric chillers - Year-over-year growth 2025-2030 (%)

8.4 Free cooling - Market size and forecast 2025-2030

Chart on Free cooling - Market size and forecast 2025-2030 ($ million)
Data Table on Free cooling - Market size and forecast 2025-2030 ($ million)
Chart on Free cooling - Year-over-year growth 2025-2030 (%)
Data Table on Free cooling - Year-over-year growth 2025-2030 (%)

8.5 Absorption cooling - Market size and forecast 2025-2030

Chart on Absorption cooling - Market size and forecast 2025-2030 ($ million)
Data Table on Absorption cooling - Market size and forecast 2025-2030 ($ million)
Chart on Absorption cooling - Year-over-year growth 2025-2030 (%)
Data Table on Absorption cooling - Year-over-year growth 2025-2030 (%)

8.6 Market opportunity by Product Type

Market opportunity by Product Type ($ million)
Data Table on Market opportunity by Product Type ($ million)

9. Market Segmentation by End-user

9.1 Market segments

Chart on End-user - Market share 2025-2030 (%)
Data Table on End-user - Market share 2025-2030 (%)

9.2 Comparison by End-user

Chart on Comparison by End-user
Data Table on Comparison by End-user

9.3 Commercial - Market size and forecast 2025-2030

Chart on Commercial - Market size and forecast 2025-2030 ($ million)
Data Table on Commercial - Market size and forecast 2025-2030 ($ million)
Chart on Commercial - Year-over-year growth 2025-2030 (%)
Data Table on Commercial - Year-over-year growth 2025-2030 (%)

9.4 Industrial - Market size and forecast 2025-2030

Chart on Industrial - Market size and forecast 2025-2030 ($ million)
Data Table on Industrial - Market size and forecast 2025-2030 ($ million)
Chart on Industrial - Year-over-year growth 2025-2030 (%)
Data Table on Industrial - Year-over-year growth 2025-2030 (%)

9.5 Residential - Market size and forecast 2025-2030

Chart on Residential - Market size and forecast 2025-2030 ($ million)
Data Table on Residential - Market size and forecast 2025-2030 ($ million)
Chart on Residential - Year-over-year growth 2025-2030 (%)
Data Table on Residential - Year-over-year growth 2025-2030 (%)

9.6 Market opportunity by End-user

Market opportunity by End-user ($ million)
Data Table on Market opportunity by End-user ($ million)

10. Market Segmentation by Source

10.1 Market segments

Chart on Source - Market share 2025-2030 (%)
Data Table on Source - Market share 2025-2030 (%)

10.2 Comparison by Source

Chart on Comparison by Source
Data Table on Comparison by Source

10.3 Fossil fuel - Market size and forecast 2025-2030

Chart on Fossil fuel - Market size and forecast 2025-2030 ($ million)
Data Table on Fossil fuel - Market size and forecast 2025-2030 ($ million)
Chart on Fossil fuel - Year-over-year growth 2025-2030 (%)
Data Table on Fossil fuel - Year-over-year growth 2025-2030 (%)

10.4 Renewable energy - Market size and forecast 2025-2030

Chart on Renewable energy - Market size and forecast 2025-2030 ($ million)
Data Table on Renewable energy - Market size and forecast 2025-2030 ($ million)
Chart on Renewable energy - Year-over-year growth 2025-2030 (%)
Data Table on Renewable energy - Year-over-year growth 2025-2030 (%)

10.5 Market opportunity by Source

Market opportunity by Source ($ million)
Data Table on Market opportunity by Source ($ million)

11. Market Segmentation by Technology

11.1 Market segments

Chart on Technology - Market share 2025-2030 (%)
Data Table on Technology - Market share 2025-2030 (%)

11.2 Comparison by Technology

Chart on Comparison by Technology
Data Table on Comparison by Technology

11.3 Chilled water systems - Market size and forecast 2025-2030

Chart on Chilled water systems - Market size and forecast 2025-2030 ($ million)
Data Table on Chilled water systems - Market size and forecast 2025-2030 ($ million)
Chart on Chilled water systems - Year-over-year growth 2025-2030 (%)
Data Table on Chilled water systems - Year-over-year growth 2025-2030 (%)

11.4 Thermal energy storage - Market size and forecast 2025-2030

Chart on Thermal energy storage - Market size and forecast 2025-2030 ($ million)
Data Table on Thermal energy storage - Market size and forecast 2025-2030 ($ million)
Chart on Thermal energy storage - Year-over-year growth 2025-2030 (%)
Data Table on Thermal energy storage - Year-over-year growth 2025-2030 (%)

11.5 Market opportunity by Technology

Market opportunity by Technology ($ million)
Data Table on Market opportunity by Technology ($ million)

12. Customer Landscape

12.1 Customer landscape overview

Analysis of price sensitivity, lifecycle, customer purchase basket, adoption rates, and purchase criteria

13. Geographic Landscape

13.1 Geographic segmentation

Chart on Market share by geography 2025-2030 (%)
Data Table on Market share by geography 2025-2030 (%)

13.2 Geographic comparison

Chart on Geographic comparison
Data Table on Geographic comparison

13.3 Middle East and Africa - Market size and forecast 2025-2030

Chart on Middle East and Africa - Market size and forecast 2025-2030 ($ million)
Data Table on Middle East and Africa - Market size and forecast 2025-2030 ($ million)
Chart on Middle East and Africa - Year-over-year growth 2025-2030 (%)
Data Table on Middle East and Africa - Year-over-year growth 2025-2030 (%)
Chart on Regional Comparison - Middle East and Africa
Data Table on Regional Comparison - Middle East and Africa

13.3.1 UAE - Market size and forecast 2025-2030

Chart on UAE - Market size and forecast 2025-2030 ($ million)
Data Table on UAE - Market size and forecast 2025-2030 ($ million)
Chart on UAE - Year-over-year growth 2025-2030 (%)
Data Table on UAE - Year-over-year growth 2025-2030 (%)

13.3.2 Saudi Arabia - Market size and forecast 2025-2030

Chart on Saudi Arabia - Market size and forecast 2025-2030 ($ million)
Data Table on Saudi Arabia - Market size and forecast 2025-2030 ($ million)
Chart on Saudi Arabia - Year-over-year growth 2025-2030 (%)
Data Table on Saudi Arabia - Year-over-year growth 2025-2030 (%)

13.3.3 Qatar - Market size and forecast 2025-2030

Chart on Qatar - Market size and forecast 2025-2030 ($ million)
Data Table on Qatar - Market size and forecast 2025-2030 ($ million)
Chart on Qatar - Year-over-year growth 2025-2030 (%)
Data Table on Qatar - Year-over-year growth 2025-2030 (%)

13.3.4 Kuwait - Market size and forecast 2025-2030

Chart on Kuwait - Market size and forecast 2025-2030 ($ million)
Data Table on Kuwait - Market size and forecast 2025-2030 ($ million)
Chart on Kuwait - Year-over-year growth 2025-2030 (%)
Data Table on Kuwait - Year-over-year growth 2025-2030 (%)

13.3.5 Bahrain - Market size and forecast 2025-2030

Chart on Bahrain - Market size and forecast 2025-2030 ($ million)
Data Table on Bahrain - Market size and forecast 2025-2030 ($ million)
Chart on Bahrain - Year-over-year growth 2025-2030 (%)
Data Table on Bahrain - Year-over-year growth 2025-2030 (%)

13.4 North America - Market size and forecast 2025-2030

Chart on North America - Market size and forecast 2025-2030 ($ million)
Data Table on North America - Market size and forecast 2025-2030 ($ million)
Chart on North America - Year-over-year growth 2025-2030 (%)
Data Table on North America - Year-over-year growth 2025-2030 (%)
Chart on Regional Comparison - North America
Data Table on Regional Comparison - North America

13.4.1 US - Market size and forecast 2025-2030

Chart on US - Market size and forecast 2025-2030 ($ million)
Data Table on US - Market size and forecast 2025-2030 ($ million)
Chart on US - Year-over-year growth 2025-2030 (%)
Data Table on US - Year-over-year growth 2025-2030 (%)

13.4.2 Canada - Market size and forecast 2025-2030

Chart on Canada - Market size and forecast 2025-2030 ($ million)
Data Table on Canada - Market size and forecast 2025-2030 ($ million)
Chart on Canada - Year-over-year growth 2025-2030 (%)
Data Table on Canada - Year-over-year growth 2025-2030 (%)

13.4.3 Mexico - Market size and forecast 2025-2030

Chart on Mexico - Market size and forecast 2025-2030 ($ million)
Data Table on Mexico - Market size and forecast 2025-2030 ($ million)
Chart on Mexico - Year-over-year growth 2025-2030 (%)
Data Table on Mexico - Year-over-year growth 2025-2030 (%)

13.5 Europe - Market size and forecast 2025-2030

Chart on Europe - Market size and forecast 2025-2030 ($ million)
Data Table on Europe - Market size and forecast 2025-2030 ($ million)
Chart on Europe - Year-over-year growth 2025-2030 (%)
Data Table on Europe - Year-over-year growth 2025-2030 (%)
Chart on Regional Comparison - Europe
Data Table on Regional Comparison - Europe

13.5.1 Sweden - Market size and forecast 2025-2030

Chart on Sweden - Market size and forecast 2025-2030 ($ million)
Data Table on Sweden - Market size and forecast 2025-2030 ($ million)
Chart on Sweden - Year-over-year growth 2025-2030 (%)
Data Table on Sweden - Year-over-year growth 2025-2030 (%)

13.5.2 Finland - Market size and forecast 2025-2030

Chart on Finland - Market size and forecast 2025-2030 ($ million)
Data Table on Finland - Market size and forecast 2025-2030 ($ million)
Chart on Finland - Year-over-year growth 2025-2030 (%)
Data Table on Finland - Year-over-year growth 2025-2030 (%)

13.5.3 France - Market size and forecast 2025-2030

Chart on France - Market size and forecast 2025-2030 ($ million)
Data Table on France - Market size and forecast 2025-2030 ($ million)
Chart on France - Year-over-year growth 2025-2030 (%)
Data Table on France - Year-over-year growth 2025-2030 (%)

13.5.4 Germany - Market size and forecast 2025-2030

Chart on Germany - Market size and forecast 2025-2030 ($ million)
Data Table on Germany - Market size and forecast 2025-2030 ($ million)
Chart on Germany - Year-over-year growth 2025-2030 (%)
Data Table on Germany - Year-over-year growth 2025-2030 (%)

13.5.5 Denmark - Market size and forecast 2025-2030

Chart on Denmark - Market size and forecast 2025-2030 ($ million)
Data Table on Denmark - Market size and forecast 2025-2030 ($ million)
Chart on Denmark - Year-over-year growth 2025-2030 (%)
Data Table on Denmark - Year-over-year growth 2025-2030 (%)

13.5.6 Italy - Market size and forecast 2025-2030

Chart on Italy - Market size and forecast 2025-2030 ($ million)
Data Table on Italy - Market size and forecast 2025-2030 ($ million)
Chart on Italy - Year-over-year growth 2025-2030 (%)
Data Table on Italy - Year-over-year growth 2025-2030 (%)

13.6 APAC - Market size and forecast 2025-2030

Chart on APAC - Market size and forecast 2025-2030 ($ million)
Data Table on APAC - Market size and forecast 2025-2030 ($ million)
Chart on APAC - Year-over-year growth 2025-2030 (%)
Data Table on APAC - Year-over-year growth 2025-2030 (%)
Chart on Regional Comparison - APAC
Data Table on Regional Comparison - APAC

13.6.1 China - Market size and forecast 2025-2030

Chart on China - Market size and forecast 2025-2030 ($ million)
Data Table on China - Market size and forecast 2025-2030 ($ million)
Chart on China - Year-over-year growth 2025-2030 (%)
Data Table on China - Year-over-year growth 2025-2030 (%)

13.6.2 Japan - Market size and forecast 2025-2030

Chart on Japan - Market size and forecast 2025-2030 ($ million)
Data Table on Japan - Market size and forecast 2025-2030 ($ million)
Chart on Japan - Year-over-year growth 2025-2030 (%)
Data Table on Japan - Year-over-year growth 2025-2030 (%)

13.6.3 South Korea - Market size and forecast 2025-2030

Chart on South Korea - Market size and forecast 2025-2030 ($ million)
Data Table on South Korea - Market size and forecast 2025-2030 ($ million)
Chart on South Korea - Year-over-year growth 2025-2030 (%)
Data Table on South Korea - Year-over-year growth 2025-2030 (%)

13.6.4 Singapore - Market size and forecast 2025-2030

Chart on Singapore - Market size and forecast 2025-2030 ($ million)
Data Table on Singapore - Market size and forecast 2025-2030 ($ million)
Chart on Singapore - Year-over-year growth 2025-2030 (%)
Data Table on Singapore - Year-over-year growth 2025-2030 (%)

13.6.5 India - Market size and forecast 2025-2030

Chart on India - Market size and forecast 2025-2030 ($ million)
Data Table on India - Market size and forecast 2025-2030 ($ million)
Chart on India - Year-over-year growth 2025-2030 (%)
Data Table on India - Year-over-year growth 2025-2030 (%)

13.6.6 Thailand - Market size and forecast 2025-2030

Chart on Thailand - Market size and forecast 2025-2030 ($ million)
Data Table on Thailand - Market size and forecast 2025-2030 ($ million)
Chart on Thailand - Year-over-year growth 2025-2030 (%)
Data Table on Thailand - Year-over-year growth 2025-2030 (%)

13.7 South America - Market size and forecast 2025-2030

Chart on South America - Market size and forecast 2025-2030 ($ million)
Data Table on South America - Market size and forecast 2025-2030 ($ million)
Chart on South America - Year-over-year growth 2025-2030 (%)
Data Table on South America - Year-over-year growth 2025-2030 (%)
Chart on Regional Comparison - South America
Data Table on Regional Comparison - South America

13.7.1 Brazil - Market size and forecast 2025-2030

Chart on Brazil - Market size and forecast 2025-2030 ($ million)
Data Table on Brazil - Market size and forecast 2025-2030 ($ million)
Chart on Brazil - Year-over-year growth 2025-2030 (%)
Data Table on Brazil - Year-over-year growth 2025-2030 (%)

13.7.2 Chile - Market size and forecast 2025-2030

Chart on Chile - Market size and forecast 2025-2030 ($ million)
Data Table on Chile - Market size and forecast 2025-2030 ($ million)
Chart on Chile - Year-over-year growth 2025-2030 (%)
Data Table on Chile - Year-over-year growth 2025-2030 (%)

13.7.3 Argentina - Market size and forecast 2025-2030

Chart on Argentina - Market size and forecast 2025-2030 ($ million)
Data Table on Argentina - Market size and forecast 2025-2030 ($ million)
Chart on Argentina - Year-over-year growth 2025-2030 (%)
Data Table on Argentina - Year-over-year growth 2025-2030 (%)

13.8 Market opportunity by geography

Market opportunity by geography ($ million)
Data Tables on Market opportunity by geography ($ million)

14. Drivers, Challenges, and Opportunity

14.1 Market drivers

Rising demand for energy-efficient cooling solutions
Supportive government policies and sustainability mandates
Growth of large-scale commercial and residential developments

14.2 Market challenges

High upfront capital investment
Regulatory hurdles and lack of standardized frameworks
Technical and urban planning integration barriers

14.3 Impact of drivers and challenges

Impact of drivers and challenges in 2025 and 2030

14.4 Market opportunities

Digitalization and smart grid integration
Advancement in low-carbon and renewable cooling technologies
Expansion of thermal energy storage infrastructure

15. Competitive Landscape

15.1 Overview

15.2

Overview on criticality of inputs and factors of differentiation

15.3 Landscape disruption

Overview on factors of disruption

15.4 Industry risks

Impact of key risks on business

16. Competitive Analysis

16.1 Companies profiled

Companies covered

16.2 Company ranking index

16.3 Market positioning of companies

Matrix on companies position and classification

16.4 Alfa Laval AB

Alfa Laval AB - Overview
Alfa Laval AB - Business segments
Alfa Laval AB - Key news
Alfa Laval AB - Key offerings
Alfa Laval AB - Segment focus
SWOT

16.5 Carrier Global Corp.

Carrier Global Corp. - Overview
Carrier Global Corp. - Business segments
Carrier Global Corp. - Key news
Carrier Global Corp. - Key offerings
Carrier Global Corp. - Segment focus
SWOT

16.6 Daikin Industries Ltd.

Daikin Industries Ltd. - Overview
Daikin Industries Ltd. - Business segments
Daikin Industries Ltd. - Key news
Daikin Industries Ltd. - Key offerings
Daikin Industries Ltd. - Segment focus
SWOT

16.7 Danfoss AS

Danfoss AS - Overview
Danfoss AS - Product / Service
Danfoss AS - Key offerings
SWOT

16.8 E.ON SE

E.ON SE - Overview
E.ON SE - Business segments
E.ON SE - Key offerings
E.ON SE - Segment focus
SWOT

16.9 ENGIE SA

ENGIE SA - Overview
ENGIE SA - Business segments
ENGIE SA - Key news
ENGIE SA - Key offerings
ENGIE SA - Segment focus
SWOT

16.10 Fortum Oyj

Fortum Oyj - Overview
Fortum Oyj - Business segments
Fortum Oyj - Key offerings
Fortum Oyj - Segment focus
SWOT

16.11 Grundfos Holding AS

Grundfos Holding AS - Overview
Grundfos Holding AS - Product / Service
Grundfos Holding AS - Key offerings
SWOT

16.12 Johnson Controls International

Johnson Controls International - Overview
Johnson Controls International - Business segments
Johnson Controls International - Key news
Johnson Controls International - Key offerings
Johnson Controls International - Segment focus
SWOT

16.13 Mitsubishi Heavy Industries

Mitsubishi Heavy Industries - Overview
Mitsubishi Heavy Industries - Business segments
Mitsubishi Heavy Industries - Key news
Mitsubishi Heavy Industries - Key offerings
Mitsubishi Heavy Industries - Segment focus
SWOT

16.14 Siemens AG

Siemens AG - Overview
Siemens AG - Business segments
Siemens AG - Key news
Siemens AG - Key offerings
Siemens AG - Segment focus
SWOT

16.15 Trane Technologies plc

Trane Technologies plc - Overview
Trane Technologies plc - Business segments
Trane Technologies plc - Key news
Trane Technologies plc - Key offerings
Trane Technologies plc - Segment focus
SWOT

16.16 Vattenfall AB

Vattenfall AB - Overview
Vattenfall AB - Product / Service
Vattenfall AB - Key offerings
SWOT

16.17 Veolia Environment SA

Veolia Environment SA - Overview
Veolia Environment SA - Business segments
Veolia Environment SA - Key news
Veolia Environment SA - Key offerings
Veolia Environment SA - Segment focus
SWOT

16.18 Xylem Inc.

Xylem Inc. - Overview
Xylem Inc. - Business segments
Xylem Inc. - Key news
Xylem Inc. - Key offerings
Xylem Inc. - Segment focus
SWOT

17. Appendix

17.1 Scope of the report

Market definition
Objectives
Notes and caveats

17.2 Inclusions and exclusions checklist

Inclusions checklist
Exclusions checklist

17.3 Currency conversion rates for US$

17.4 Research methodology

17.5 Data procurement

Information sources

17.6 Data validation

17.7 Validation techniques employed for market sizing

17.8 Data synthesis

17.9 360 degree market analysis

17.10 List of abbreviations

Research Methodology

Technavio presents a detailed picture of the market by way of study, synthesis, and summation of data from multiple sources. The analysts have presented the various facets of the market with a particular focus on identifying the key industry influencers. The data thus presented is comprehensive, reliable, and the result of extensive research, both primary and secondary.

INFORMATION SOURCES

Primary sources

  • Manufacturers and suppliers
  • Channel partners
  • Industry experts
  • Strategic decision makers

Secondary sources

  • Industry journals and periodicals
  • Government data
  • Financial reports of key industry players
  • Historical data
  • Press releases

DATA ANALYSIS

Data Synthesis

  • Collation of data
  • Estimation of key figures
  • Analysis of derived insights

Data Validation

  • Triangulation with data models
  • Reference against proprietary databases
  • Corroboration with industry experts

REPORT WRITING

Qualitative

  • Market drivers
  • Market challenges
  • Market trends
  • Five forces analysis

Quantitative

  • Market size and forecast
  • Market segmentation
  • Geographical insights
  • Competitive landscape

Interested in this report?

Get your sample now to see our research methodology and insights!

Download Now

Frequently Asked Questions

District Cooling market growth will increase by USD 13766.2 million during 2026-2030.

The District Cooling market is expected to grow at a CAGR of 7.1% during 2026-2030.

District Cooling market is segmented by Product type (Electric chillers, Free cooling, Absorption cooling) End-user (Commercial, Industrial, Residential) Source (Fossil fuel, Renewable energy) Technology (Chilled water systems, Thermal energy storage)

Alfa Laval AB, AtkinsRealis Group Inc., Carrier Global Corp., Daikin Industries Ltd., Danfoss AS, E.ON SE, ENGIE SA, Fortum Oyj, Grundfos Holding AS, Johnson Controls International, Keppel Ltd., Mitsubishi Heavy Industries, Ramboll Group AS, Shinryo Corp., Siemens AG, Thermax Ltd., Trane Technologies plc, Vattenfall AB, Veolia Environment SA, Xylem Inc. are a few of the key vendors in the District Cooling market.

Middle East and Africa will register the highest growth rate of 43.8% among the other regions. Therefore, the District Cooling market in Middle East and Africa is expected to garner significant business opportunities for the vendors during the forecast period.

UAE, Saudi Arabia, Qatar, Kuwait, Bahrain, US, Canada, Mexico, Sweden, Finland, France, Germany, Denmark, Italy, China, Japan, South Korea, Singapore, India, Thailand, Brazil, Chile, Argentina

  • Rising demand for energy-efficient cooling solutions is the driving factor this market.

The District Cooling market vendors should focus on grabbing business opportunities from the Product type segment as it accounted for the largest market share in the base year.
RIA - Research AI Assistant
Ask RIA
