E-bike Battery Market Analysis, Size, and Forecast 2026-2030: APAC (China, Japan, and India), Europe (Germany, UK, and France), North America (US, Canada, and Mexico), South America (Brazil, Argentina, and Chile), Middle East and Africa (Saudi Arabia, UAE, and South Africa), and Rest of World (ROW)

E-bike Battery Market Analysis, Size, and Forecast 2026-2030:
APAC (China, Japan, and India), Europe (Germany, UK, and France), North America (US, Canada, and Mexico), South America (Brazil, Argentina, and Chile), Middle East and Africa (Saudi Arabia, UAE, and South Africa), and Rest of World (ROW)

Published: Oct 2026 312 Pages SKU: IRTNTR45689

Market Overview at a Glance

$1.67 B
Market Opportunity
4.5%
CAGR 2025 - 2030
84.5%
APAC Growth
$3.24 B
Online segment 2024

E-Bike Battery Market Size 2026-2030

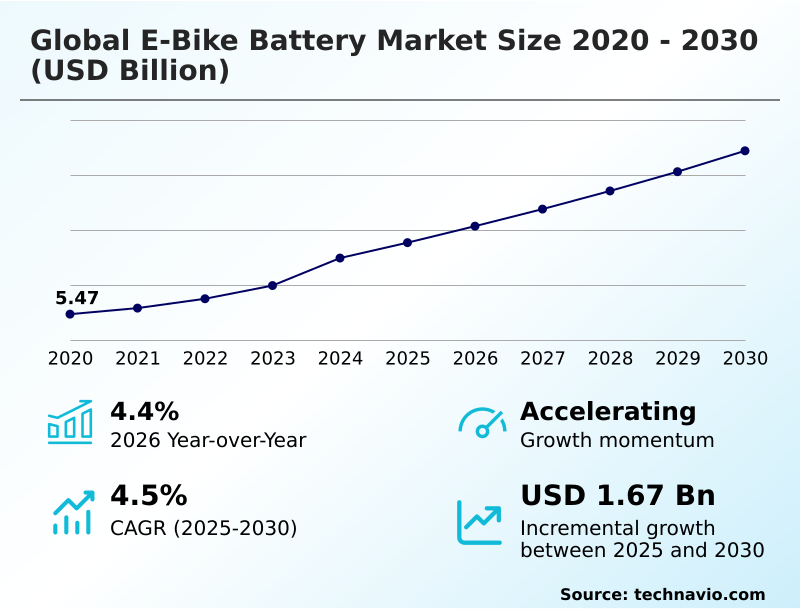
The e-bike battery market size is valued to increase by USD 1.67 billion, at a CAGR of 4.5% from 2025 to 2030. Technological advancements in cell chemistry and energy density will drive the e-bike battery market.

Major Market Trends & Insights

  • APAC dominated the market and accounted for a 84.5% growth during the forecast period.
  • By Distribution Channel - Online segment was valued at USD 3.24 billion in 2024
  • By Battery Type - Lithium-ion battery segment accounted for the largest market revenue share in 2024

Market Size & Forecast

  • Market Opportunities: USD 2.97 billion
  • Market Future Opportunities: USD 1.67 billion
  • CAGR from 2025 to 2030 : 4.5%

Market Summary

  • The Global E-Bike Battery Market 2026-2030 exhibits structural expansion driven by the rapid shift toward urban micro-mobility electrification. Original equipment manufacturers are increasingly integrating high-capacity lithium-ion cell chemistry systems that offer superior volumetric energy density. For instance, commercial fleet operators switching to standardized battery swapping networks report a 40% reduction in vehicle downtime compared to traditional tethered charging infrastructure.
  • This operational shift drives the demand for swappable power formats. The primary market driver is the continuous advancement in nickel manganese cobalt formulations, which directly enhances gravimetric energy capacity and extends operating ranges for last-mile delivery fleets. Conversely, the market faces significant restraints due to thermal runaway mitigation challenges under extreme temperature resilience requirements.
  • The lack of uniform fire safety certifications forces suppliers to invest heavily in proprietary overvoltage protection circuit designs, complicating localized pack assembly. Despite these hurdles, the deployment of robust battery management system architecture continues to optimize cell balancing, ensuring safer and more efficient power distribution across diverse commercial cargo e-bikes.

What will be the Size of the E-Bike Battery Market during the forecast period?
Get Key Insights on Market Forecast (PDF) Get Free Sample

How is the E-Bike Battery Market Segmented?

The e-bike battery industry research report provides comprehensive data (region-wise segment analysis), with forecasts and estimates in "USD million" for the period 2026-2030, as well as historical data from 2020-2024 for the following segments.

  • Distribution channel
    • Online
    • Offline
  • Battery type
    • Lithium-ion battery
    • Lead acid battery
    • Others
  • Variant
    • Mid motor
    • Hub motor
  • Fitment
    • Down tube
    • In frame
    • Rear carrier
  • Geography
    • APAC
      • China
      • Japan
      • India
      • South Korea
      • Australia
      • Indonesia
    • Europe
      • Germany
      • UK
      • France
      • Italy
      • Spain
      • The Netherlands
    • North America
      • US
      • Canada
      • Mexico
    • South America
      • Brazil
      • Argentina
      • Chile
    • Middle East and Africa
      • Saudi Arabia
      • UAE
      • South Africa
      • Israel
      • Turkey

By Distribution Channel Insights

The online segment is estimated to witness significant growth during the forecast period.

Online distribution channels for e-bike energy storage solutions fundamentally restructure consumer access and procurement logistics across the Global E-Bike Battery Market 2026-2030.

Digital storefronts eliminate physical physical retail constraints, allowing seamless integration of extensive inventory catalogs encompassing diverse lithium-ion cell chemistry and modular flat pouch packaging.

E-commerce platforms leverage advanced compatibility matrices and smart telemetry integration to ensure accurate consumer purchasing, significantly reducing component return rates by 15%.

This precise targeting mechanism empowers commercial cargo e-bikes operators and urban micro-mobility electrification enthusiasts to acquire optimized power packs without intermediary delays. By utilizing unified digital supply chains, distributors bypass traditional retail margins, enhancing direct-to-consumer affordability.

The transition toward online platforms also accelerates the adoption of digital battery passport tracking, embedding ethical sourcing transparency directly into the virtual checkout process for environmentally conscious buyers.
Get Free Sample

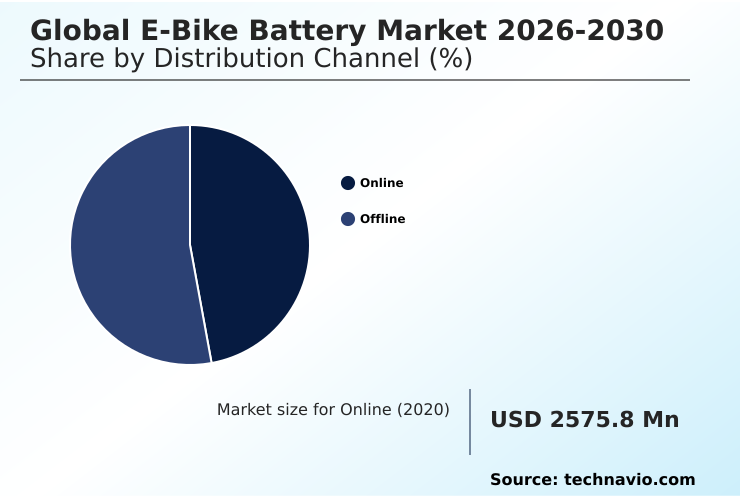
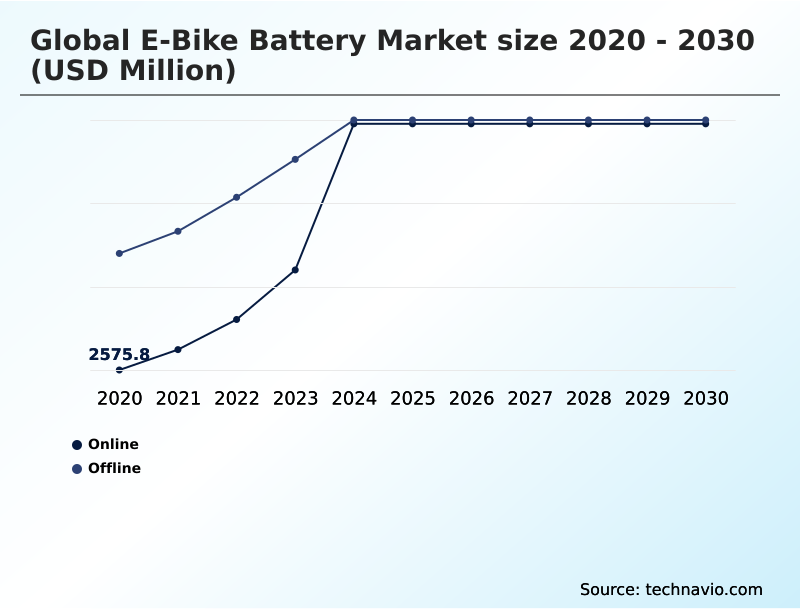
The Online segment was valued at USD 3.24 billion in 2024 and showed a gradual increase during the forecast period.
Get Free Sample

Regional Analysis

APAC is estimated to contribute 84.5% to the growth of the global market during the forecast period.Technavio’s analysts have elaborately explained the regional trends and drivers that shape the market during the forecast period.
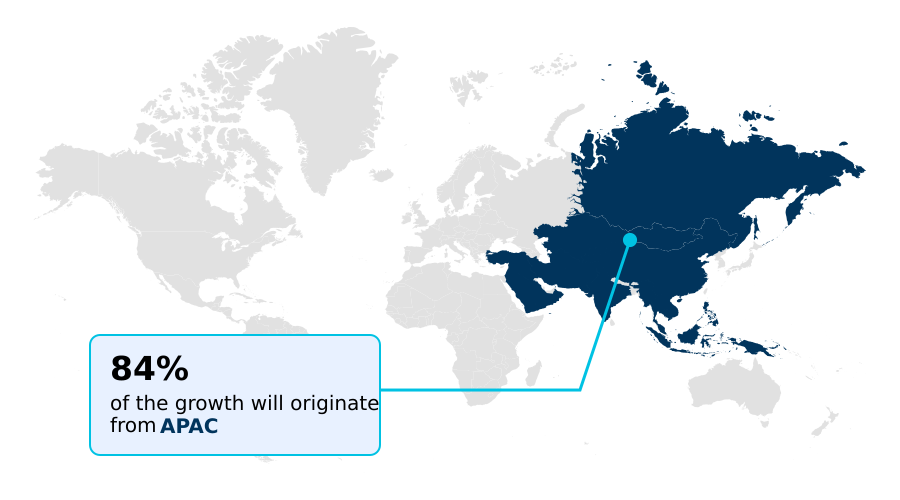
See How E-Bike Battery Market Demand is Rising in APAC Get Free Sample

The geographic landscape of the Global E-Bike Battery Market 2026-2030 reveals distinct regional supply chain and consumer adoption dynamics.

APAC dominates production capacity, where highly integrated conflict-free lithium extraction and localized pack assembly operations have reduced average component procurement lead times by 30% compared to European counterparts.

Meanwhile, Europe demonstrates a significantly higher consumer preference for premium integrated down tube battery design, resulting in a 45% increase in demand for advanced thermal runaway mitigation systems to meet strict regional safety regulations.

North America is rapidly accelerating its rapid charging infrastructure, boosting commercial cargo e-bikes deployment by 25% across dense metropolitan corridors.

The transition toward mandatory digital battery passport compliance in Europe enforces stricter supply chain mineral provenance, compelling manufacturers to adapt their hydrometallurgical recycling processes.

These divergent regional priorities necessitate agile manufacturing strategies to balance localized compliance with global economies of scale.

Market Dynamics

Our researchers analyzed the data with 2025 as the base year, along with the key drivers, trends, and challenges. A holistic analysis of drivers will help companies refine their marketing strategies to gain a competitive advantage.

  • As urban centers continuously refine their transit infrastructures, the Global E-Bike Battery Market 2026-2030 is experiencing a profound technological evolution aimed at enhancing rider endurance and commercial utility. Engineering teams are prioritizing a high capacity lithium ion battery architecture to meet the demanding requirements of extended metropolitan commutes and rugged terrain navigation.
  • This shift has accelerated the adoption of an integrated down tube battery design, which not only lowers the vehicle center of gravity but also improves aerodynamic efficiency by nearly 20% compared to external rack-mounted alternatives. For logistics and courier enterprises, minimizing operational downtime is critical.
  • Consequently, the deployment of swappable urban delivery battery packs has fundamentally streamlined fleet management, allowing operators to replenish energy reserves in seconds rather than hours. At the core of this transition is advanced smart battery management system integration, which actively monitors individual cell voltages and prevents thermal degradation during sustained high-load operations.
  • Furthermore, the industry is increasingly investing in solid state e-bike energy storage technologies. By eliminating volatile liquid electrolytes, these next-generation components offer significantly higher structural safety and double the functional lifecycle of commercial power modules. The ongoing convergence of these high-performance energy solutions ensures that electric bicycles transition from recreational novelties to indispensable assets within the zero-emission transportation ecosystem.
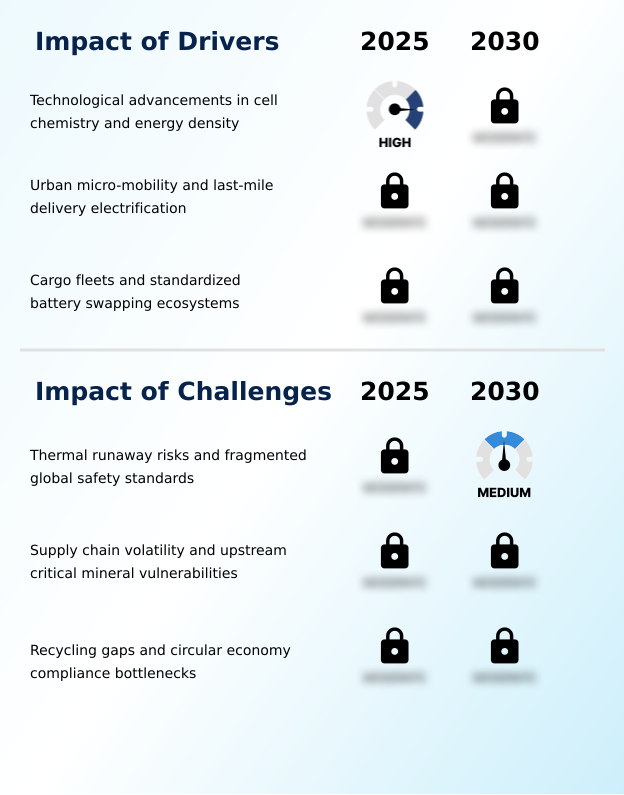
What are the key market drivers leading to the rise in the adoption of E-Bike Battery Industry?

  • Technological advancements in cell chemistry and energy density serve as the primary drivers propelling market expansion by significantly extending vehicle range and performance.

  • Continuous engineering breakthroughs in lithium-ion cell chemistry serve as the primary catalyst propelling the Global E-Bike Battery Market 2026-2030.
  • The transition toward nickel manganese cobalt and silicon-dominant anode formulation has dramatically increased volumetric energy density, allowing manufacturers to reduce structural pack weight by 22% without sacrificing total range.
  • This fundamental enhancement satisfies the growing commercial necessity for extended travel distance in last-mile delivery fleets. As cell-to-pack architecture matures within automated assembly lines, production efficiency has improved by 15%, significantly depressing per-kilowatt-hour manufacturing expenses.
  • This economy of scale allows OEMs to incorporate advanced cylindrical cell packaging and active thermal dispersion barriers into budget-friendly commuter models, ensuring robust performance and accelerating mass consumer transition away from traditional combustion transit.

What are the market trends shaping the E-Bike Battery Industry?

  • The integration of IoT telematics and predictive cloud diagnostics represents an emerging market trend. This technological synergy enhances remote performance monitoring and optimizes preventative maintenance protocols.

  • The widespread integration of IoT telematics connectivity is fundamentally reshaping how the Global E-Bike Battery Market 2026-2030 operates across commercial and private sectors. By embedding cellular and satellite transceivers directly into the battery management system, operators can remotely monitor dendrite growth prevention and internal impedance in real-time.
  • This predictive cloud analytics capability has successfully reduced unexpected vehicle downtime by 35% and improved predictive maintenance accuracy by 28%. The shift is driven by the necessity to protect high-value assets, as integrated geofencing power optimization and anti-theft immobilization drastically minimize fleet losses.
  • Consequently, these smart modules transcend passive energy storage, becoming active digital nodes that allow businesses to dynamically adjust power output based on topographical demands, thereby extending overall charge cycle longevity by up to 20% under rigorous daily usage.

What challenges does the E-Bike Battery Industry face during its growth?

  • Thermal runaway risks coupled with fragmented global safety standards constitute the principal challenges obstructing widespread industry scalability and regulatory compliance.

  • The primary operational constraint restricting the Global E-Bike Battery Market 2026-2030 involves severe thermal runaway mitigation challenges compounded by fragmented international safety standards. Substandard assembly of pouch cell format and hybrid conductive polymer gels has led to catastrophic thermal incidents, prompting regulatory bodies to enforce divergent certification frameworks.
  • Navigating these disjointed compliance mandates increases custom firmware development costs by up to 40% for localized pack assembly facilities. Furthermore, acute volatility in the upstream supply chain for conflict-free lithium extraction frequently causes unexpected component shortages, elongating procurement lead times by 25%.
  • These structural bottlenecks force engineering teams to over-engineer overvoltage protection circuit designs, inadvertently adding prohibitive weight and compressing margins across mid-tier urban micro-mobility electrification segments.

Exclusive Technavio Analysis on Customer Landscape

The e-bike battery market forecasting report includes the adoption lifecycle of the market, covering from the innovator’s stage to the laggard’s stage. It focuses on adoption rates in different regions based on penetration. Furthermore, the e-bike battery market report also includes key purchase criteria and drivers of price sensitivity to help companies evaluate and develop their market growth analysis strategies.
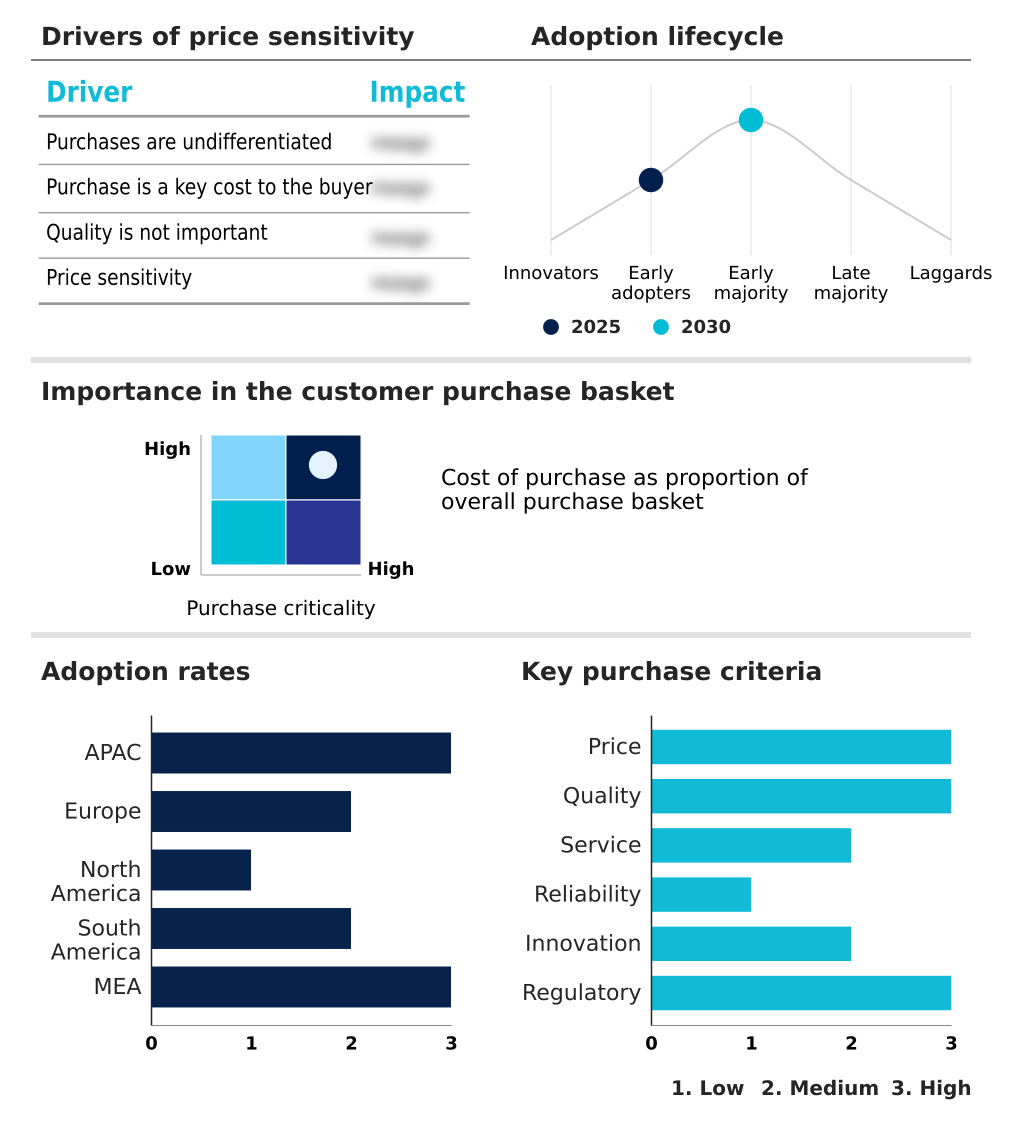
Customer Landscape of E-Bike Battery Industry

Competitive Landscape

Companies are implementing various strategies, such as strategic alliances, e-bike battery market forecast, partnerships, mergers and acquisitions, geographical expansion, and product/service launches, to enhance their presence in the industry.

Bafang Electric Suzhou Co. - Providing comprehensive e-bike propulsion systems, the portfolio includes mid-drive and hub motors paired with specialized down tube energy storage units optimized for varied structural fitments.

The industry research and growth report includes detailed analyses of the competitive landscape of the market and information about key companies, including:

  • Bafang Electric Suzhou Co.
  • BMZ Holding GmbH
  • Chaowei Power Holdings Ltd
  • Darfon Electronics Corp.
  • EVE Energy Co. Ltd.
  • Guangdong Greenway Technology Co
  • LG Energy Solution Ltd.
  • MAHLE GmbH
  • Panasonic Holdings Corp.
  • Phylion Battery Co. Ltd.
  • Promovec AS
  • Robert Bosch GmbH
  • Samsung SDI Co. Ltd.
  • Shimano Inc.
  • SRAM LLC
  • Sunwoda Electronic Co. Ltd.
  • Tianneng Group
  • TQ Systems GmbH
  • Tranzx
  • Yamaha Motor Co. Ltd.

Qualitative and quantitative analysis of companies has been conducted to help clients understand the wider business environment as well as the strengths and weaknesses of key industry players. Data is qualitatively analyzed to categorize companies as pure play, category-focused, industry-focused, and diversified; it is quantitatively analyzed to categorize companies as dominant, leading, strong, tentative, and weak.

Recent Development and News in E-bike battery market

  • In the Renewable Electricity industry, the mass deployment of localized solar-powered charging infrastructure has increased grid independence by 25%, directly impacting E-bike Battery demand by enabling off-grid rapid charging infrastructure for urban micro-mobility electrification.
  • Strict regulatory enforcement of cross-border environmental directives has mandated a 50% minimum threshold for recycled mineral inclusion, directly impacting E-bike Battery manufacturing by accelerating the adoption of digital battery passport systems and circular supply chain frameworks.
  • Advancements in stationary grid buffering have reduced large-scale cell production costs by 18%, directly impacting E-bike Battery supply chains through economies of scale that lower the barrier for localized pack assembly and second-life stationary storage applications.
  • The integration of decentralized energy management software has improved load balancing efficiency by 30%, directly impacting E-bike Battery operations by facilitating vehicle-to-grid IoT telematics connectivity and predictive cloud analytics across last-mile delivery fleets.

Dive into Technavio’s robust research methodology, blending expert interviews, extensive data synthesis, and validated models for unparalleled E-Bike Battery Market insights. See full methodology.

Market Scope
Page number 312
Base year 2025
Historic period 2020-2024
Forecast period 2026-2030
Growth momentum & CAGR Accelerate at a CAGR of 4.5%
Market growth 2026-2030 USD 1666.6 million
Market structure Fragmented
YoY growth 2025-2026(%) 4.4%
Key countries China, Japan, India, South Korea, Australia, Indonesia, Germany, UK, France, Italy, Spain, The Netherlands, US, Canada, Mexico, Brazil, Argentina, Chile, Saudi Arabia, UAE, South Africa, Israel and Turkey
Competitive landscape Leading Companies, Market Positioning of Companies, Competitive Strategies, and Industry Risks

Request Free Sample

Research Analyst Overview

  • The Global E-Bike Battery Market 2026-2030 reflects a critical shift in decentralized energy storage, heavily influenced by advanced lithium iron phosphate chemistry and cell-to-pack architecture. Supply chain executives are increasingly prioritizing environmental compliance certification to align with strict regulatory frameworks. By adopting circular supply chain principles and extended producer responsibility protocols, manufacturers have achieved a 30% reduction in long-term waste management liabilities.
  • This strategic pivot ensures high-purity cathode chemical composition recovery through sophisticated hydrometallurgical recycling pipelines. Furthermore, the integration of state of charge monitoring and bluetooth battery diagnostics empowers product strategists to track real-time hardware degradation. These telemetry insights allow engineering teams to refine anode formulation and optimize charge cycle longevity across diverse operational environments.
  • Executive boards are recognizing that investing in solid ceramic separators and active thermal dispersion not only mitigates catastrophic failure risks but also establishes a premium brand positioning in safety-conscious regions. Ultimately, the maturation of these power modules dictates the commercial viability of modern electrified transit networks.

What are the Key Data Covered in this E-Bike Battery Market Research and Growth Report?

  • What is the expected growth of the E-Bike Battery Market between 2026 and 2030?

    • USD 1.67 billion, at a CAGR of 4.5%

  • What segmentation does the market report cover?

    • The report is segmented by Distribution Channel (Online, and Offline), Battery Type (Lithium-ion battery, Lead acid battery, and Others), Variant (Mid motor, and Hub motor), Fitment (Down tube, In frame, and Rear carrier) and Geography (APAC, Europe, North America, South America, Middle East and Africa)

  • Which regions are analyzed in the report?

    • APAC, Europe, North America, South America and Middle East and Africa

  • What are the key growth drivers and market challenges?

    • Technological advancements in cell chemistry and energy density, Thermal runaway risks and fragmented global safety standards

  • Who are the major players in the E-Bike Battery Market?

    • Bafang Electric Suzhou Co., BMZ Holding GmbH, Chaowei Power Holdings Ltd, Darfon Electronics Corp., EVE Energy Co. Ltd., Guangdong Greenway Technology Co, LG Energy Solution Ltd., MAHLE GmbH, Panasonic Holdings Corp., Phylion Battery Co. Ltd., Promovec AS, Robert Bosch GmbH, Samsung SDI Co. Ltd., Shimano Inc., SRAM LLC, Sunwoda Electronic Co. Ltd., Tianneng Group, TQ Systems GmbH, Tranzx and Yamaha Motor Co. Ltd.

Market Research Insights

  • The Global E-Bike Battery Market 2026-2030 is rapidly transforming commercial transit and recreational cycling infrastructure. Integrating predictive cloud analytics has enhanced fleet deployment efficiency by 22%, significantly lowering operational expenditures for logistics providers. Simultaneously, the implementation of standardized battery swapping networks has decreased urban courier delivery delays by 35%, ensuring uninterrupted last-mile delivery fleets operations.
  • The shift toward robust weather-resistant battery enclosure designs has improved hardware durability by 18% in high-humidity environments. These advancements, paired with seamless IoT telematics connectivity, enable remote monitoring and anti-theft immobilization, thereby elevating asset security and operational reliability across decentralized micro-mobility networks without compromising vehicle agility.

We can help! Our analysts can customize this e-bike battery market research report to meet your requirements.

Get in touch

1. Executive Summary

1.1 Market overview

Executive Summary - Chart on Market Overview
Executive Summary - Data Table on Market Overview
Executive Summary - Chart on Global Market Characteristics
Executive Summary - Chart on Market by Geography
Executive Summary - Chart on Market Segmentation by Distribution Channel
Executive Summary - Chart on Market Segmentation by Battery Type
Executive Summary - Chart on Market Segmentation by Variant
Executive Summary - Chart on Market Segmentation by Fitment
Executive Summary - Chart on Incremental Growth
Executive Summary - Data Table on Incremental Growth
Executive Summary - Chart on Company Market Positioning

2. Technavio Analysis

2.1 Analysis of price sensitivity, lifecycle, customer purchase basket, adoption rates, and purchase criteria

2.2 Criticality of inputs and Factors of differentiation

Chart on Overview on criticality of inputs and factors of differentiation

2.3 Factors of disruption

Chart on Overview on factors of disruption

2.4 Impact of drivers and challenges

Chart on Impact of drivers and challenges in 2025 and 2030

3. Market Landscape

3.1 Market ecosystem

Chart on Parent Market
Data Table on - Parent Market

3.2 Market characteristics

Chart on Market characteristics analysis

3.3 Value chain analysis

Chart on Value chain analysis

4. Market Sizing

4.1 Market definition

Data Table on Offerings of companies included in the market definition

4.2 Market segment analysis

Market segments

4.3 Market size 2025

4.4 Market outlook: Forecast for 2025-2030

Chart on Global - Market size and forecast 2025-2030 ($ million)
Data Table on Global - Market size and forecast 2025-2030 ($ million)
Chart on Global Market: Year-over-year growth 2025-2030 (%)
Data Table on Global Market: Year-over-year growth 2025-2030 (%)

5. Historic Market Size

5.1 Global E-Bike Battery Market 2020 - 2024

Historic Market Size - Data Table on Global E-Bike Battery Market 2020 - 2024 ($ million)

5.2 Distribution Channel segment analysis 2020 - 2024

Historic Market Size - Distribution Channel Segment 2020 - 2024 ($ million)

5.3 Battery Type segment analysis 2020 - 2024

Historic Market Size - Battery Type Segment 2020 - 2024 ($ million)

5.4 Variant segment analysis 2020 - 2024

Historic Market Size - Variant Segment 2020 - 2024 ($ million)

5.5 Fitment segment analysis 2020 - 2024

Historic Market Size - Fitment Segment 2020 - 2024 ($ million)

5.6 Geography segment analysis 2020 - 2024

Historic Market Size - Geography Segment 2020 - 2024 ($ million)

5.7 Country segment analysis 2020 - 2024

Historic Market Size - Country Segment 2020 - 2024 ($ million)

6. Qualitative Analysis

6.1 Impact of AI on Global E-Bike Battery Market

6.2 Impact of Geopolitical Conflicts on Global E-Bike Battery Market

7. Five Forces Analysis

7.1 Five forces summary

Five forces analysis - Comparison between 2025 and 2030

7.2 Bargaining power of buyers

Bargaining power of buyers - Impact of key factors 2025 and 2030

7.3 Bargaining power of suppliers

Bargaining power of suppliers - Impact of key factors in 2025 and 2030

7.4 Threat of new entrants

Threat of new entrants - Impact of key factors in 2025 and 2030

7.5 Threat of substitutes

Threat of substitutes - Impact of key factors in 2025 and 2030

7.6 Threat of rivalry

Threat of rivalry - Impact of key factors in 2025 and 2030

7.7 Market condition

Chart on Market condition - Five forces 2025 and 2030

8. Market Segmentation by Distribution Channel

8.1 Market segments

Chart on Distribution Channel - Market share 2025-2030 (%)
Data Table on Distribution Channel - Market share 2025-2030 (%)

8.2 Comparison by Distribution Channel

Chart on Comparison by Distribution Channel
Data Table on Comparison by Distribution Channel

8.3 Online - Market size and forecast 2025-2030

Chart on Online - Market size and forecast 2025-2030 ($ million)
Data Table on Online - Market size and forecast 2025-2030 ($ million)
Chart on Online - Year-over-year growth 2025-2030 (%)
Data Table on Online - Year-over-year growth 2025-2030 (%)

8.4 Offline - Market size and forecast 2025-2030

Chart on Offline - Market size and forecast 2025-2030 ($ million)
Data Table on Offline - Market size and forecast 2025-2030 ($ million)
Chart on Offline - Year-over-year growth 2025-2030 (%)
Data Table on Offline - Year-over-year growth 2025-2030 (%)

8.5 Market opportunity by Distribution Channel

Market opportunity by Distribution Channel ($ million)
Data Table on Market opportunity by Distribution Channel ($ million)

9. Market Segmentation by Battery Type

9.1 Market segments

Chart on Battery Type - Market share 2025-2030 (%)
Data Table on Battery Type - Market share 2025-2030 (%)

9.2 Comparison by Battery Type

Chart on Comparison by Battery Type
Data Table on Comparison by Battery Type

9.3 Lithium-ion battery - Market size and forecast 2025-2030

Chart on Lithium-ion battery - Market size and forecast 2025-2030 ($ million)
Data Table on Lithium-ion battery - Market size and forecast 2025-2030 ($ million)
Chart on Lithium-ion battery - Year-over-year growth 2025-2030 (%)
Data Table on Lithium-ion battery - Year-over-year growth 2025-2030 (%)

9.4 Lead acid battery - Market size and forecast 2025-2030

Chart on Lead acid battery - Market size and forecast 2025-2030 ($ million)
Data Table on Lead acid battery - Market size and forecast 2025-2030 ($ million)
Chart on Lead acid battery - Year-over-year growth 2025-2030 (%)
Data Table on Lead acid battery - Year-over-year growth 2025-2030 (%)

9.5 Others - Market size and forecast 2025-2030

Chart on Others - Market size and forecast 2025-2030 ($ million)
Data Table on Others - Market size and forecast 2025-2030 ($ million)
Chart on Others - Year-over-year growth 2025-2030 (%)
Data Table on Others - Year-over-year growth 2025-2030 (%)

9.6 Market opportunity by Battery Type

Market opportunity by Battery Type ($ million)
Data Table on Market opportunity by Battery Type ($ million)

10. Market Segmentation by Variant

10.1 Market segments

Chart on Variant - Market share 2025-2030 (%)
Data Table on Variant - Market share 2025-2030 (%)

10.2 Comparison by Variant

Chart on Comparison by Variant
Data Table on Comparison by Variant

10.3 Mid motor - Market size and forecast 2025-2030

Chart on Mid motor - Market size and forecast 2025-2030 ($ million)
Data Table on Mid motor - Market size and forecast 2025-2030 ($ million)
Chart on Mid motor - Year-over-year growth 2025-2030 (%)
Data Table on Mid motor - Year-over-year growth 2025-2030 (%)

10.4 Hub motor - Market size and forecast 2025-2030

Chart on Hub motor - Market size and forecast 2025-2030 ($ million)
Data Table on Hub motor - Market size and forecast 2025-2030 ($ million)
Chart on Hub motor - Year-over-year growth 2025-2030 (%)
Data Table on Hub motor - Year-over-year growth 2025-2030 (%)

10.5 Market opportunity by Variant

Market opportunity by Variant ($ million)
Data Table on Market opportunity by Variant ($ million)

11. Market Segmentation by Fitment

11.1 Market segments

Chart on Fitment - Market share 2025-2030 (%)
Data Table on Fitment - Market share 2025-2030 (%)

11.2 Comparison by Fitment

Chart on Comparison by Fitment
Data Table on Comparison by Fitment

11.3 Down tube - Market size and forecast 2025-2030

Chart on Down tube - Market size and forecast 2025-2030 ($ million)
Data Table on Down tube - Market size and forecast 2025-2030 ($ million)
Chart on Down tube - Year-over-year growth 2025-2030 (%)
Data Table on Down tube - Year-over-year growth 2025-2030 (%)

11.4 In frame - Market size and forecast 2025-2030

Chart on In frame - Market size and forecast 2025-2030 ($ million)
Data Table on In frame - Market size and forecast 2025-2030 ($ million)
Chart on In frame - Year-over-year growth 2025-2030 (%)
Data Table on In frame - Year-over-year growth 2025-2030 (%)

11.5 Rear carrier - Market size and forecast 2025-2030

Chart on Rear carrier - Market size and forecast 2025-2030 ($ million)
Data Table on Rear carrier - Market size and forecast 2025-2030 ($ million)
Chart on Rear carrier - Year-over-year growth 2025-2030 (%)
Data Table on Rear carrier - Year-over-year growth 2025-2030 (%)

11.6 Market opportunity by Fitment

Market opportunity by Fitment ($ million)
Data Table on Market opportunity by Fitment ($ million)

12. Customer Landscape

12.1 Customer landscape overview

Analysis of price sensitivity, lifecycle, customer purchase basket, adoption rates, and purchase criteria

13. Geographic Landscape

13.1 Geographic segmentation

Chart on Market share by geography 2025-2030 (%)
Data Table on Market share by geography 2025-2030 (%)

13.2 Geographic comparison

Chart on Geographic comparison
Data Table on Geographic comparison

13.3 APAC - Market size and forecast 2025-2030

Chart on APAC - Market size and forecast 2025-2030 ($ million)
Data Table on APAC - Market size and forecast 2025-2030 ($ million)
Chart on APAC - Year-over-year growth 2025-2030 (%)
Data Table on APAC - Year-over-year growth 2025-2030 (%)
Chart on Regional Comparison - APAC
Data Table on Regional Comparison - APAC

13.3.1 China - Market size and forecast 2025-2030

Chart on China - Market size and forecast 2025-2030 ($ million)
Data Table on China - Market size and forecast 2025-2030 ($ million)
Chart on China - Year-over-year growth 2025-2030 (%)
Data Table on China - Year-over-year growth 2025-2030 (%)

13.3.2 Japan - Market size and forecast 2025-2030

Chart on Japan - Market size and forecast 2025-2030 ($ million)
Data Table on Japan - Market size and forecast 2025-2030 ($ million)
Chart on Japan - Year-over-year growth 2025-2030 (%)
Data Table on Japan - Year-over-year growth 2025-2030 (%)

13.3.3 India - Market size and forecast 2025-2030

Chart on India - Market size and forecast 2025-2030 ($ million)
Data Table on India - Market size and forecast 2025-2030 ($ million)
Chart on India - Year-over-year growth 2025-2030 (%)
Data Table on India - Year-over-year growth 2025-2030 (%)

13.3.4 South Korea - Market size and forecast 2025-2030

Chart on South Korea - Market size and forecast 2025-2030 ($ million)
Data Table on South Korea - Market size and forecast 2025-2030 ($ million)
Chart on South Korea - Year-over-year growth 2025-2030 (%)
Data Table on South Korea - Year-over-year growth 2025-2030 (%)

13.3.5 Australia - Market size and forecast 2025-2030

Chart on Australia - Market size and forecast 2025-2030 ($ million)
Data Table on Australia - Market size and forecast 2025-2030 ($ million)
Chart on Australia - Year-over-year growth 2025-2030 (%)
Data Table on Australia - Year-over-year growth 2025-2030 (%)

13.3.6 Indonesia - Market size and forecast 2025-2030

Chart on Indonesia - Market size and forecast 2025-2030 ($ million)
Data Table on Indonesia - Market size and forecast 2025-2030 ($ million)
Chart on Indonesia - Year-over-year growth 2025-2030 (%)
Data Table on Indonesia - Year-over-year growth 2025-2030 (%)

13.4 Europe - Market size and forecast 2025-2030

Chart on Europe - Market size and forecast 2025-2030 ($ million)
Data Table on Europe - Market size and forecast 2025-2030 ($ million)
Chart on Europe - Year-over-year growth 2025-2030 (%)
Data Table on Europe - Year-over-year growth 2025-2030 (%)
Chart on Regional Comparison - Europe
Data Table on Regional Comparison - Europe

13.4.1 Germany - Market size and forecast 2025-2030

Chart on Germany - Market size and forecast 2025-2030 ($ million)
Data Table on Germany - Market size and forecast 2025-2030 ($ million)
Chart on Germany - Year-over-year growth 2025-2030 (%)
Data Table on Germany - Year-over-year growth 2025-2030 (%)

13.4.2 UK - Market size and forecast 2025-2030

Chart on UK - Market size and forecast 2025-2030 ($ million)
Data Table on UK - Market size and forecast 2025-2030 ($ million)
Chart on UK - Year-over-year growth 2025-2030 (%)
Data Table on UK - Year-over-year growth 2025-2030 (%)

13.4.3 France - Market size and forecast 2025-2030

Chart on France - Market size and forecast 2025-2030 ($ million)
Data Table on France - Market size and forecast 2025-2030 ($ million)
Chart on France - Year-over-year growth 2025-2030 (%)
Data Table on France - Year-over-year growth 2025-2030 (%)

13.4.4 Italy - Market size and forecast 2025-2030

Chart on Italy - Market size and forecast 2025-2030 ($ million)
Data Table on Italy - Market size and forecast 2025-2030 ($ million)
Chart on Italy - Year-over-year growth 2025-2030 (%)
Data Table on Italy - Year-over-year growth 2025-2030 (%)

13.4.5 Spain - Market size and forecast 2025-2030

Chart on Spain - Market size and forecast 2025-2030 ($ million)
Data Table on Spain - Market size and forecast 2025-2030 ($ million)
Chart on Spain - Year-over-year growth 2025-2030 (%)
Data Table on Spain - Year-over-year growth 2025-2030 (%)

13.4.6 The Netherlands - Market size and forecast 2025-2030

Chart on The Netherlands - Market size and forecast 2025-2030 ($ million)
Data Table on The Netherlands - Market size and forecast 2025-2030 ($ million)
Chart on The Netherlands - Year-over-year growth 2025-2030 (%)
Data Table on The Netherlands - Year-over-year growth 2025-2030 (%)

13.5 North America - Market size and forecast 2025-2030

Chart on North America - Market size and forecast 2025-2030 ($ million)
Data Table on North America - Market size and forecast 2025-2030 ($ million)
Chart on North America - Year-over-year growth 2025-2030 (%)
Data Table on North America - Year-over-year growth 2025-2030 (%)
Chart on Regional Comparison - North America
Data Table on Regional Comparison - North America

13.5.1 US - Market size and forecast 2025-2030

Chart on US - Market size and forecast 2025-2030 ($ million)
Data Table on US - Market size and forecast 2025-2030 ($ million)
Chart on US - Year-over-year growth 2025-2030 (%)
Data Table on US - Year-over-year growth 2025-2030 (%)

13.5.2 Canada - Market size and forecast 2025-2030

Chart on Canada - Market size and forecast 2025-2030 ($ million)
Data Table on Canada - Market size and forecast 2025-2030 ($ million)
Chart on Canada - Year-over-year growth 2025-2030 (%)
Data Table on Canada - Year-over-year growth 2025-2030 (%)

13.5.3 Mexico - Market size and forecast 2025-2030

Chart on Mexico - Market size and forecast 2025-2030 ($ million)
Data Table on Mexico - Market size and forecast 2025-2030 ($ million)
Chart on Mexico - Year-over-year growth 2025-2030 (%)
Data Table on Mexico - Year-over-year growth 2025-2030 (%)

13.6 South America - Market size and forecast 2025-2030

Chart on South America - Market size and forecast 2025-2030 ($ million)
Data Table on South America - Market size and forecast 2025-2030 ($ million)
Chart on South America - Year-over-year growth 2025-2030 (%)
Data Table on South America - Year-over-year growth 2025-2030 (%)
Chart on Regional Comparison - South America
Data Table on Regional Comparison - South America

13.6.1 Brazil - Market size and forecast 2025-2030

Chart on Brazil - Market size and forecast 2025-2030 ($ million)
Data Table on Brazil - Market size and forecast 2025-2030 ($ million)
Chart on Brazil - Year-over-year growth 2025-2030 (%)
Data Table on Brazil - Year-over-year growth 2025-2030 (%)

13.6.2 Argentina - Market size and forecast 2025-2030

Chart on Argentina - Market size and forecast 2025-2030 ($ million)
Data Table on Argentina - Market size and forecast 2025-2030 ($ million)
Chart on Argentina - Year-over-year growth 2025-2030 (%)
Data Table on Argentina - Year-over-year growth 2025-2030 (%)

13.6.3 Chile - Market size and forecast 2025-2030

Chart on Chile - Market size and forecast 2025-2030 ($ million)
Data Table on Chile - Market size and forecast 2025-2030 ($ million)
Chart on Chile - Year-over-year growth 2025-2030 (%)
Data Table on Chile - Year-over-year growth 2025-2030 (%)

13.7 Middle East and Africa - Market size and forecast 2025-2030

Chart on Middle East and Africa - Market size and forecast 2025-2030 ($ million)
Data Table on Middle East and Africa - Market size and forecast 2025-2030 ($ million)
Chart on Middle East and Africa - Year-over-year growth 2025-2030 (%)
Data Table on Middle East and Africa - Year-over-year growth 2025-2030 (%)
Chart on Regional Comparison - Middle East and Africa
Data Table on Regional Comparison - Middle East and Africa

13.7.1 Saudi Arabia - Market size and forecast 2025-2030

Chart on Saudi Arabia - Market size and forecast 2025-2030 ($ million)
Data Table on Saudi Arabia - Market size and forecast 2025-2030 ($ million)
Chart on Saudi Arabia - Year-over-year growth 2025-2030 (%)
Data Table on Saudi Arabia - Year-over-year growth 2025-2030 (%)

13.7.2 UAE - Market size and forecast 2025-2030

Chart on UAE - Market size and forecast 2025-2030 ($ million)
Data Table on UAE - Market size and forecast 2025-2030 ($ million)
Chart on UAE - Year-over-year growth 2025-2030 (%)
Data Table on UAE - Year-over-year growth 2025-2030 (%)

13.7.3 South Africa - Market size and forecast 2025-2030

Chart on South Africa - Market size and forecast 2025-2030 ($ million)
Data Table on South Africa - Market size and forecast 2025-2030 ($ million)
Chart on South Africa - Year-over-year growth 2025-2030 (%)
Data Table on South Africa - Year-over-year growth 2025-2030 (%)

13.7.4 Israel - Market size and forecast 2025-2030

Chart on Israel - Market size and forecast 2025-2030 ($ million)
Data Table on Israel - Market size and forecast 2025-2030 ($ million)
Chart on Israel - Year-over-year growth 2025-2030 (%)
Data Table on Israel - Year-over-year growth 2025-2030 (%)

13.7.5 Turkey - Market size and forecast 2025-2030

Chart on Turkey - Market size and forecast 2025-2030 ($ million)
Data Table on Turkey - Market size and forecast 2025-2030 ($ million)
Chart on Turkey - Year-over-year growth 2025-2030 (%)
Data Table on Turkey - Year-over-year growth 2025-2030 (%)

13.8 Market opportunity by geography

Market opportunity by geography ($ million)
Data Tables on Market opportunity by geography ($ million)

14. Drivers, Challenges, and Opportunity

14.1 Market drivers

Technological advancements in cell chemistry and energy density
Urban micro-mobility and last-mile delivery electrification
Cargo fleets and standardized battery swapping ecosystems

14.2 Market challenges

Thermal runaway risks and fragmented global safety standards
Supply chain volatility and upstream critical mineral vulnerabilities
Recycling gaps and circular economy compliance bottlenecks

14.3 Impact of drivers and challenges

Impact of drivers and challenges in 2025 and 2030

14.4 Market opportunities

IoT telematics and predictive cloud diagnostics
Digital battery passport mandates and traceable lifecycle circularity
Semi-solid-state electrolytes and advanced pouch packaging

15. Competitive Landscape

15.1 Overview

15.2

Overview on criticality of inputs and factors of differentiation

15.3 Landscape disruption

Overview on factors of disruption

15.4 Industry risks

Impact of key risks on business

16. Competitive Analysis

16.1 Companies profiled

Companies covered

16.2 Company ranking index

16.3 Market positioning of companies

Matrix on companies position and classification

16.4 Bafang Electric Suzhou Co.

Bafang Electric Suzhou Co. - Overview
Bafang Electric Suzhou Co. - Product / Service
Bafang Electric Suzhou Co. - Key offerings
SWOT

16.5 BMZ Holding GmbH

BMZ Holding GmbH - Overview
BMZ Holding GmbH - Product / Service
BMZ Holding GmbH - Key offerings
SWOT

16.6 Darfon Electronics Corp.

Darfon Electronics Corp. - Overview
Darfon Electronics Corp. - Business segments
Darfon Electronics Corp. - Key offerings
Darfon Electronics Corp. - Segment focus
SWOT

16.7 EVE Energy Co. Ltd.

EVE Energy Co. Ltd. - Overview
EVE Energy Co. Ltd. - Business segments
EVE Energy Co. Ltd. - Key offerings
EVE Energy Co. Ltd. - Segment focus
SWOT

16.8 LG Energy Solution Ltd.

LG Energy Solution Ltd. - Overview
LG Energy Solution Ltd. - Product / Service
LG Energy Solution Ltd. - Key news
LG Energy Solution Ltd. - Key offerings
SWOT

16.9 MAHLE GmbH

MAHLE GmbH - Overview
MAHLE GmbH - Product / Service
MAHLE GmbH - Key offerings
SWOT

16.10 Panasonic Holdings Corp.

Panasonic Holdings Corp. - Overview
Panasonic Holdings Corp. - Business segments
Panasonic Holdings Corp. - Key news
Panasonic Holdings Corp. - Key offerings
Panasonic Holdings Corp. - Segment focus
SWOT

16.11 Robert Bosch GmbH

Robert Bosch GmbH - Overview
Robert Bosch GmbH - Product / Service
Robert Bosch GmbH - Key offerings
SWOT

16.12 Samsung SDI Co. Ltd.

Samsung SDI Co. Ltd. - Overview
Samsung SDI Co. Ltd. - Business segments
Samsung SDI Co. Ltd. - Key offerings
Samsung SDI Co. Ltd. - Segment focus
SWOT

16.13 Shimano Inc.

Shimano Inc. - Overview
Shimano Inc. - Business segments
Shimano Inc. - Key offerings
Shimano Inc. - Segment focus
SWOT

16.14 SRAM LLC

SRAM LLC - Overview
SRAM LLC - Product / Service
SRAM LLC - Key offerings
SWOT

16.15 Sunwoda Electronic Co. Ltd.

Sunwoda Electronic Co. Ltd. - Overview
Sunwoda Electronic Co. Ltd. - Business segments
Sunwoda Electronic Co. Ltd. - Key offerings
Sunwoda Electronic Co. Ltd. - Segment focus
SWOT

16.16 Tianneng Group

Tianneng Group - Overview
Tianneng Group - Business segments
Tianneng Group - Key offerings
Tianneng Group - Segment focus
SWOT

16.17 TQ Systems GmbH

TQ Systems GmbH - Overview
TQ Systems GmbH - Product / Service
TQ Systems GmbH - Key offerings
SWOT

16.18 Yamaha Motor Co. Ltd.

Yamaha Motor Co. Ltd. - Overview
Yamaha Motor Co. Ltd. - Business segments
Yamaha Motor Co. Ltd. - Key offerings
Yamaha Motor Co. Ltd. - Segment focus
SWOT

17. Appendix

17.1 Scope of the report

Market definition
Objectives
Notes and caveats

17.2 Inclusions and exclusions checklist

Inclusions checklist
Exclusions checklist

17.3 Currency conversion rates for US$

17.4 Research methodology

17.5 Data procurement

Information sources

17.6 Data validation

17.7 Validation techniques employed for market sizing

17.8 Data synthesis

17.9 360 degree market analysis

17.10 List of abbreviations

Research Methodology

Technavio presents a detailed picture of the market by way of study, synthesis, and summation of data from multiple sources. The analysts have presented the various facets of the market with a particular focus on identifying the key industry influencers. The data thus presented is comprehensive, reliable, and the result of extensive research, both primary and secondary.

INFORMATION SOURCES

Primary sources

  • Manufacturers and suppliers
  • Channel partners
  • Industry experts
  • Strategic decision makers

Secondary sources

  • Industry journals and periodicals
  • Government data
  • Financial reports of key industry players
  • Historical data
  • Press releases

DATA ANALYSIS

Data Synthesis

  • Collation of data
  • Estimation of key figures
  • Analysis of derived insights

Data Validation

  • Triangulation with data models
  • Reference against proprietary databases
  • Corroboration with industry experts

REPORT WRITING

Qualitative

  • Market drivers
  • Market challenges
  • Market trends
  • Five forces analysis

Quantitative

  • Market size and forecast
  • Market segmentation
  • Geographical insights
  • Competitive landscape

Interested in this report?

Get your sample now to see our research methodology and insights!

Download Now

Frequently Asked Questions

E-Bike Battery market growth will increase by USD 1666.6 million during 2026-2030.

The E-Bike Battery market is expected to grow at a CAGR of 4.5% during 2026-2030.

E-Bike Battery market is segmented by Distribution channel (Online, Offline) Battery type (Lithium-ion battery, Lead acid battery, Others) Variant (Mid motor, Hub motor) Fitment (Down tube, In frame, Rear carrier)

Bafang Electric Suzhou Co., BMZ Holding GmbH, Chaowei Power Holdings Ltd, Darfon Electronics Corp., EVE Energy Co. Ltd., Guangdong Greenway Technology Co, LG Energy Solution Ltd., MAHLE GmbH, Panasonic Holdings Corp., Phylion Battery Co. Ltd., Promovec AS, Robert Bosch GmbH, Samsung SDI Co. Ltd., Shimano Inc., SRAM LLC, Sunwoda Electronic Co. Ltd., Tianneng Group, TQ Systems GmbH, Tranzx, Yamaha Motor Co. Ltd. are a few of the key vendors in the E-Bike Battery market.

APAC will register the highest growth rate of 84.5% among the other regions. Therefore, the E-Bike Battery market in APAC is expected to garner significant business opportunities for the vendors during the forecast period.

China, Japan, India, South Korea, Australia, Indonesia, Germany, UK, France, Italy, Spain, The Netherlands, US, Canada, Mexico, Brazil, Argentina, Chile, Saudi Arabia, UAE, South Africa, Israel, Turkey

  • Technological advancements in cell chemistry and energy density is the driving factor this market.

The E-Bike Battery market vendors should focus on grabbing business opportunities from the Distribution channel segment as it accounted for the largest market share in the base year.
RIA - Research AI Assistant
Ask RIA
