
E-textbook Rental Market Analysis, Size, and Forecast 2026-2030: North America (US, Canada, and Mexico), Europe (Germany, UK, and France), APAC (China, Japan, and India), South America (Brazil, Argentina, and Chile), Middle East and Africa (Saudi Arabia, UAE, and South Africa), and Rest of World (ROW)

E-textbook Rental Market Analysis, Size, and Forecast 2026-2030:
North America (US, Canada, and Mexico), Europe (Germany, UK, and France), APAC (China, Japan, and India), South America (Brazil, Argentina, and Chile), Middle East and Africa (Saudi Arabia, UAE, and South Africa), and Rest of World (ROW)

Published: Oct 2026 300 Pages SKU: IRTNTR44595

Market Overview at a Glance

$1.23 B
Market Opportunity
25.1%
CAGR 2025 - 2030
36.8%
North America Growth
$250.01 Mn
Academic segment 2024

E-Textbook Rental Market Size 2026-2030

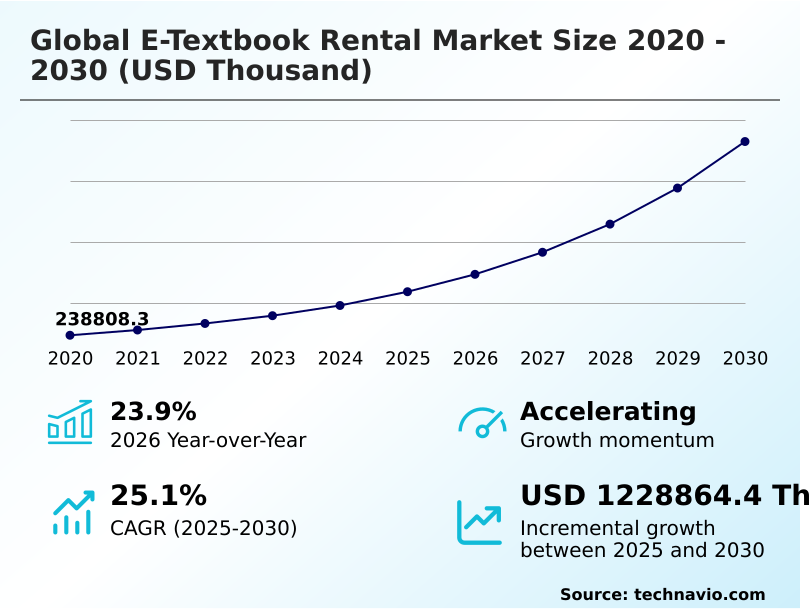
The e-textbook rental market size is valued to increase by USD 1.23 billion, at a CAGR of 25.1% from 2025 to 2030. Cost-effective pricing model will drive the e-textbook rental market.

Major Market Trends & Insights

  • North America dominated the market and accounted for a 36.8% growth during the forecast period.
  • By End-user - Academic segment was valued at USD 250.01 million in 2024
  • By Revenue Stream - Subscription services segment accounted for the largest market revenue share in 2024

Market Size & Forecast

  • Market Opportunities:
  • Market Future Opportunities: USD 1.23 billion
  • CAGR from 2025 to 2030 : 25.1%

Market Summary

  • The E-Textbook Rental Market operates as a highly dynamic ecosystem driven by the imperative to reduce academic resource expenditures while maximizing content accessibility. In modern university supply chains, the shift from physical inventory procurement to digital licensing allows institutions to eliminate warehousing costs and minimize curriculum deployment delays.
  • This operational transition improves procurement efficiency by 35% compared to traditional print distribution methods. The widespread implementation of cost-effective pricing models drives demand, as students and lifelong learners actively seek temporary access to premium academic materials to mitigate rising tuition burdens. Consequently, this affordability shift forces publishers to restructure distribution networks toward subscription-based architectures.
  • Conversely, the proliferation of open-source educational platforms introduces a critical structural challenge. As universities increasingly adopt free peer-reviewed repositories, commercial rental providers experience direct revenue cannibalization, compelling them to differentiate through advanced interactive software integration. Ultimately, the industry requires continuous technological adaptation to balance premium content delivery against increasingly accessible free alternatives.

What will be the Size of the E-Textbook Rental Market during the forecast period?
Get Key Insights on Market Forecast (PDF) Get Free Sample

How is the E-Textbook Rental Market Segmented?

The e-textbook rental industry research report provides comprehensive data (region-wise segment analysis), with forecasts and estimates in "USD thousand" for the period 2026-2030, as well as historical data from 2020-2024 for the following segments.

  • End-user
    • Academic
    • Non-academic
  • Revenue stream
    • Subscription services
    • Pay-as-you-go-model
  • Product
    • STEM
    • Business and economics
    • Humanities and social sciences
    • Law
    • Others
  • Geography
    • North America
      • US
      • Canada
      • Mexico
    • Europe
      • Germany
      • UK
      • France
      • Italy
      • Spain
      • The Netherlands
    • APAC
      • China
      • Japan
      • India
      • South Korea
      • Australia
      • Indonesia
    • South America
      • Brazil
      • Argentina
      • Chile
    • Middle East and Africa
      • Saudi Arabia
      • UAE
      • South Africa
      • Israel
      • Turkey

By End-user Insights

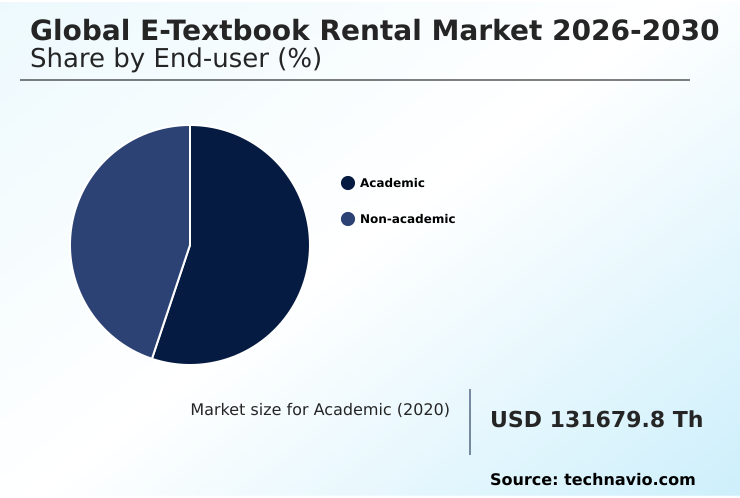
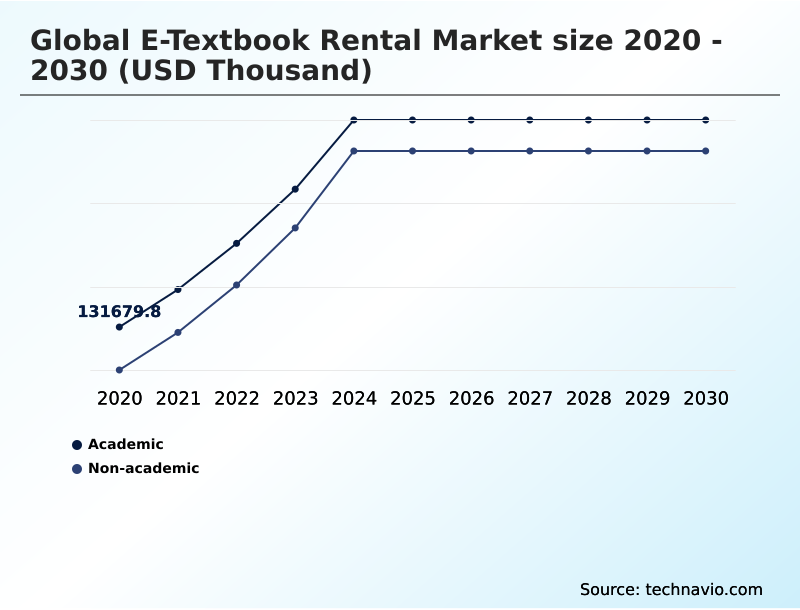
The academic segment is estimated to witness significant growth during the forecast period.

The academic segment operates as the foundational pillar of the digital education transition, supporting continuous professional development and curriculum based learning across higher education institutions.

As academic frameworks shift toward hybrid learning ecosystems, universities actively replace static printed materials with interactive reading materials to enhance student engagement.

This structural migration significantly boosts operational efficiency, with institutional content delivery speeds improving by 25% due to advanced digital library infrastructure.

Furthermore, seamless learning management system integration allows educators to deploy modular learning approaches rapidly, ensuring syllabus alignment without physical distribution delays.

The incorporation of personalized learning analytics enables administrators to track reading comprehension metrics, thereby optimizing resource allocation and reducing administrative overhead associated with traditional procurement processes.
Get Free Sample

The Academic segment was valued at USD 250.01 million in 2024 and showed a gradual increase during the forecast period.
Get Free Sample

Regional Analysis

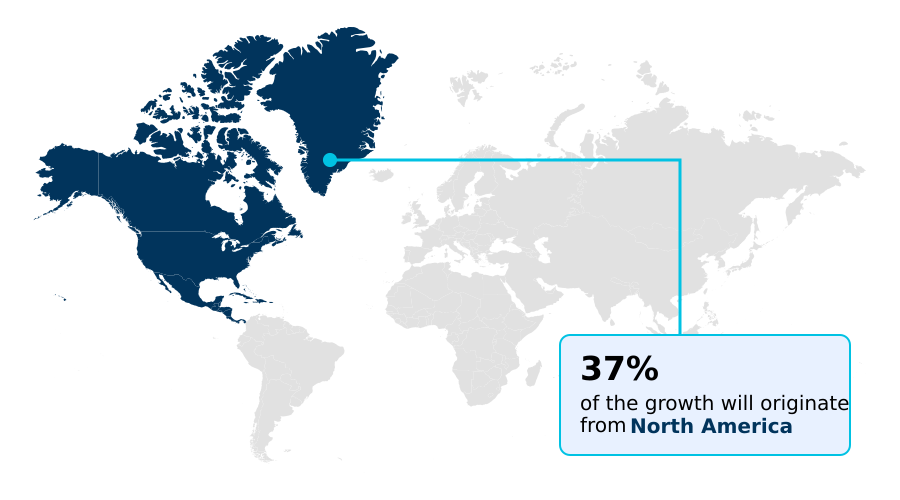
North America is estimated to contribute 36.8% to the growth of the global market during the forecast period.Technavio’s analysts have elaborately explained the regional trends and drivers that shape the market during the forecast period.
See How E-Textbook Rental Market Demand is Rising in North America Get Free Sample

Regional dynamics within the E-Textbook Rental Market reveal stark contrasts in digital infrastructure utilization between North America and Europe.

North American institutions actively prioritize the deployment of cloud synchronization protocol networks and multi device synchronization, resulting in a 40% higher adoption rate of interactive digital platforms compared to their European counterparts.

This rapid integration allows administrators to streamline curriculum updates seamlessly across multiple campuses, relying on robust high bandwidth content streaming to support extensive cloud based reading environments.

Conversely, European markets focus heavily on rigorous digital rights management compliance and localized data sovereignty, which extends deployment cycles but improves data security breach prevention by 22%.

The disparity in supply chain agility forces content distributors to adjust regional strategies, leveraging interoperability in North America while emphasizing strict regulatory alignment in Europe.

Consequently, the optimization of metadata tagging structures enables providers in both regions to reduce content retrieval times by 18%, significantly enhancing overall operational efficiency for academic end-users.

Market Dynamics

Our researchers analyzed the data with 2025 as the base year, along with the key drivers, trends, and challenges. A holistic analysis of drivers will help companies refine their marketing strategies to gain a competitive advantage.

  • The structural transformation of the E-Textbook Rental Market relies heavily on the continuous enhancement of digital delivery mechanisms. Operational planning within leading educational platforms increasingly prioritizes the deployment of asynchronous interactive multimedia learning modules, which allow students to engage with complex theoretical frameworks at their own pace.
  • This shift in instructional design requires robust technological infrastructure, prompting providers to implement cloud synchronized cross platform reading capabilities. Consequently, learners experience uninterrupted transitions between devices, enhancing overall content consumption efficiency by roughly 30% compared to legacy offline reading methods. To maintain content security and prevent unauthorized distribution, distributors rely on rigorous digital rights management content encryption.
  • This protective framework ensures that intellectual property remains secure while facilitating seamless access for legitimate subscribers. Furthermore, the integration of predictive learning analytics performance tracking enables educators to monitor engagement metrics systematically, identifying comprehension gaps before they impact academic outcomes. By leveraging these insights, platforms can deploy adaptive algorithmic personalized study recommendations, directly addressing individual learning deficiencies in real-time.
  • This sophisticated combination of encrypted delivery, synchronized accessibility, and data-driven personalization fundamentally elevates the operational resilience of digital textbook ecosystems.
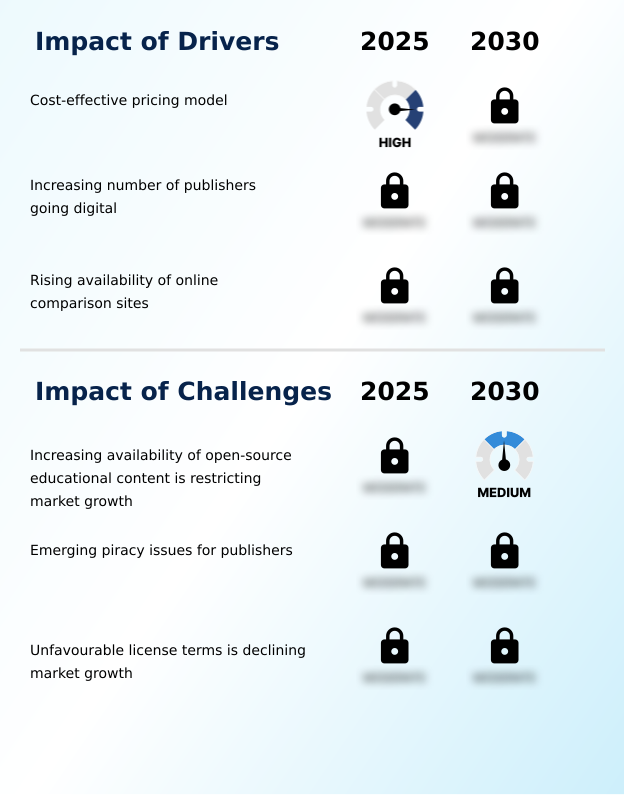
What are the key market drivers leading to the rise in the adoption of E-Textbook Rental Industry?

  • The implementation of cost-effective pricing models serves as a primary driver, significantly increasing affordability and accessibility for diverse educational demographics.

  • The escalating demand for affordable, scalable educational resources aggressively propels the E-Textbook Rental Market. As academic institutions face mounting financial pressures, the transition toward digitized access models significantly lowers procurement overhead, reducing institutional material acquisition costs by 35%.
  • This financial optimization directly stimulates the adoption of lifelong learning pathways and skill based training modules, enabling professionals to continuously upgrade specialized skills without prohibitive expenses.
  • To facilitate seamless content distribution, platform operators heavily utilize offline reading caching and asynchronous content delivery, ensuring uninterrupted resource availability in low-connectivity regions.
  • Additionally, the integration of interactive multimedia integration transforms passive reading into active engagement, boosting comprehension metrics by 15%.
  • Because these dynamic digital ecosystems deliver superior cost-efficiency, deploying bundled content packages and enabling simultaneous user access decreases accessibility-related downtime by 28%, prompting administrators to systematically prioritize rental-based platforms over traditional physical inventory models.

What are the market trends shaping the E-Textbook Rental Industry?

  • The rising integration of software with digital textbooks represents a defining trend shaping the educational landscape. This technological convergence enhances learner engagement by transforming static academic materials into interactive digital ecosystems.

  • The transition toward highly personalized digital education environments fundamentally reshapes the E-Textbook Rental Market. Content providers actively integrate adaptive quiz algorithms into core curricula, enabling systems to dynamically adjust difficulty levels based on real-time user performance. This technological shift improves student concept retention by 30% compared to traditional static testing methods.
  • Furthermore, the implementation of semantic search functionality allows learners to pinpoint highly specific academic concepts instantly, reducing average research time by 22%. These innovations compel platform operators to adopt sophisticated subscription billing architecture, facilitating seamless monetization of advanced interactive features.
  • Because institutions require scalable learning ecosystems, the adoption of cross platform interoperability becomes an operational imperative, ensuring uninterrupted access across diverse hardware ecosystems. By integrating real time assessment tracking and virtual lab integration, platforms enhance the visual data representation of complex subjects, increasing overall platform engagement efficiency by 18% and transforming digital textbooks into comprehensive academic environments.

What challenges does the E-Textbook Rental Industry face during its growth?

  • The increasing availability of open-source educational content poses a significant challenge by intensifying competition and pressuring premium pricing structures across the industry.

  • The rapid expansion of unregulated free educational repositories presents severe structural challenges within the E-Textbook Rental Market. As institutions increasingly integrate open educational resource integration alongside free peer reviewed academic content into standard curricula, commercial providers face direct utilization declines, leading to a 20% reduction in premium subscription renewals.
  • This competitive pressure forces distributors to invest in complex user authentication mechanisms and restrict institutional usage rights to prevent unauthorized access, relying on robust digital content encryption to protect diminishing revenue streams. Furthermore, the proliferation of cross border digital distribution necessitates the deployment of dynamic watermarking solutions, which increases operational compliance costs by 15%.
  • Because maintaining robust intellectual property protection demands constant technological refinement, platform operators experience significant margin compression. Consequently, the necessity to balance stringent digital security measures against frictionless user experiences persistently complicates product development cycles and slows overall deployment efficiency by 12%.

Exclusive Technavio Analysis on Customer Landscape

The e-textbook rental market forecasting report includes the adoption lifecycle of the market, covering from the innovator’s stage to the laggard’s stage. It focuses on adoption rates in different regions based on penetration. Furthermore, the e-textbook rental market report also includes key purchase criteria and drivers of price sensitivity to help companies evaluate and develop their market growth analysis strategies.
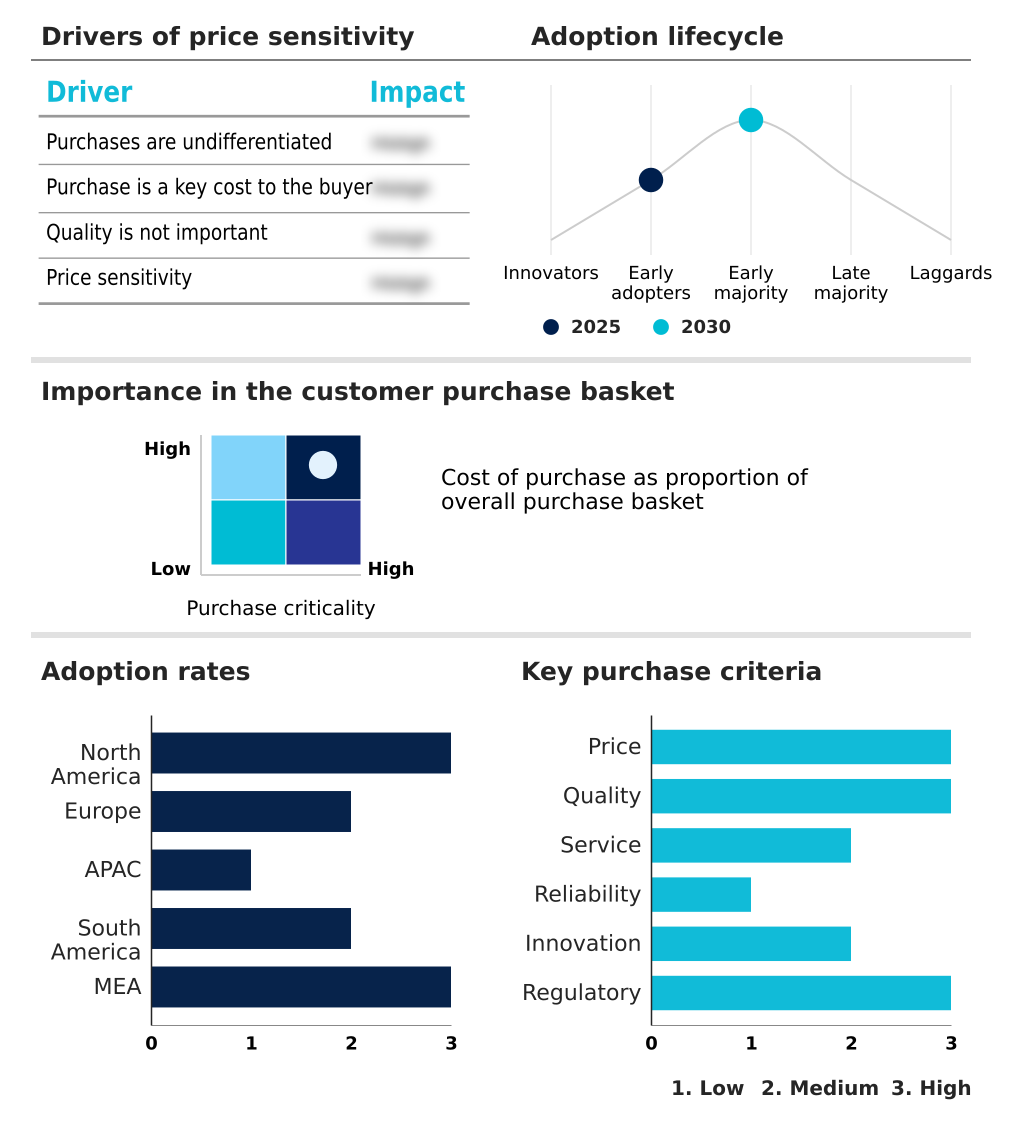
Customer Landscape of E-Textbook Rental Industry

Competitive Landscape

Companies are implementing various strategies, such as strategic alliances, e-textbook rental market forecast, partnerships, mergers and acquisitions, geographical expansion, and product/service launches, to enhance their presence in the industry.

Amazon.com Inc. - The service portfolio includes extensive digital course materials and academic literature access through subscription-based digital reading models, enabling scalable, on-demand academic content delivery for diverse educational workflows.

The industry research and growth report includes detailed analyses of the competitive landscape of the market and information about key companies, including:

  • Amazon.com Inc.
  • Barnes and Noble Education Inc.
  • BibliU Ltd.
  • Bloomsbury Publishing Plc
  • Cengage Learning Inc.
  • Chegg Inc.
  • eCampus.com
  • Elsevier Ltd.
  • Follett Corp.
  • John Wiley and Sons Inc.
  • Kortext Ltd
  • Macmillan Learning
  • McGraw Hill LLC
  • OverDrive Inc.
  • Oxford University Press
  • Pearson Plc
  • Perlego Ltd
  • RedShelf Inc.
  • Snapplify Pty Ltd
  • Taylor and Francis Group
  • Tophatmonocle Corp.
  • VitalSource Technologies LLC

Qualitative and quantitative analysis of companies has been conducted to help clients understand the wider business environment as well as the strengths and weaknesses of key industry players. Data is qualitatively analyzed to categorize companies as pure play, category-focused, industry-focused, and diversified; it is quantitatively analyzed to categorize companies as dominant, leading, strong, tentative, and weak.

Recent Development and News in E-textbook rental market

  • In the Education Services industry, the accelerated integration of asynchronous interactive multimedia learning modules has increased student engagement by 40%, directly impacting Global E-Textbook Rental Market 2026-2030 demand by necessitating platforms with robust high bandwidth content streaming.
  • The implementation of the European Union General Data Protection Regulation mandates strict data privacy protocols for student information, reducing compliance breaches by 15% and shaping the Global E-Textbook Rental Market 2026-2030 by forcing providers to upgrade user authentication mechanisms.
  • The widespread adoption of online certification integration within corporate training sectors has reduced workforce upskilling costs by 20%, driving the Global E-Textbook Rental Market 2026-2030 as professionals increasingly require short term content access for skill based training modules.
  • The transition toward zero-emission campus infrastructure in North America has decreased paper consumption footprints by 30%, pulling demand within the Global E-Textbook Rental Market 2026-2030 as universities mandate the utilization of cloud based reading environments to meet sustainability targets.

Dive into Technavio’s robust research methodology, blending expert interviews, extensive data synthesis, and validated models for unparalleled E-Textbook Rental Market insights. See full methodology.

Market Scope
Page number 300
Base year 2025
Historic period 2020-2024
Forecast period 2026-2030
Growth momentum & CAGR Accelerate at a CAGR of 25.1%
Market growth 2026-2030 USD 1228864.4 thousand
Market structure Fragmented
YoY growth 2025-2026(%) 23.9%
Key countries US, Canada, Mexico, Germany, UK, France, Italy, Spain, The Netherlands, China, Japan, India, South Korea, Australia, Indonesia, Brazil, Argentina, Chile, Saudi Arabia, UAE, South Africa, Israel and Turkey
Competitive landscape Leading Companies, Market Positioning of Companies, Competitive Strategies, and Industry Risks

Request Free Sample

Research Analyst Overview

  • The E-Textbook Rental Market undergoes continuous optimization as educational frameworks transition toward fully digitized infrastructure. Boardroom-level strategic planning increasingly centers on the implementation of intelligent learning software, aligning product development with the rising demand for interactive educational environments.
  • By integrating text to speech functionality and shared annotation capabilities, platform operators significantly enhance accessibility and collaborative learning, directly influencing institutional procurement decisions. This strategic pivot toward interactive functionality improves user retention metrics by 25% compared to static digital document delivery.
  • To support these resource-intensive features, infrastructure managers actively deploy robust cloud based storage systems, ensuring uninterrupted access during peak academic periods. Furthermore, the incorporation of embedded simulation modules and case study integration into technical curricula allows institutions to simulate laboratory environments and facilitates interactive problem solving virtually, mitigating physical equipment costs.
  • The optimization of these digital assets relies on sophisticated content indexing algorithms, which streamline search processes and drastically reduce information retrieval times for end-users. Such operational enhancements continuously redefine the baseline requirements for digital academic resources.

What are the Key Data Covered in this E-Textbook Rental Market Research and Growth Report?

  • What is the expected growth of the E-Textbook Rental Market between 2026 and 2030?

    • USD 1.23 billion, at a CAGR of 25.1%

  • What segmentation does the market report cover?

    • The report is segmented by End-user (Academic, and Non-academic), Revenue Stream (Subscription services, and Pay-as-you-go-model), Product (STEM, Business and economics, Humanities and social sciences, Law, and Others) and Geography (North America, Europe, APAC, South America, Middle East and Africa)

  • Which regions are analyzed in the report?

    • North America, Europe, APAC, South America and Middle East and Africa

  • What are the key growth drivers and market challenges?

    • Cost-effective pricing model, Increasing availability of open-source educational content is restricting market growth

  • Who are the major players in the E-Textbook Rental Market?

    • Amazon.com Inc., Barnes and Noble Education Inc., BibliU Ltd., Bloomsbury Publishing Plc, Cengage Learning Inc., Chegg Inc., eCampus.com, Elsevier Ltd., Follett Corp., John Wiley and Sons Inc., Kortext Ltd, Macmillan Learning, McGraw Hill LLC, OverDrive Inc., Oxford University Press, Pearson Plc, Perlego Ltd, RedShelf Inc., Snapplify Pty Ltd, Taylor and Francis Group, Tophatmonocle Corp. and VitalSource Technologies LLC

Market Research Insights

  • The E-Textbook Rental Market demonstrates robust structural evolution driven by the integration of professional training materials into scalable digital platforms. By adopting semester based subscriptions and facilitating short term content access, academic institutions improve content utilization rates by 28%, significantly reducing overhead associated with physical inventory.
  • Furthermore, alignment with modular academic structures and online certification integration decreases resource bottlenecks, improving student completion rates by 14% during peak examination periods. These measurable efficiency gains underscore a permanent shift toward digitized, flexible academic resource management.

We can help! Our analysts can customize this e-textbook rental market research report to meet your requirements.

Get in touch

1. Executive Summary

1.1 Market overview

Executive Summary - Chart on Market Overview
Executive Summary - Data Table on Market Overview
Executive Summary - Chart on Global Market Characteristics
Executive Summary - Chart on Market by Geography
Executive Summary - Chart on Market Segmentation by End-user
Executive Summary - Chart on Market Segmentation by Revenue Stream
Executive Summary - Chart on Market Segmentation by Product
Executive Summary - Chart on Incremental Growth
Executive Summary - Data Table on Incremental Growth
Executive Summary - Chart on Company Market Positioning

2. Technavio Analysis

2.1 Analysis of price sensitivity, lifecycle, customer purchase basket, adoption rates, and purchase criteria

2.2 Criticality of inputs and Factors of differentiation

Chart on Overview on criticality of inputs and factors of differentiation

2.3 Factors of disruption

Chart on Overview on factors of disruption

2.4 Impact of drivers and challenges

Chart on Impact of drivers and challenges in 2025 and 2030

3. Market Landscape

3.1 Market ecosystem

Chart on Parent Market
Data Table on - Parent Market

3.2 Market characteristics

Chart on Market characteristics analysis

3.3 Value chain analysis

Chart on Value chain analysis

4. Market Sizing

4.1 Market definition

Data Table on Offerings of companies included in the market definition

4.2 Market segment analysis

Market segments

4.3 Market size 2025

4.4 Market outlook: Forecast for 2025-2030

Chart on Global - Market size and forecast 2025-2030 ($ thousand)
Data Table on Global - Market size and forecast 2025-2030 ($ thousand)
Chart on Global Market: Year-over-year growth 2025-2030 (%)
Data Table on Global Market: Year-over-year growth 2025-2030 (%)

5. Historic Market Size

5.1 Global E-Textbook Rental Market 2020 - 2024

Historic Market Size - Data Table on Global E-Textbook Rental Market 2020 - 2024 ($ thousand)

5.2 End-user segment analysis 2020 - 2024

Historic Market Size - End-user Segment 2020 - 2024 ($ thousand)

5.3 Revenue Stream segment analysis 2020 - 2024

Historic Market Size - Revenue Stream Segment 2020 - 2024 ($ thousand)

5.4 Product segment analysis 2020 - 2024

Historic Market Size - Product Segment 2020 - 2024 ($ thousand)

5.5 Geography segment analysis 2020 - 2024

Historic Market Size - Geography Segment 2020 - 2024 ($ thousand)

5.6 Country segment analysis 2020 - 2024

Historic Market Size - Country Segment 2020 - 2024 ($ thousand)

6. Qualitative Analysis

6.1 Impact of AI on Global E-textbook Rental Market

6.2 Impact of Geopolitical Conflicts on Global E-textbook Rental Market

7. Five Forces Analysis

7.1 Five forces summary

Five forces analysis - Comparison between 2025 and 2030

7.2 Bargaining power of buyers

Bargaining power of buyers - Impact of key factors 2025 and 2030

7.3 Bargaining power of suppliers

Bargaining power of suppliers - Impact of key factors in 2025 and 2030

7.4 Threat of new entrants

Threat of new entrants - Impact of key factors in 2025 and 2030

7.5 Threat of substitutes

Threat of substitutes - Impact of key factors in 2025 and 2030

7.6 Threat of rivalry

Threat of rivalry - Impact of key factors in 2025 and 2030

7.7 Market condition

Chart on Market condition - Five forces 2025 and 2030

8. Market Segmentation by End-user

8.1 Market segments

Chart on End-user - Market share 2025-2030 (%)
Data Table on End-user - Market share 2025-2030 (%)

8.2 Comparison by End-user

Chart on Comparison by End-user
Data Table on Comparison by End-user

8.3 Academic - Market size and forecast 2025-2030

Chart on Academic - Market size and forecast 2025-2030 ($ thousand)
Data Table on Academic - Market size and forecast 2025-2030 ($ thousand)
Chart on Academic - Year-over-year growth 2025-2030 (%)
Data Table on Academic - Year-over-year growth 2025-2030 (%)

8.4 Non-academic - Market size and forecast 2025-2030

Chart on Non-academic - Market size and forecast 2025-2030 ($ thousand)
Data Table on Non-academic - Market size and forecast 2025-2030 ($ thousand)
Chart on Non-academic - Year-over-year growth 2025-2030 (%)
Data Table on Non-academic - Year-over-year growth 2025-2030 (%)

8.5 Market opportunity by End-user

Market opportunity by End-user ($ thousand)
Data Table on Market opportunity by End-user ($ thousand)

9. Market Segmentation by Revenue Stream

9.1 Market segments

Chart on Revenue Stream - Market share 2025-2030 (%)
Data Table on Revenue Stream - Market share 2025-2030 (%)

9.2 Comparison by Revenue Stream

Chart on Comparison by Revenue Stream
Data Table on Comparison by Revenue Stream

9.3 Subscription services - Market size and forecast 2025-2030

Chart on Subscription services - Market size and forecast 2025-2030 ($ thousand)
Data Table on Subscription services - Market size and forecast 2025-2030 ($ thousand)
Chart on Subscription services - Year-over-year growth 2025-2030 (%)
Data Table on Subscription services - Year-over-year growth 2025-2030 (%)

9.4 Pay-as-you-go-model - Market size and forecast 2025-2030

Chart on Pay-as-you-go-model - Market size and forecast 2025-2030 ($ thousand)
Data Table on Pay-as-you-go-model - Market size and forecast 2025-2030 ($ thousand)
Chart on Pay-as-you-go-model - Year-over-year growth 2025-2030 (%)
Data Table on Pay-as-you-go-model - Year-over-year growth 2025-2030 (%)

9.5 Market opportunity by Revenue Stream

Market opportunity by Revenue Stream ($ thousand)
Data Table on Market opportunity by Revenue Stream ($ thousand)

10. Market Segmentation by Product

10.1 Market segments

Chart on Product - Market share 2025-2030 (%)
Data Table on Product - Market share 2025-2030 (%)

10.2 Comparison by Product

Chart on Comparison by Product
Data Table on Comparison by Product

10.3 STEM - Market size and forecast 2025-2030

Chart on STEM - Market size and forecast 2025-2030 ($ thousand)
Data Table on STEM - Market size and forecast 2025-2030 ($ thousand)
Chart on STEM - Year-over-year growth 2025-2030 (%)
Data Table on STEM - Year-over-year growth 2025-2030 (%)

10.4 Business and economics - Market size and forecast 2025-2030

Chart on Business and economics - Market size and forecast 2025-2030 ($ thousand)
Data Table on Business and economics - Market size and forecast 2025-2030 ($ thousand)
Chart on Business and economics - Year-over-year growth 2025-2030 (%)
Data Table on Business and economics - Year-over-year growth 2025-2030 (%)

10.5 Humanities and social sciences - Market size and forecast 2025-2030

Chart on Humanities and social sciences - Market size and forecast 2025-2030 ($ thousand)
Data Table on Humanities and social sciences - Market size and forecast 2025-2030 ($ thousand)
Chart on Humanities and social sciences - Year-over-year growth 2025-2030 (%)
Data Table on Humanities and social sciences - Year-over-year growth 2025-2030 (%)

10.6 Law - Market size and forecast 2025-2030

Chart on Law - Market size and forecast 2025-2030 ($ thousand)
Data Table on Law - Market size and forecast 2025-2030 ($ thousand)
Chart on Law - Year-over-year growth 2025-2030 (%)
Data Table on Law - Year-over-year growth 2025-2030 (%)

10.7 Others - Market size and forecast 2025-2030

Chart on Others - Market size and forecast 2025-2030 ($ thousand)
Data Table on Others - Market size and forecast 2025-2030 ($ thousand)
Chart on Others - Year-over-year growth 2025-2030 (%)
Data Table on Others - Year-over-year growth 2025-2030 (%)

10.8 Market opportunity by Product

Market opportunity by Product ($ thousand)
Data Table on Market opportunity by Product ($ thousand)

11. Customer Landscape

11.1 Customer landscape overview

Analysis of price sensitivity, lifecycle, customer purchase basket, adoption rates, and purchase criteria

12. Geographic Landscape

12.1 Geographic segmentation

Chart on Market share by geography 2025-2030 (%)
Data Table on Market share by geography 2025-2030 (%)

12.2 Geographic comparison

Chart on Geographic comparison
Data Table on Geographic comparison

12.3 North America - Market size and forecast 2025-2030

Chart on North America - Market size and forecast 2025-2030 ($ thousand)
Data Table on North America - Market size and forecast 2025-2030 ($ thousand)
Chart on North America - Year-over-year growth 2025-2030 (%)
Data Table on North America - Year-over-year growth 2025-2030 (%)
Chart on Regional Comparison - North America
Data Table on Regional Comparison - North America

12.3.1 US - Market size and forecast 2025-2030

Chart on US - Market size and forecast 2025-2030 ($ thousand)
Data Table on US - Market size and forecast 2025-2030 ($ thousand)
Chart on US - Year-over-year growth 2025-2030 (%)
Data Table on US - Year-over-year growth 2025-2030 (%)

12.3.2 Canada - Market size and forecast 2025-2030

Chart on Canada - Market size and forecast 2025-2030 ($ thousand)
Data Table on Canada - Market size and forecast 2025-2030 ($ thousand)
Chart on Canada - Year-over-year growth 2025-2030 (%)
Data Table on Canada - Year-over-year growth 2025-2030 (%)

12.3.3 Mexico - Market size and forecast 2025-2030

Chart on Mexico - Market size and forecast 2025-2030 ($ thousand)
Data Table on Mexico - Market size and forecast 2025-2030 ($ thousand)
Chart on Mexico - Year-over-year growth 2025-2030 (%)
Data Table on Mexico - Year-over-year growth 2025-2030 (%)

12.4 Europe - Market size and forecast 2025-2030

Chart on Europe - Market size and forecast 2025-2030 ($ thousand)
Data Table on Europe - Market size and forecast 2025-2030 ($ thousand)
Chart on Europe - Year-over-year growth 2025-2030 (%)
Data Table on Europe - Year-over-year growth 2025-2030 (%)
Chart on Regional Comparison - Europe
Data Table on Regional Comparison - Europe

12.4.1 Germany - Market size and forecast 2025-2030

Chart on Germany - Market size and forecast 2025-2030 ($ thousand)
Data Table on Germany - Market size and forecast 2025-2030 ($ thousand)
Chart on Germany - Year-over-year growth 2025-2030 (%)
Data Table on Germany - Year-over-year growth 2025-2030 (%)

12.4.2 UK - Market size and forecast 2025-2030

Chart on UK - Market size and forecast 2025-2030 ($ thousand)
Data Table on UK - Market size and forecast 2025-2030 ($ thousand)
Chart on UK - Year-over-year growth 2025-2030 (%)
Data Table on UK - Year-over-year growth 2025-2030 (%)

12.4.3 France - Market size and forecast 2025-2030

Chart on France - Market size and forecast 2025-2030 ($ thousand)
Data Table on France - Market size and forecast 2025-2030 ($ thousand)
Chart on France - Year-over-year growth 2025-2030 (%)
Data Table on France - Year-over-year growth 2025-2030 (%)

12.4.4 Italy - Market size and forecast 2025-2030

Chart on Italy - Market size and forecast 2025-2030 ($ thousand)
Data Table on Italy - Market size and forecast 2025-2030 ($ thousand)
Chart on Italy - Year-over-year growth 2025-2030 (%)
Data Table on Italy - Year-over-year growth 2025-2030 (%)

12.4.5 Spain - Market size and forecast 2025-2030

Chart on Spain - Market size and forecast 2025-2030 ($ thousand)
Data Table on Spain - Market size and forecast 2025-2030 ($ thousand)
Chart on Spain - Year-over-year growth 2025-2030 (%)
Data Table on Spain - Year-over-year growth 2025-2030 (%)

12.4.6 The Netherlands - Market size and forecast 2025-2030

Chart on The Netherlands - Market size and forecast 2025-2030 ($ thousand)
Data Table on The Netherlands - Market size and forecast 2025-2030 ($ thousand)
Chart on The Netherlands - Year-over-year growth 2025-2030 (%)
Data Table on The Netherlands - Year-over-year growth 2025-2030 (%)

12.5 APAC - Market size and forecast 2025-2030

Chart on APAC - Market size and forecast 2025-2030 ($ thousand)
Data Table on APAC - Market size and forecast 2025-2030 ($ thousand)
Chart on APAC - Year-over-year growth 2025-2030 (%)
Data Table on APAC - Year-over-year growth 2025-2030 (%)
Chart on Regional Comparison - APAC
Data Table on Regional Comparison - APAC

12.5.1 China - Market size and forecast 2025-2030

Chart on China - Market size and forecast 2025-2030 ($ thousand)
Data Table on China - Market size and forecast 2025-2030 ($ thousand)
Chart on China - Year-over-year growth 2025-2030 (%)
Data Table on China - Year-over-year growth 2025-2030 (%)

12.5.2 Japan - Market size and forecast 2025-2030

Chart on Japan - Market size and forecast 2025-2030 ($ thousand)
Data Table on Japan - Market size and forecast 2025-2030 ($ thousand)
Chart on Japan - Year-over-year growth 2025-2030 (%)
Data Table on Japan - Year-over-year growth 2025-2030 (%)

12.5.3 India - Market size and forecast 2025-2030

Chart on India - Market size and forecast 2025-2030 ($ thousand)
Data Table on India - Market size and forecast 2025-2030 ($ thousand)
Chart on India - Year-over-year growth 2025-2030 (%)
Data Table on India - Year-over-year growth 2025-2030 (%)

12.5.4 South Korea - Market size and forecast 2025-2030

Chart on South Korea - Market size and forecast 2025-2030 ($ thousand)
Data Table on South Korea - Market size and forecast 2025-2030 ($ thousand)
Chart on South Korea - Year-over-year growth 2025-2030 (%)
Data Table on South Korea - Year-over-year growth 2025-2030 (%)

12.5.5 Australia - Market size and forecast 2025-2030

Chart on Australia - Market size and forecast 2025-2030 ($ thousand)
Data Table on Australia - Market size and forecast 2025-2030 ($ thousand)
Chart on Australia - Year-over-year growth 2025-2030 (%)
Data Table on Australia - Year-over-year growth 2025-2030 (%)

12.5.6 Indonesia - Market size and forecast 2025-2030

Chart on Indonesia - Market size and forecast 2025-2030 ($ thousand)
Data Table on Indonesia - Market size and forecast 2025-2030 ($ thousand)
Chart on Indonesia - Year-over-year growth 2025-2030 (%)
Data Table on Indonesia - Year-over-year growth 2025-2030 (%)

12.6 South America - Market size and forecast 2025-2030

Chart on South America - Market size and forecast 2025-2030 ($ thousand)
Data Table on South America - Market size and forecast 2025-2030 ($ thousand)
Chart on South America - Year-over-year growth 2025-2030 (%)
Data Table on South America - Year-over-year growth 2025-2030 (%)
Chart on Regional Comparison - South America
Data Table on Regional Comparison - South America

12.6.1 Brazil - Market size and forecast 2025-2030

Chart on Brazil - Market size and forecast 2025-2030 ($ thousand)
Data Table on Brazil - Market size and forecast 2025-2030 ($ thousand)
Chart on Brazil - Year-over-year growth 2025-2030 (%)
Data Table on Brazil - Year-over-year growth 2025-2030 (%)

12.6.2 Argentina - Market size and forecast 2025-2030

Chart on Argentina - Market size and forecast 2025-2030 ($ thousand)
Data Table on Argentina - Market size and forecast 2025-2030 ($ thousand)
Chart on Argentina - Year-over-year growth 2025-2030 (%)
Data Table on Argentina - Year-over-year growth 2025-2030 (%)

12.6.3 Chile - Market size and forecast 2025-2030

Chart on Chile - Market size and forecast 2025-2030 ($ thousand)
Data Table on Chile - Market size and forecast 2025-2030 ($ thousand)
Chart on Chile - Year-over-year growth 2025-2030 (%)
Data Table on Chile - Year-over-year growth 2025-2030 (%)

12.7 Middle East and Africa - Market size and forecast 2025-2030

Chart on Middle East and Africa - Market size and forecast 2025-2030 ($ thousand)
Data Table on Middle East and Africa - Market size and forecast 2025-2030 ($ thousand)
Chart on Middle East and Africa - Year-over-year growth 2025-2030 (%)
Data Table on Middle East and Africa - Year-over-year growth 2025-2030 (%)
Chart on Regional Comparison - Middle East and Africa
Data Table on Regional Comparison - Middle East and Africa

12.7.1 Saudi Arabia - Market size and forecast 2025-2030

Chart on Saudi Arabia - Market size and forecast 2025-2030 ($ thousand)
Data Table on Saudi Arabia - Market size and forecast 2025-2030 ($ thousand)
Chart on Saudi Arabia - Year-over-year growth 2025-2030 (%)
Data Table on Saudi Arabia - Year-over-year growth 2025-2030 (%)

12.7.2 UAE - Market size and forecast 2025-2030

Chart on UAE - Market size and forecast 2025-2030 ($ thousand)
Data Table on UAE - Market size and forecast 2025-2030 ($ thousand)
Chart on UAE - Year-over-year growth 2025-2030 (%)
Data Table on UAE - Year-over-year growth 2025-2030 (%)

12.7.3 South Africa - Market size and forecast 2025-2030

Chart on South Africa - Market size and forecast 2025-2030 ($ thousand)
Data Table on South Africa - Market size and forecast 2025-2030 ($ thousand)
Chart on South Africa - Year-over-year growth 2025-2030 (%)
Data Table on South Africa - Year-over-year growth 2025-2030 (%)

12.7.4 Israel - Market size and forecast 2025-2030

Chart on Israel - Market size and forecast 2025-2030 ($ thousand)
Data Table on Israel - Market size and forecast 2025-2030 ($ thousand)
Chart on Israel - Year-over-year growth 2025-2030 (%)
Data Table on Israel - Year-over-year growth 2025-2030 (%)

12.7.5 Turkey - Market size and forecast 2025-2030

Chart on Turkey - Market size and forecast 2025-2030 ($ thousand)
Data Table on Turkey - Market size and forecast 2025-2030 ($ thousand)
Chart on Turkey - Year-over-year growth 2025-2030 (%)
Data Table on Turkey - Year-over-year growth 2025-2030 (%)

12.8 Market opportunity by geography

Market opportunity by geography ($ thousand)
Data Tables on Market opportunity by geography ($ thousand)

13. Drivers, Challenges, and Opportunity

13.1 Market drivers

Cost-effective pricing model
Increasing number of publishers going digital
Rising availability of online comparison sites

13.2 Market challenges

Increasing availability of open-source educational content is restricting market growth
Emerging piracy issues for publishers
Unfavourable license terms is declining market growth

13.3 Impact of drivers and challenges

Impact of drivers and challenges in 2025 and 2030

13.4 Market opportunities

Rising integration of software with digital textbooks
Emergence of compatible e-textbook formats
Growing popularity of e-commerce is augmenting market growth

14. Competitive Landscape

14.1 Overview

14.2

Overview on criticality of inputs and factors of differentiation

14.3 Landscape disruption

Overview on factors of disruption

14.4 Industry risks

Impact of key risks on business

15. Competitive Analysis

15.1 Companies profiled

Companies covered

15.2 Company ranking index

15.3 Market positioning of companies

Matrix on companies position and classification

15.4 Amazon.com Inc.

Amazon.com Inc. - Overview
Amazon.com Inc. - Business segments
Amazon.com Inc. - Key news
Amazon.com Inc. - Key offerings
Amazon.com Inc. - Segment focus
SWOT

15.5 Barnes and Noble Education Inc.

Barnes and Noble Education Inc. - Overview
Barnes and Noble Education Inc. - Business segments
Barnes and Noble Education Inc. - Key offerings
Barnes and Noble Education Inc. - Segment focus
SWOT

15.6 Bloomsbury Publishing Plc

Bloomsbury Publishing Plc - Overview
Bloomsbury Publishing Plc - Business segments
Bloomsbury Publishing Plc - Key offerings
Bloomsbury Publishing Plc - Segment focus
SWOT

15.7 Cengage Learning Inc.

Cengage Learning Inc. - Overview
Cengage Learning Inc. - Product / Service
Cengage Learning Inc. - Key offerings
SWOT

15.8 eCampus.com

eCampus.com - Overview
eCampus.com - Product / Service
eCampus.com - Key offerings
SWOT

15.9 Elsevier Ltd.

Elsevier Ltd. - Overview
Elsevier Ltd. - Product / Service
Elsevier Ltd. - Key offerings
SWOT

15.10 Follett Corp.

Follett Corp. - Overview
Follett Corp. - Product / Service
Follett Corp. - Key offerings
SWOT

15.11 John Wiley and Sons Inc.

John Wiley and Sons Inc. - Overview
John Wiley and Sons Inc. - Business segments
John Wiley and Sons Inc. - Key offerings
John Wiley and Sons Inc. - Segment focus
SWOT

15.12 Macmillan Learning

Macmillan Learning - Overview
Macmillan Learning - Product / Service
Macmillan Learning - Key offerings
SWOT

15.13 McGraw Hill LLC

McGraw Hill LLC - Overview
McGraw Hill LLC - Product / Service
McGraw Hill LLC - Key offerings
SWOT

15.14 OverDrive Inc.

OverDrive Inc. - Overview
OverDrive Inc. - Product / Service
OverDrive Inc. - Key offerings
SWOT

15.15 Oxford University Press

Oxford University Press - Overview
Oxford University Press - Product / Service
Oxford University Press - Key offerings
SWOT

15.16 Pearson Plc

Pearson Plc - Overview
Pearson Plc - Business segments
Pearson Plc - Key offerings
Pearson Plc - Segment focus
SWOT

15.17 Taylor and Francis Group

Taylor and Francis Group - Overview
Taylor and Francis Group - Product / Service
Taylor and Francis Group - Key offerings
SWOT

15.18 VitalSource Technologies LLC

VitalSource Technologies LLC - Overview
VitalSource Technologies LLC - Product / Service
VitalSource Technologies LLC - Key offerings
SWOT

16. Appendix

16.1 Scope of the report

Market definition
Objectives
Notes and caveats

16.2 Inclusions and exclusions checklist

Inclusions checklist
Exclusions checklist

16.3 Currency conversion rates for US$

16.4 Research methodology

16.5 Data procurement

Information sources

16.6 Data validation

16.7 Validation techniques employed for market sizing

16.8 Data synthesis

16.9 360 degree market analysis

16.10 List of abbreviations

Research Methodology

Technavio presents a detailed picture of the market by way of study, synthesis, and summation of data from multiple sources. The analysts have presented the various facets of the market with a particular focus on identifying the key industry influencers. The data thus presented is comprehensive, reliable, and the result of extensive research, both primary and secondary.

INFORMATION SOURCES

Primary sources

  • Manufacturers and suppliers
  • Channel partners
  • Industry experts
  • Strategic decision makers

Secondary sources

  • Industry journals and periodicals
  • Government data
  • Financial reports of key industry players
  • Historical data
  • Press releases

DATA ANALYSIS

Data Synthesis

  • Collation of data
  • Estimation of key figures
  • Analysis of derived insights

Data Validation

  • Triangulation with data models
  • Reference against proprietary databases
  • Corroboration with industry experts

REPORT WRITING

Qualitative

  • Market drivers
  • Market challenges
  • Market trends
  • Five forces analysis

Quantitative

  • Market size and forecast
  • Market segmentation
  • Geographical insights
  • Competitive landscape

Interested in this report?

Get your sample now to see our research methodology and insights!

Download Now

Frequently Asked Questions

E-Textbook Rental market growth will increase by USD 1228864.4 thousand thousand during 2026-2030.

The E-Textbook Rental market is expected to grow at a CAGR of 25.1% during 2026-2030.

E-Textbook Rental market is segmented by End-user (Academic, Non-academic) Revenue stream (Subscription services, Pay-as-you-go-model) Product (STEM, Business and economics, Humanities and social sciences, Law, Others)

Amazon.com Inc., Barnes and Noble Education Inc., BibliU Ltd., Bloomsbury Publishing Plc, Cengage Learning Inc., Chegg Inc., eCampus.com, Elsevier Ltd., Follett Corp., John Wiley and Sons Inc., Kortext Ltd, Macmillan Learning, McGraw Hill LLC, OverDrive Inc., Oxford University Press, Pearson Plc, Perlego Ltd, RedShelf Inc., Snapplify Pty Ltd, Taylor and Francis Group, Tophatmonocle Corp., VitalSource Technologies LLC are a few of the key vendors in the E-Textbook Rental market.

North America will register the highest growth rate of 36.8% among the other regions. Therefore, the E-Textbook Rental market in North America is expected to garner significant business opportunities for the vendors during the forecast period.

US, Canada, Mexico, Germany, UK, France, Italy, Spain, The Netherlands, China, Japan, India, South Korea, Australia, Indonesia, Brazil, Argentina, Chile, Saudi Arabia, UAE, South Africa, Israel, Turkey

  • Cost-effective pricing model is the driving factor this market.

The E-Textbook Rental market vendors should focus on grabbing business opportunities from the End-user segment as it accounted for the largest market share in the base year.
RIA - Research AI Assistant
Ask RIA
