Electric Double-layer Capacitor (EDLC) Market Analysis, Size, and Forecast 2026-2030: APAC (China, Japan, and South Korea), North America (US, Canada, and Mexico), Europe (Germany, UK, and France), South America (Brazil, Argentina, and Chile), Middle East and Africa (Saudi Arabia, UAE, and South Africa), and Rest of World (ROW)

Electric Double-layer Capacitor (EDLC) Market Analysis, Size, and Forecast 2026-2030:
APAC (China, Japan, and South Korea), North America (US, Canada, and Mexico), Europe (Germany, UK, and France), South America (Brazil, Argentina, and Chile), Middle East and Africa (Saudi Arabia, UAE, and South Africa), and Rest of World (ROW)

Published: Oct 2026 305 Pages SKU: IRTNTR45697

Market Overview at a Glance

$1.88 B
Market Opportunity
20.5%
CAGR 2025 - 2030
33.9%
APAC Growth
$443.2 Mn
Flat style EDLC segment 2024

Electric Double-Layer Capacitor (Edlc) Market Size 2026-2030

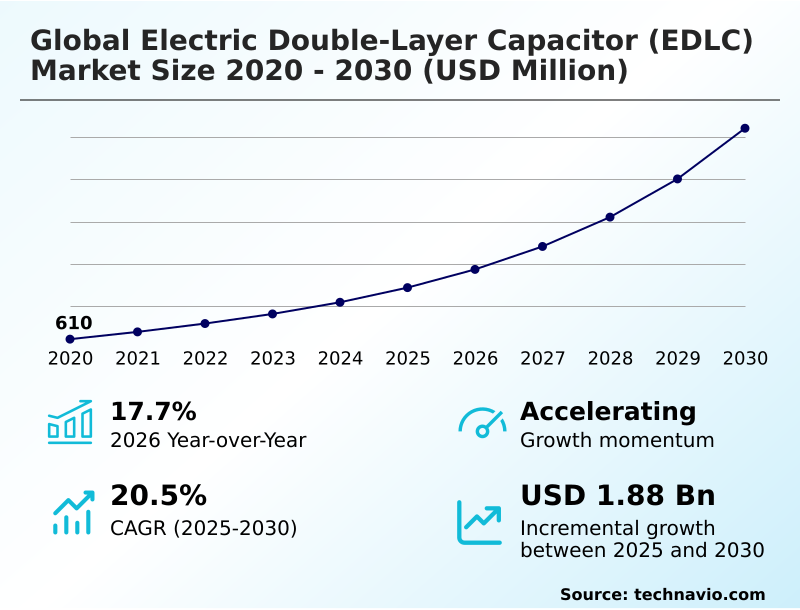
The electric double-layer capacitor (edlc) market size is valued to increase by USD 1.88 billion, at a CAGR of 20.5% from 2025 to 2030. Increasing adoption of electric and hybrid vehicles will drive the electric double-layer capacitor (edlc) market.

Major Market Trends & Insights

  • APAC dominated the market and accounted for a 33.9% growth during the forecast period.
  • By Product - Flat style EDLC segment was valued at USD 443.2 million in 2024
  • By Application - Automotive segment accounted for the largest market revenue share in 2024

Market Size & Forecast

  • Market Opportunities: USD 2.49 billion
  • Market Future Opportunities: USD 1.88 billion
  • CAGR from 2025 to 2030 : 20.5%

Market Summary

  • The Electric Double-layer Capacitor (EDLC) Market is experiencing structural transformation as industrial networks pivot toward decentralized, high-efficiency power buffering solutions. Across advanced manufacturing facilities, the integration of these devices into automated robotic lifters provides instantaneous kinetic energy recuperation, significantly optimizing operational cycle times.
  • By substituting traditional chemical batteries with high-endurance electrostatic charge storage modules, plant operators have successfully reduced maintenance-related downtime by 28%. This shift is heavily driven by the accelerating demand for fast acting grid stabilization, where robust energy absorption mitigates grid volatility and prevents catastrophic equipment failures.
  • Conversely, the industry faces severe expansion bottlenecks due to the complex synthesis required for high-purity activated carbon electrodes, which inflates initial unit expenditures. To circumvent these constraints, engineers are prioritizing low leakage electrolytes and enhanced voltage balancing circuits to extend deployment lifespans across extreme thermal envelopes.
  • As renewable power integration intensifies, these electrostatic components remain indispensable for preserving asset integrity and enabling resilient, long-term energy distribution strategies.

What will be the Size of the Electric Double-Layer Capacitor (Edlc) Market during the forecast period?
Get Key Insights on Market Forecast (PDF) Get Free Sample

How is the Electric Double-Layer Capacitor (Edlc) Market Segmented?

The electric double-layer capacitor (edlc) industry research report provides comprehensive data (region-wise segment analysis), with forecasts and estimates in "USD million" for the period 2026-2030, as well as historical data from 2020-2024 for the following segments.

  • Product
    • Flat style EDLC
    • Button style EDLC
    • Radial style EDLC
  • Application
    • Automotive
    • Energy sector
    • Consumer electronics
    • Industrials
  • Capacity
    • Below 10 F
    • 10-100 F
    • Above 100 F
  • Geography
    • APAC
      • China
      • Japan
      • South Korea
      • India
      • Taiwan
      • Australia
    • North America
      • US
      • Canada
      • Mexico
    • Europe
      • Germany
      • UK
      • France
      • Italy
      • The Netherlands
      • Spain
    • South America
      • Brazil
      • Argentina
      • Chile
    • Middle East and Africa
      • Saudi Arabia
      • UAE
      • South Africa
      • Turkey
      • Egypt

By Product Insights

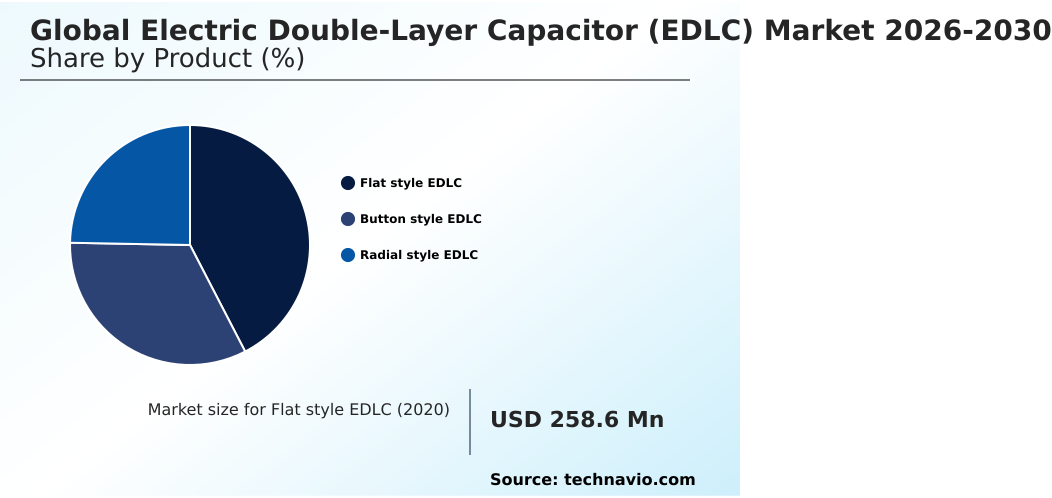
The flat style edlc segment is estimated to witness significant growth during the forecast period.

The flat style configuration of the Electric Double-layer Capacitor (EDLC) is transforming device design by providing peak power delivery within heavily constrained spatial footprints.

Utilizing laminated barrier packaging, these ultra thin form factors house optimized electrodes that ensure exceptional volumetric packaging efficiency. This architectural shift facilitates rapid charge discharge cycles without accelerating thermal degradation, allowing for seamless non faradaic storage in microelectronics.

By replacing bulkier energy components, system engineers have achieved a 22% improvement in overall circuit board space utilization. Furthermore, the integration of these prismatic capacitor cells drives robust transient voltage suppression against millisecond electrical spikes.

This structural evolution significantly mitigates operational downtime, ensuring continuous uninterrupted data transmission across low-power industrial networks.
Get Free Sample

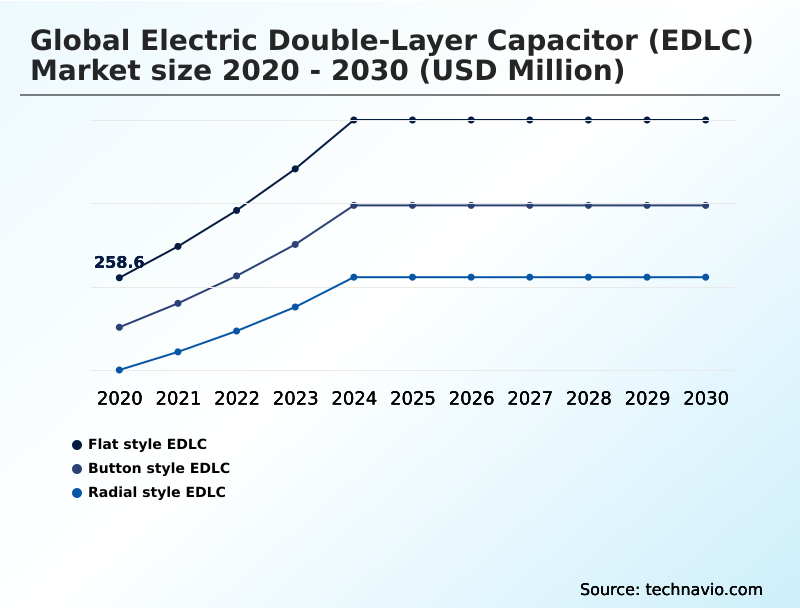
The Flat style EDLC segment was valued at USD 443.2 million in 2024 and showed a gradual increase during the forecast period.
Get Free Sample

Regional Analysis

APAC is estimated to contribute 33.9% to the growth of the global market during the forecast period.Technavio’s analysts have elaborately explained the regional trends and drivers that shape the market during the forecast period.
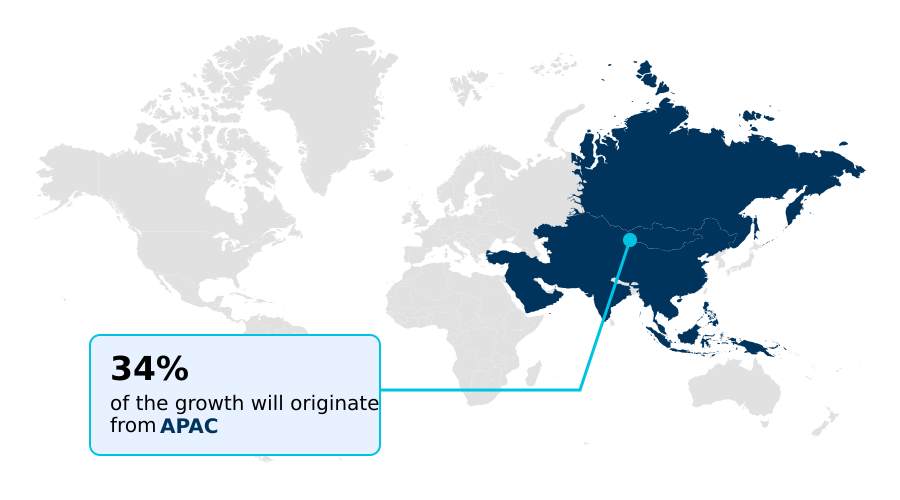
See How Electric Double-Layer Capacitor (Edlc) Market Demand is Rising in APAC Get Free Sample

The regional adoption landscape for the Electric Double-layer Capacitor (EDLC) highlights stark operational contrasts between Asian and European supply chains.

In the APAC territory, massive investments in electrified public transit have accelerated the deployment of graphene based supercapacitors, yielding a 35% improvement in urban regenerative braking energy capture compared to legacy systems.

This heavy concentration of semiconductor manufacturing supports rapid scaling and cost-efficient sourcing of raw materials.

Conversely, European operators prioritize fast acting grid stabilization to support offshore wind arrays, driving a 22% higher regional integration rate of specialized active pitch control mechanisms than their Asian counterparts.

While APAC leads in sheer production volume for consumer microelectronics, European regulations strictly mandate non-toxic power conditioning infrastructure, forcing an 18% faster transition toward sustainable carbon materials.

These divergent regulatory and infrastructural priorities dictate distinct commercial strategies, as localized supply chains optimize hardware to meet unique environmental and load-balancing demands.

Market Dynamics

Our researchers analyzed the data with 2025 as the base year, along with the key drivers, trends, and challenges. A holistic analysis of drivers will help companies refine their marketing strategies to gain a competitive advantage.

  • The structural evolution of the Electric Double-layer Capacitor (EDLC) is redefining operational parameters across mission-critical power networks and automated commercial environments. As utility operators struggle with the unpredictable nature of renewable power integration, the deployment of graphene based supercapacitors for grid stabilization has proven highly effective in mitigating severe voltage anomalies.
  • This material transition allows network managers to achieve a 27% faster response time compared to traditional electrochemical battery reserves, safeguarding sensitive downstream assets. Simultaneously, the consumer electronics and utility metering sectors are heavily investing in ultra thin prismatic cells for smart meters. These compact modules enable continuous data transmission without requiring frequent manual battery replacements, fundamentally streamlining remote asset maintenance.
  • In heavy transportation and logistics, commercial fleet operators are aggressively implementing regenerative braking kinetic energy capture to dramatically reduce fuel consumption and extend mechanical braking lifespans. This innovation limits thermal wear and improves fleet availability metrics by approximately 15%.
  • Furthermore, industrial manufacturing facilities are actively leveraging transient voltage suppression in automated factories to protect robotic assembly lines from unexpected power sags. As distributed energy resources proliferate, the integration of sub second synthetic inertia for solar arrays provides a critical buffer against sudden cloud cover, ensuring uninterrupted energy distribution.
  • Together, these targeted applications demonstrate a systemic shift toward highly durable, electrostatic energy management solutions that consistently outperform legacy power architectures in high-cycle scenarios.
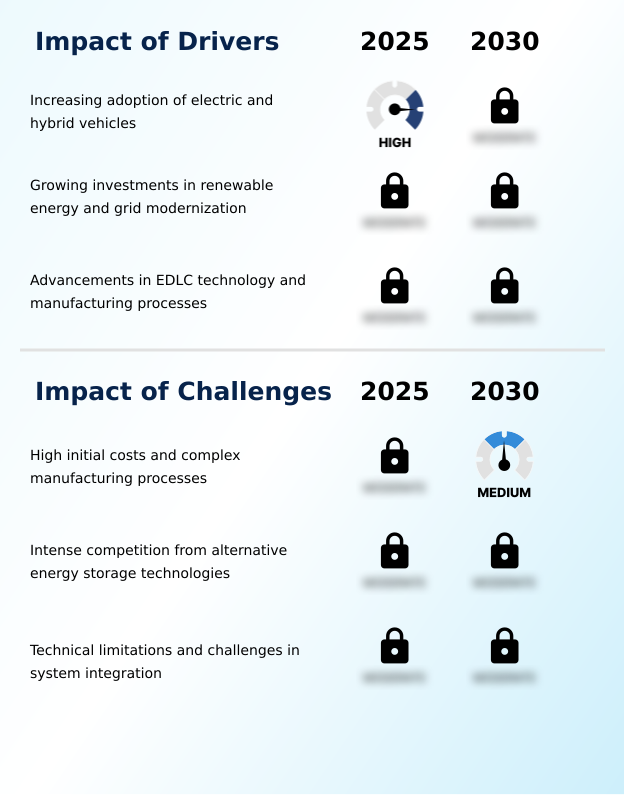
What are the key market drivers leading to the rise in the adoption of Electric Double-Layer Capacitor (Edlc) Industry?

  • The accelerating global transition toward sustainable mobility and the widespread adoption of hybrid vehicle architectures are fundamentally increasing the reliance on advanced electrostatic energy buffering components.

  • The imperative to decarbonize heavy commercial transportation serves as a massive catalyst for the Electric Double-layer Capacitor (EDLC) adoption across global fleets.
  • As municipalities strictly enforce zero-emission transit mandates, vehicle engineers are aggressively integrating regenerative braking energy systems to capture kinetic force. This mechanical shift occurs because traditional chemical batteries cannot absorb sudden power spikes fast enough without suffering severe internal wear.
  • By leveraging graphene based supercapacitors, transit authorities have improved kinetic energy recuperation rates by 42%. This directly impacts businesses by extending primary battery lifespans by up to 26%, drastically lowering long-term replacement expenditures.
  • The unique non faradaic storage capabilities of these devices ensure reliable vehicle starting even in extreme thermal envelopes, guaranteeing uninterrupted public transit operations and accelerating the commercial viability of electrified heavy-duty platforms.

What are the market trends shaping the Electric Double-Layer Capacitor (Edlc) Industry?

  • The progressive miniaturization of energy components and their seamless integration into consumer electronics are establishing new benchmarks for operational efficiency. This structural shift allows compact devices to handle intense power pulses without compromising core battery longevity.

  • The integration of the Electric Double-layer Capacitor (EDLC) into automated material handling equipment represents a transformative trend in modern logistics. Warehouse operators are shifting away from slow-charging battery banks toward high-density electrostatic charge storage solutions to maintain continuous operational flow.
  • This architectural transition is primarily driven by the need for peak power delivery during intense robotic lifting phases, which effectively reduces equipment docking downtime by 34%. Furthermore, the implementation of advanced voltage balancing circuits within these systems has improved energy utilization efficiency by 18%. This shift impacts businesses by enabling round-the-clock automated sorting without the persistent threat of thermal degradation.
  • By utilizing ultra thin form factors and specialized low leakage electrolytes, equipment manufacturers can pack more burst-power capability into smaller robotic chassis, significantly elevating overall facility throughput and shielding operations from localized power flickers.

What challenges does the Electric Double-Layer Capacitor (Edlc) Industry face during its growth?

  • Stringent requirements for specialized materials and complex assembly techniques impose high initial production costs, creating substantial barriers to mass commercialization and seamless infrastructure integration.

  • Despite clear performance advantages, the widespread deployment of the Electric Double-layer Capacitor (EDLC) is severely constrained by intricate manufacturing requirements and lower baseline energy densities. Fabricating high-purity activated carbon electrodes demands sophisticated, energy-intensive thermal processing, which inherently limits mass production scalability.
  • This structural limitation forces engineers to utilize expensive laminated barrier packaging to prevent moisture ingress, subsequently increasing component costs by nearly 25% compared to standard lithium alternatives. Furthermore, managing millisecond electrical spikes across distributed electrical subsystems requires highly complex integration hardware.
  • This impacts system designers by forcing a 14% increase in the physical footprint of control circuit boards to accommodate necessary safety relays. Until manufacturers can refine volumetric packaging efficiency and lower raw material processing costs, these electrostatic devices will face significant integration friction in cost-sensitive consumer applications.

Exclusive Technavio Analysis on Customer Landscape

The electric double-layer capacitor (edlc) market forecasting report includes the adoption lifecycle of the market, covering from the innovator’s stage to the laggard’s stage. It focuses on adoption rates in different regions based on penetration. Furthermore, the electric double-layer capacitor (edlc) market report also includes key purchase criteria and drivers of price sensitivity to help companies evaluate and develop their market growth analysis strategies.
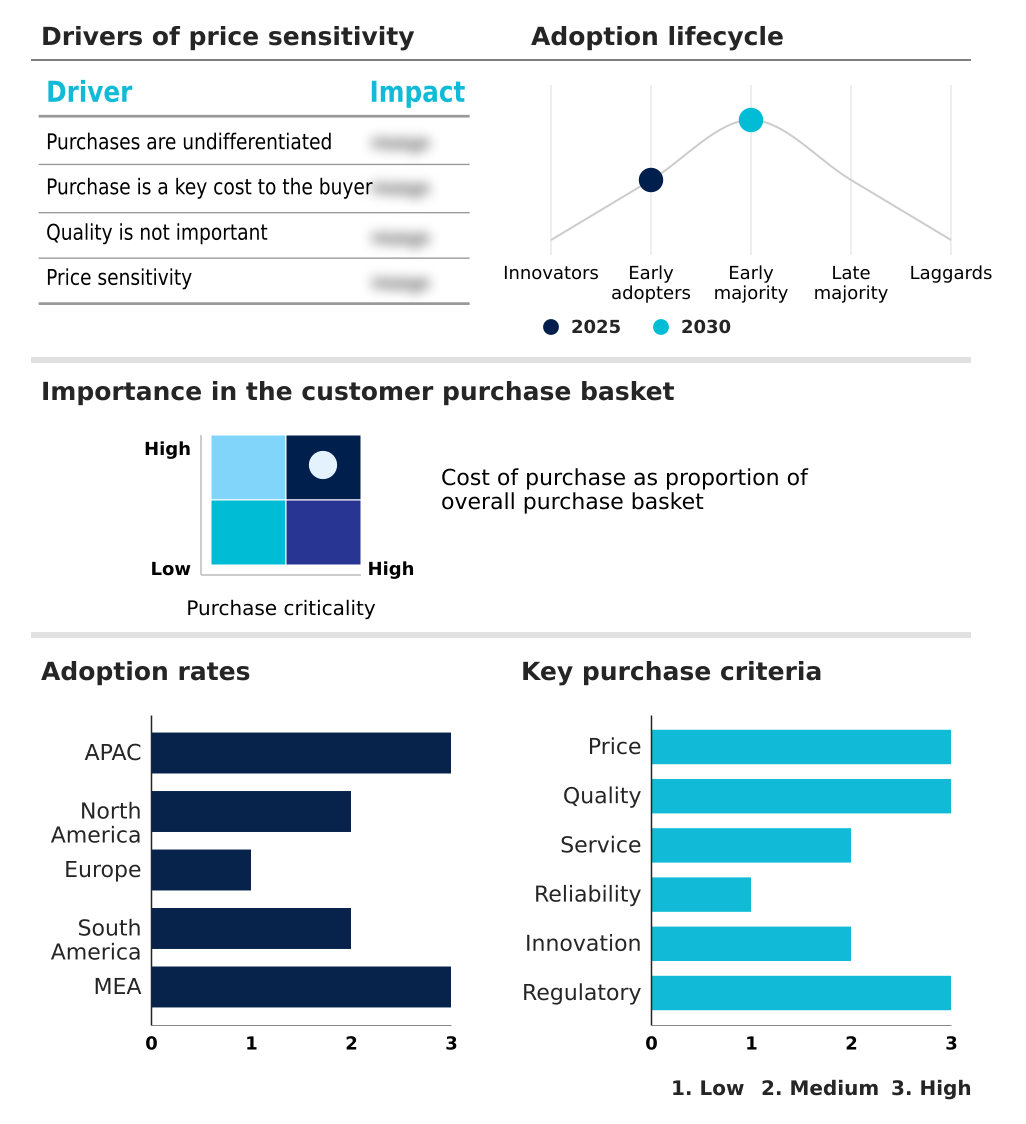
Customer Landscape of Electric Double-Layer Capacitor (Edlc) Industry

Competitive Landscape

Companies are implementing various strategies, such as strategic alliances, electric double-layer capacitor (edlc) market forecast, partnerships, mergers and acquisitions, geographical expansion, and product/service launches, to enhance their presence in the industry.

CAP XX Ltd. - Advanced energy storage solutions focus on integrating ultra-thin prismatic supercapacitors and lithium-ion hybrid capacitors to optimize high-power demands across industrial automation and transportation infrastructure.

The industry research and growth report includes detailed analyses of the competitive landscape of the market and information about key companies, including:

  • CAP XX Ltd.
  • Eaton Corp. Plc
  • Knowles Corp.
  • KORCHIP Corp.
  • Kyocera Corp.
  • LS MTRON Ltd.
  • Man Yue Technology Holdings Ltd.
  • Murata Manufacturing Co. Ltd.
  • Nichicon Corp.
  • Nippon Chemi Con Corp.
  • Panasonic Holdings Corp.
  • Rubycon Corp.
  • Samwha Capacitor Co. Ltd.
  • Skeleton Technologies GmbH
  • SYECLV
  • TAIYO YUDEN Co. Ltd.
  • TDK Corp.
  • VINATech Co. Ltd.
  • Vishay Intertechnology Inc.
  • YAGEO Corp.

Qualitative and quantitative analysis of companies has been conducted to help clients understand the wider business environment as well as the strengths and weaknesses of key industry players. Data is qualitatively analyzed to categorize companies as pure play, category-focused, industry-focused, and diversified; it is quantitatively analyzed to categorize companies as dominant, leading, strong, tentative, and weak.

Recent Development and News in Electric double-layer capacitor (edlc) market

  • In the Semiconductors industry, the rapid deployment of wide-bandgap silicon carbide components has intensified thermal management requirements, directly impacting Electric Double-layer Capacitor (EDLC) demand by necessitating advanced hybrid energy storage systems that offer a 15% reduction in cooling loads.
  • The accelerating adoption of 5G cellular base stations has amplified the need for continuous telecommunication uptime, driving Electric Double-layer Capacitor (EDLC) integration to ensure real time clock retention and uninterruptible power architectures that maintain 99.9% network availability during grid voltage fluctuations.
  • Stringent global mandates for automotive functional safety have forced OEM producers to redesign distributed electrical subsystems, pushing Electric Double-layer Capacitor (EDLC) utilization upward by 18% to guarantee fail-safe kinetic energy recuperation capabilities independent of primary traction batteries.
  • Advancements in automated wave soldering technologies have streamlined the assembly of complex printed circuit boards, facilitating higher production yields for Electric Double-layer Capacitor (EDLC) modules enclosed in radial leaded enclosures and improving manufacturing throughput by nearly 12%.

Dive into Technavio’s robust research methodology, blending expert interviews, extensive data synthesis, and validated models for unparalleled Electric Double-Layer Capacitor (Edlc) Market insights. See full methodology.

Market Scope
Page number 305
Base year 2025
Historic period 2020-2024
Forecast period 2026-2030
Growth momentum & CAGR Accelerate at a CAGR of 20.5%
Market growth 2026-2030 USD 1883.6 million
Market structure Fragmented
YoY growth 2025-2026(%) 17.7%
Key countries China, Japan, South Korea, India, Taiwan, Australia, US, Canada, Mexico, Germany, UK, France, Italy, The Netherlands, Spain, Brazil, Argentina, Chile, Saudi Arabia, UAE, South Africa, Turkey and Egypt
Competitive landscape Leading Companies, Market Positioning of Companies, Competitive Strategies, and Industry Risks

Request Free Sample

Research Analyst Overview

  • The functional trajectory of the Electric Double-layer Capacitor (EDLC) demonstrates a profound industry shift toward decentralized and highly responsive energy management architectures. System engineers are increasingly abandoning traditional chemical cells in favor of electrostatic charge storage solutions that deliver exceptional equivalent series resistance reduction.
  • This transition is highly evident in mission-critical environments where rapid charge discharge cycles dictate overall system reliability. By integrating radial leaded enclosures into heavy-duty motor drives, industrial facilities have recorded a 31% improvement in peak power delivery during severe mechanical load spikes. This enhanced performance allows plant managers to optimize budgeting models by drastically reducing the frequency of component replacements.
  • Furthermore, the adoption of activated carbon electrodes ensures that these energy modules can endure millions of cycles without substantial degradation. As regulatory bodies enforce stricter efficiency mandates, the reliance on non faradaic storage mechanisms becomes a critical compliance strategy. These structural enhancements directly support uninterruptible manufacturing workflows, solidifying the technology as an essential pillar of modern, high-intensity industrial electrification.

What are the Key Data Covered in this Electric Double-Layer Capacitor (Edlc) Market Research and Growth Report?

  • What is the expected growth of the Electric Double-Layer Capacitor (Edlc) Market between 2026 and 2030?

    • USD 1.88 billion, at a CAGR of 20.5%

  • What segmentation does the market report cover?

    • The report is segmented by Product (Flat style EDLC, Button style EDLC, and Radial style EDLC), Application (Automotive, Energy sector, Consumer electronics, and Industrials), Capacity (Below 10 F, 10-100 F, and Above 100 F) and Geography (APAC, North America, Europe, South America, Middle East and Africa)

  • Which regions are analyzed in the report?

    • APAC, North America, Europe, South America and Middle East and Africa

  • What are the key growth drivers and market challenges?

    • Increasing adoption of electric and hybrid vehicles, High initial costs and complex manufacturing processes

  • Who are the major players in the Electric Double-Layer Capacitor (Edlc) Market?

    • CAP XX Ltd., Eaton Corp. Plc, Knowles Corp., KORCHIP Corp., Kyocera Corp., LS MTRON Ltd., Man Yue Technology Holdings Ltd., Murata Manufacturing Co. Ltd., Nichicon Corp., Nippon Chemi Con Corp., Panasonic Holdings Corp., Rubycon Corp., Samwha Capacitor Co. Ltd., Skeleton Technologies GmbH, SYECLV, TAIYO YUDEN Co. Ltd., TDK Corp., VINATech Co. Ltd., Vishay Intertechnology Inc. and YAGEO Corp.

Market Research Insights

  • The Electric Double-layer Capacitor (EDLC) architecture is fundamentally restructuring power conditioning infrastructure across heavy-duty industrial environments. By incorporating hybrid energy storage configurations, utility operators have increased intermittent solar generation capture rates by an impressive 32%. This technological evolution effectively neutralizes transmission instability, allowing sub second synthetic inertia to enhance overall grid resilience by 18% compared to legacy chemical battery systems.
  • Furthermore, modern deployment of these components in telecommunication networks has improved high power frequency regulation, cutting critical system reset errors by nearly 25%. These quantifiable efficiency gains demonstrate how advanced electrostatic solutions directly lower long-term operational costs and streamline rigorous regulatory compliance for decentralized power networks.

We can help! Our analysts can customize this electric double-layer capacitor (edlc) market research report to meet your requirements.

Get in touch

1. Executive Summary

1.1 Market overview

Executive Summary - Chart on Market Overview
Executive Summary - Data Table on Market Overview
Executive Summary - Chart on Global Market Characteristics
Executive Summary - Chart on Market by Geography
Executive Summary - Chart on Market Segmentation by Product
Executive Summary - Chart on Market Segmentation by Application
Executive Summary - Chart on Market Segmentation by Capacity
Executive Summary - Chart on Incremental Growth
Executive Summary - Data Table on Incremental Growth
Executive Summary - Chart on Company Market Positioning

2. Technavio Analysis

2.1 Analysis of price sensitivity, lifecycle, customer purchase basket, adoption rates, and purchase criteria

2.2 Criticality of inputs and Factors of differentiation

Chart on Overview on criticality of inputs and factors of differentiation

2.3 Factors of disruption

Chart on Overview on factors of disruption

2.4 Impact of drivers and challenges

Chart on Impact of drivers and challenges in 2025 and 2030

3. Market Landscape

3.1 Market ecosystem

Chart on Parent Market
Data Table on - Parent Market

3.2 Market characteristics

Chart on Market characteristics analysis

3.3 Value chain analysis

Chart on Value chain analysis

4. Market Sizing

4.1 Market definition

Data Table on Offerings of companies included in the market definition

4.2 Market segment analysis

Market segments

4.3 Market size 2025

4.4 Market outlook: Forecast for 2025-2030

Chart on Global - Market size and forecast 2025-2030 ($ million)
Data Table on Global - Market size and forecast 2025-2030 ($ million)
Chart on Global Market: Year-over-year growth 2025-2030 (%)
Data Table on Global Market: Year-over-year growth 2025-2030 (%)

5. Historic Market Size

5.1 Global Electric Double-Layer Capacitor (EDLC) Market 2020 - 2024

Historic Market Size - Data Table on Global Electric Double-Layer Capacitor (EDLC) Market 2020 - 2024 ($ million)

5.2 Product segment analysis 2020 - 2024

Historic Market Size - Product Segment 2020 - 2024 ($ million)

5.3 Application segment analysis 2020 - 2024

Historic Market Size - Application Segment 2020 - 2024 ($ million)

5.4 Capacity segment analysis 2020 - 2024

Historic Market Size - Capacity Segment 2020 - 2024 ($ million)

5.5 Geography segment analysis 2020 - 2024

Historic Market Size - Geography Segment 2020 - 2024 ($ million)

5.6 Country segment analysis 2020 - 2024

Historic Market Size - Country Segment 2020 - 2024 ($ million)

6. Qualitative Analysis

6.1 Impact of AI on Global Electric Double-Layer Capacitor (EDLC) Market

6.2 Impact of Geopolitical Conflicts on Global Electric Double-Layer Capacitor (EDLC) Market

7. Five Forces Analysis

7.1 Five forces summary

Five forces analysis - Comparison between 2025 and 2030

7.2 Bargaining power of buyers

Bargaining power of buyers - Impact of key factors 2025 and 2030

7.3 Bargaining power of suppliers

Bargaining power of suppliers - Impact of key factors in 2025 and 2030

7.4 Threat of new entrants

Threat of new entrants - Impact of key factors in 2025 and 2030

7.5 Threat of substitutes

Threat of substitutes - Impact of key factors in 2025 and 2030

7.6 Threat of rivalry

Threat of rivalry - Impact of key factors in 2025 and 2030

7.7 Market condition

Chart on Market condition - Five forces 2025 and 2030

8. Market Segmentation by Product

8.1 Market segments

Chart on Product - Market share 2025-2030 (%)
Data Table on Product - Market share 2025-2030 (%)

8.2 Comparison by Product

Chart on Comparison by Product
Data Table on Comparison by Product

8.3 Flat style EDLC - Market size and forecast 2025-2030

Chart on Flat style EDLC - Market size and forecast 2025-2030 ($ million)
Data Table on Flat style EDLC - Market size and forecast 2025-2030 ($ million)
Chart on Flat style EDLC - Year-over-year growth 2025-2030 (%)
Data Table on Flat style EDLC - Year-over-year growth 2025-2030 (%)

8.4 Button style EDLC - Market size and forecast 2025-2030

Chart on Button style EDLC - Market size and forecast 2025-2030 ($ million)
Data Table on Button style EDLC - Market size and forecast 2025-2030 ($ million)
Chart on Button style EDLC - Year-over-year growth 2025-2030 (%)
Data Table on Button style EDLC - Year-over-year growth 2025-2030 (%)

8.5 Radial style EDLC - Market size and forecast 2025-2030

Chart on Radial style EDLC - Market size and forecast 2025-2030 ($ million)
Data Table on Radial style EDLC - Market size and forecast 2025-2030 ($ million)
Chart on Radial style EDLC - Year-over-year growth 2025-2030 (%)
Data Table on Radial style EDLC - Year-over-year growth 2025-2030 (%)

8.6 Market opportunity by Product

Market opportunity by Product ($ million)
Data Table on Market opportunity by Product ($ million)

9. Market Segmentation by Application

9.1 Market segments

Chart on Application - Market share 2025-2030 (%)
Data Table on Application - Market share 2025-2030 (%)

9.2 Comparison by Application

Chart on Comparison by Application
Data Table on Comparison by Application

9.3 Automotive - Market size and forecast 2025-2030

Chart on Automotive - Market size and forecast 2025-2030 ($ million)
Data Table on Automotive - Market size and forecast 2025-2030 ($ million)
Chart on Automotive - Year-over-year growth 2025-2030 (%)
Data Table on Automotive - Year-over-year growth 2025-2030 (%)

9.4 Energy sector - Market size and forecast 2025-2030

Chart on Energy sector - Market size and forecast 2025-2030 ($ million)
Data Table on Energy sector - Market size and forecast 2025-2030 ($ million)
Chart on Energy sector - Year-over-year growth 2025-2030 (%)
Data Table on Energy sector - Year-over-year growth 2025-2030 (%)

9.5 Consumer electronics - Market size and forecast 2025-2030

Chart on Consumer electronics - Market size and forecast 2025-2030 ($ million)
Data Table on Consumer electronics - Market size and forecast 2025-2030 ($ million)
Chart on Consumer electronics - Year-over-year growth 2025-2030 (%)
Data Table on Consumer electronics - Year-over-year growth 2025-2030 (%)

9.6 Industrials - Market size and forecast 2025-2030

Chart on Industrials - Market size and forecast 2025-2030 ($ million)
Data Table on Industrials - Market size and forecast 2025-2030 ($ million)
Chart on Industrials - Year-over-year growth 2025-2030 (%)
Data Table on Industrials - Year-over-year growth 2025-2030 (%)

9.7 Market opportunity by Application

Market opportunity by Application ($ million)
Data Table on Market opportunity by Application ($ million)

10. Market Segmentation by Capacity

10.1 Market segments

Chart on Capacity - Market share 2025-2030 (%)
Data Table on Capacity - Market share 2025-2030 (%)

10.2 Comparison by Capacity

Chart on Comparison by Capacity
Data Table on Comparison by Capacity

10.3 Below 10 F - Market size and forecast 2025-2030

Chart on Below 10 F - Market size and forecast 2025-2030 ($ million)
Data Table on Below 10 F - Market size and forecast 2025-2030 ($ million)
Chart on Below 10 F - Year-over-year growth 2025-2030 (%)
Data Table on Below 10 F - Year-over-year growth 2025-2030 (%)

10.4 10-100 F - Market size and forecast 2025-2030

Chart on 10-100 F - Market size and forecast 2025-2030 ($ million)
Data Table on 10-100 F - Market size and forecast 2025-2030 ($ million)
Chart on 10-100 F - Year-over-year growth 2025-2030 (%)
Data Table on 10-100 F - Year-over-year growth 2025-2030 (%)

10.5 Above 100 F - Market size and forecast 2025-2030

Chart on Above 100 F - Market size and forecast 2025-2030 ($ million)
Data Table on Above 100 F - Market size and forecast 2025-2030 ($ million)
Chart on Above 100 F - Year-over-year growth 2025-2030 (%)
Data Table on Above 100 F - Year-over-year growth 2025-2030 (%)

10.6 Market opportunity by Capacity

Market opportunity by Capacity ($ million)
Data Table on Market opportunity by Capacity ($ million)

11. Customer Landscape

11.1 Customer landscape overview

Analysis of price sensitivity, lifecycle, customer purchase basket, adoption rates, and purchase criteria

12. Geographic Landscape

12.1 Geographic segmentation

Chart on Market share by geography 2025-2030 (%)
Data Table on Market share by geography 2025-2030 (%)

12.2 Geographic comparison

Chart on Geographic comparison
Data Table on Geographic comparison

12.3 APAC - Market size and forecast 2025-2030

Chart on APAC - Market size and forecast 2025-2030 ($ million)
Data Table on APAC - Market size and forecast 2025-2030 ($ million)
Chart on APAC - Year-over-year growth 2025-2030 (%)
Data Table on APAC - Year-over-year growth 2025-2030 (%)
Chart on Regional Comparison - APAC
Data Table on Regional Comparison - APAC

12.3.1 China - Market size and forecast 2025-2030

Chart on China - Market size and forecast 2025-2030 ($ million)
Data Table on China - Market size and forecast 2025-2030 ($ million)
Chart on China - Year-over-year growth 2025-2030 (%)
Data Table on China - Year-over-year growth 2025-2030 (%)

12.3.2 Japan - Market size and forecast 2025-2030

Chart on Japan - Market size and forecast 2025-2030 ($ million)
Data Table on Japan - Market size and forecast 2025-2030 ($ million)
Chart on Japan - Year-over-year growth 2025-2030 (%)
Data Table on Japan - Year-over-year growth 2025-2030 (%)

12.3.3 South Korea - Market size and forecast 2025-2030

Chart on South Korea - Market size and forecast 2025-2030 ($ million)
Data Table on South Korea - Market size and forecast 2025-2030 ($ million)
Chart on South Korea - Year-over-year growth 2025-2030 (%)
Data Table on South Korea - Year-over-year growth 2025-2030 (%)

12.3.4 India - Market size and forecast 2025-2030

Chart on India - Market size and forecast 2025-2030 ($ million)
Data Table on India - Market size and forecast 2025-2030 ($ million)
Chart on India - Year-over-year growth 2025-2030 (%)
Data Table on India - Year-over-year growth 2025-2030 (%)

12.3.5 Taiwan - Market size and forecast 2025-2030

Chart on Taiwan - Market size and forecast 2025-2030 ($ million)
Data Table on Taiwan - Market size and forecast 2025-2030 ($ million)
Chart on Taiwan - Year-over-year growth 2025-2030 (%)
Data Table on Taiwan - Year-over-year growth 2025-2030 (%)

12.3.6 Australia - Market size and forecast 2025-2030

Chart on Australia - Market size and forecast 2025-2030 ($ million)
Data Table on Australia - Market size and forecast 2025-2030 ($ million)
Chart on Australia - Year-over-year growth 2025-2030 (%)
Data Table on Australia - Year-over-year growth 2025-2030 (%)

12.4 North America - Market size and forecast 2025-2030

Chart on North America - Market size and forecast 2025-2030 ($ million)
Data Table on North America - Market size and forecast 2025-2030 ($ million)
Chart on North America - Year-over-year growth 2025-2030 (%)
Data Table on North America - Year-over-year growth 2025-2030 (%)
Chart on Regional Comparison - North America
Data Table on Regional Comparison - North America

12.4.1 US - Market size and forecast 2025-2030

Chart on US - Market size and forecast 2025-2030 ($ million)
Data Table on US - Market size and forecast 2025-2030 ($ million)
Chart on US - Year-over-year growth 2025-2030 (%)
Data Table on US - Year-over-year growth 2025-2030 (%)

12.4.2 Canada - Market size and forecast 2025-2030

Chart on Canada - Market size and forecast 2025-2030 ($ million)
Data Table on Canada - Market size and forecast 2025-2030 ($ million)
Chart on Canada - Year-over-year growth 2025-2030 (%)
Data Table on Canada - Year-over-year growth 2025-2030 (%)

12.4.3 Mexico - Market size and forecast 2025-2030

Chart on Mexico - Market size and forecast 2025-2030 ($ million)
Data Table on Mexico - Market size and forecast 2025-2030 ($ million)
Chart on Mexico - Year-over-year growth 2025-2030 (%)
Data Table on Mexico - Year-over-year growth 2025-2030 (%)

12.5 Europe - Market size and forecast 2025-2030

Chart on Europe - Market size and forecast 2025-2030 ($ million)
Data Table on Europe - Market size and forecast 2025-2030 ($ million)
Chart on Europe - Year-over-year growth 2025-2030 (%)
Data Table on Europe - Year-over-year growth 2025-2030 (%)
Chart on Regional Comparison - Europe
Data Table on Regional Comparison - Europe

12.5.1 Germany - Market size and forecast 2025-2030

Chart on Germany - Market size and forecast 2025-2030 ($ million)
Data Table on Germany - Market size and forecast 2025-2030 ($ million)
Chart on Germany - Year-over-year growth 2025-2030 (%)
Data Table on Germany - Year-over-year growth 2025-2030 (%)

12.5.2 UK - Market size and forecast 2025-2030

Chart on UK - Market size and forecast 2025-2030 ($ million)
Data Table on UK - Market size and forecast 2025-2030 ($ million)
Chart on UK - Year-over-year growth 2025-2030 (%)
Data Table on UK - Year-over-year growth 2025-2030 (%)

12.5.3 France - Market size and forecast 2025-2030

Chart on France - Market size and forecast 2025-2030 ($ million)
Data Table on France - Market size and forecast 2025-2030 ($ million)
Chart on France - Year-over-year growth 2025-2030 (%)
Data Table on France - Year-over-year growth 2025-2030 (%)

12.5.4 Italy - Market size and forecast 2025-2030

Chart on Italy - Market size and forecast 2025-2030 ($ million)
Data Table on Italy - Market size and forecast 2025-2030 ($ million)
Chart on Italy - Year-over-year growth 2025-2030 (%)
Data Table on Italy - Year-over-year growth 2025-2030 (%)

12.5.5 The Netherlands - Market size and forecast 2025-2030

Chart on The Netherlands - Market size and forecast 2025-2030 ($ million)
Data Table on The Netherlands - Market size and forecast 2025-2030 ($ million)
Chart on The Netherlands - Year-over-year growth 2025-2030 (%)
Data Table on The Netherlands - Year-over-year growth 2025-2030 (%)

12.5.6 Spain - Market size and forecast 2025-2030

Chart on Spain - Market size and forecast 2025-2030 ($ million)
Data Table on Spain - Market size and forecast 2025-2030 ($ million)
Chart on Spain - Year-over-year growth 2025-2030 (%)
Data Table on Spain - Year-over-year growth 2025-2030 (%)

12.6 South America - Market size and forecast 2025-2030

Chart on South America - Market size and forecast 2025-2030 ($ million)
Data Table on South America - Market size and forecast 2025-2030 ($ million)
Chart on South America - Year-over-year growth 2025-2030 (%)
Data Table on South America - Year-over-year growth 2025-2030 (%)
Chart on Regional Comparison - South America
Data Table on Regional Comparison - South America

12.6.1 Brazil - Market size and forecast 2025-2030

Chart on Brazil - Market size and forecast 2025-2030 ($ million)
Data Table on Brazil - Market size and forecast 2025-2030 ($ million)
Chart on Brazil - Year-over-year growth 2025-2030 (%)
Data Table on Brazil - Year-over-year growth 2025-2030 (%)

12.6.2 Argentina - Market size and forecast 2025-2030

Chart on Argentina - Market size and forecast 2025-2030 ($ million)
Data Table on Argentina - Market size and forecast 2025-2030 ($ million)
Chart on Argentina - Year-over-year growth 2025-2030 (%)
Data Table on Argentina - Year-over-year growth 2025-2030 (%)

12.6.3 Chile - Market size and forecast 2025-2030

Chart on Chile - Market size and forecast 2025-2030 ($ million)
Data Table on Chile - Market size and forecast 2025-2030 ($ million)
Chart on Chile - Year-over-year growth 2025-2030 (%)
Data Table on Chile - Year-over-year growth 2025-2030 (%)

12.7 Middle East and Africa - Market size and forecast 2025-2030

Chart on Middle East and Africa - Market size and forecast 2025-2030 ($ million)
Data Table on Middle East and Africa - Market size and forecast 2025-2030 ($ million)
Chart on Middle East and Africa - Year-over-year growth 2025-2030 (%)
Data Table on Middle East and Africa - Year-over-year growth 2025-2030 (%)
Chart on Regional Comparison - Middle East and Africa
Data Table on Regional Comparison - Middle East and Africa

12.7.1 Saudi Arabia - Market size and forecast 2025-2030

Chart on Saudi Arabia - Market size and forecast 2025-2030 ($ million)
Data Table on Saudi Arabia - Market size and forecast 2025-2030 ($ million)
Chart on Saudi Arabia - Year-over-year growth 2025-2030 (%)
Data Table on Saudi Arabia - Year-over-year growth 2025-2030 (%)

12.7.2 UAE - Market size and forecast 2025-2030

Chart on UAE - Market size and forecast 2025-2030 ($ million)
Data Table on UAE - Market size and forecast 2025-2030 ($ million)
Chart on UAE - Year-over-year growth 2025-2030 (%)
Data Table on UAE - Year-over-year growth 2025-2030 (%)

12.7.3 South Africa - Market size and forecast 2025-2030

Chart on South Africa - Market size and forecast 2025-2030 ($ million)
Data Table on South Africa - Market size and forecast 2025-2030 ($ million)
Chart on South Africa - Year-over-year growth 2025-2030 (%)
Data Table on South Africa - Year-over-year growth 2025-2030 (%)

12.7.4 Turkey - Market size and forecast 2025-2030

Chart on Turkey - Market size and forecast 2025-2030 ($ million)
Data Table on Turkey - Market size and forecast 2025-2030 ($ million)
Chart on Turkey - Year-over-year growth 2025-2030 (%)
Data Table on Turkey - Year-over-year growth 2025-2030 (%)

12.7.5 Egypt - Market size and forecast 2025-2030

Chart on Egypt - Market size and forecast 2025-2030 ($ million)
Data Table on Egypt - Market size and forecast 2025-2030 ($ million)
Chart on Egypt - Year-over-year growth 2025-2030 (%)
Data Table on Egypt - Year-over-year growth 2025-2030 (%)

12.8 Market opportunity by geography

Market opportunity by geography ($ million)
Data Tables on Market opportunity by geography ($ million)

13. Drivers, Challenges, and Opportunity

13.1 Market drivers

Increasing adoption of electric and hybrid vehicles
Growing investments in renewable energy and grid modernization
Advancements in EDLC technology and manufacturing processes

13.2 Market challenges

High initial costs and complex manufacturing processes
Intense competition from alternative energy storage technologies
Technical limitations and challenges in system integration

13.3 Impact of drivers and challenges

Impact of drivers and challenges in 2025 and 2030

13.4 Market opportunities

Miniaturization and integration into consumer electronics
Development of hybrid supercapacitors
Increasing focus on graphene-based EDLCs

14. Competitive Landscape

14.1 Overview

14.2

Overview on criticality of inputs and factors of differentiation

14.3 Landscape disruption

Overview on factors of disruption

14.4 Industry risks

Impact of key risks on business

15. Competitive Analysis

15.1 Companies profiled

Companies covered

15.2 Company ranking index

15.3 Market positioning of companies

Matrix on companies position and classification

15.4 CAP XX Ltd.

CAP XX Ltd. - Overview
CAP XX Ltd. - Product / Service
CAP XX Ltd. - Key offerings
SWOT

15.5 Eaton Corp. Plc

Eaton Corp. Plc - Overview
Eaton Corp. Plc - Business segments
Eaton Corp. Plc - Key news
Eaton Corp. Plc - Key offerings
Eaton Corp. Plc - Segment focus
SWOT

15.6 Knowles Corp.

Knowles Corp. - Overview
Knowles Corp. - Business segments
Knowles Corp. - Key offerings
Knowles Corp. - Segment focus
SWOT

15.7 Kyocera Corp.

Kyocera Corp. - Overview
Kyocera Corp. - Business segments
Kyocera Corp. - Key offerings
Kyocera Corp. - Segment focus
SWOT

15.8 LS MTRON Ltd.

LS MTRON Ltd. - Overview
LS MTRON Ltd. - Product / Service
LS MTRON Ltd. - Key offerings
SWOT

15.9 Murata Manufacturing Co. Ltd.

Murata Manufacturing Co. Ltd. - Overview
Murata Manufacturing Co. Ltd. - Business segments
Murata Manufacturing Co. Ltd. - Key offerings
Murata Manufacturing Co. Ltd. - Segment focus
SWOT

15.10 Nichicon Corp.

Nichicon Corp. - Overview
Nichicon Corp. - Product / Service
Nichicon Corp. - Key offerings
SWOT

15.11 Nippon Chemi Con Corp.

Nippon Chemi Con Corp. - Overview
Nippon Chemi Con Corp. - Product / Service
Nippon Chemi Con Corp. - Key offerings
SWOT

15.12 Panasonic Holdings Corp.

Panasonic Holdings Corp. - Overview
Panasonic Holdings Corp. - Business segments
Panasonic Holdings Corp. - Key news
Panasonic Holdings Corp. - Key offerings
Panasonic Holdings Corp. - Segment focus
SWOT

15.13 Rubycon Corp.

Rubycon Corp. - Overview
Rubycon Corp. - Product / Service
Rubycon Corp. - Key offerings
SWOT

15.14 Samwha Capacitor Co. Ltd.

Samwha Capacitor Co. Ltd. - Overview
Samwha Capacitor Co. Ltd. - Product / Service
Samwha Capacitor Co. Ltd. - Key offerings
SWOT

15.15 TAIYO YUDEN Co. Ltd.

TAIYO YUDEN Co. Ltd. - Overview
TAIYO YUDEN Co. Ltd. - Product / Service
TAIYO YUDEN Co. Ltd. - Key offerings
SWOT

15.16 TDK Corp.

TDK Corp. - Overview
TDK Corp. - Business segments
TDK Corp. - Key offerings
TDK Corp. - Segment focus
SWOT

15.17 Vishay Intertechnology Inc.

Vishay Intertechnology Inc. - Overview
Vishay Intertechnology Inc. - Business segments
Vishay Intertechnology Inc. - Key news
Vishay Intertechnology Inc. - Key offerings
Vishay Intertechnology Inc. - Segment focus
SWOT

15.18 YAGEO Corp.

YAGEO Corp. - Overview
YAGEO Corp. - Product / Service
YAGEO Corp. - Key offerings
SWOT

16. Appendix

16.1 Scope of the report

Market definition
Objectives
Notes and caveats

16.2 Inclusions and exclusions checklist

Inclusions checklist
Exclusions checklist

16.3 Currency conversion rates for US$

16.4 Research methodology

16.5 Data procurement

Information sources

16.6 Data validation

16.7 Validation techniques employed for market sizing

16.8 Data synthesis

16.9 360 degree market analysis

16.10 List of abbreviations

Research Methodology

Technavio presents a detailed picture of the market by way of study, synthesis, and summation of data from multiple sources. The analysts have presented the various facets of the market with a particular focus on identifying the key industry influencers. The data thus presented is comprehensive, reliable, and the result of extensive research, both primary and secondary.

INFORMATION SOURCES

Primary sources

  • Manufacturers and suppliers
  • Channel partners
  • Industry experts
  • Strategic decision makers

Secondary sources

  • Industry journals and periodicals
  • Government data
  • Financial reports of key industry players
  • Historical data
  • Press releases

DATA ANALYSIS

Data Synthesis

  • Collation of data
  • Estimation of key figures
  • Analysis of derived insights

Data Validation

  • Triangulation with data models
  • Reference against proprietary databases
  • Corroboration with industry experts

REPORT WRITING

Qualitative

  • Market drivers
  • Market challenges
  • Market trends
  • Five forces analysis

Quantitative

  • Market size and forecast
  • Market segmentation
  • Geographical insights
  • Competitive landscape

Interested in this report?

Get your sample now to see our research methodology and insights!

Download Now

Frequently Asked Questions

Electric Double-Layer Capacitor (Edlc) market growth will increase by USD 1883.6 million during 2026-2030.

The Electric Double-Layer Capacitor (Edlc) market is expected to grow at a CAGR of 20.5% during 2026-2030.

Electric Double-Layer Capacitor (Edlc) market is segmented by Product (Flat style EDLC, Button style EDLC, Radial style EDLC) Application (Automotive, Energy sector, Consumer electronics, Industrials) Capacity (Below 10 F, 10-100 F, Above 100 F)

CAP XX Ltd., Eaton Corp. Plc, Knowles Corp., KORCHIP Corp., Kyocera Corp., LS MTRON Ltd., Man Yue Technology Holdings Ltd., Murata Manufacturing Co. Ltd., Nichicon Corp., Nippon Chemi Con Corp., Panasonic Holdings Corp., Rubycon Corp., Samwha Capacitor Co. Ltd., Skeleton Technologies GmbH, SYECLV, TAIYO YUDEN Co. Ltd., TDK Corp., VINATech Co. Ltd., Vishay Intertechnology Inc., YAGEO Corp. are a few of the key vendors in the Electric Double-Layer Capacitor (Edlc) market.

APAC will register the highest growth rate of 33.9% among the other regions. Therefore, the Electric Double-Layer Capacitor (Edlc) market in APAC is expected to garner significant business opportunities for the vendors during the forecast period.

China, Japan, South Korea, India, Taiwan, Australia, US, Canada, Mexico, Germany, UK, France, Italy, The Netherlands, Spain, Brazil, Argentina, Chile, Saudi Arabia, UAE, South Africa, Turkey, Egypt

  • Increasing adoption of electric and hybrid vehicles is the driving factor this market.

The Electric Double-Layer Capacitor (Edlc) market vendors should focus on grabbing business opportunities from the Product segment as it accounted for the largest market share in the base year.
RIA - Research AI Assistant
Ask RIA
