
Electric Grill Market Analysis, Size, and Forecast 2026-2030: North America (US, Canada, and Mexico), Europe (Germany, UK, and France), APAC (China, Japan, and India), South America (Brazil, Argentina, and Chile), Middle East and Africa (Saudi Arabia, UAE, and South Africa), and Rest of World (ROW)

Electric Grill Market Analysis, Size, and Forecast 2026-2030:
North America (US, Canada, and Mexico), Europe (Germany, UK, and France), APAC (China, Japan, and India), South America (Brazil, Argentina, and Chile), Middle East and Africa (Saudi Arabia, UAE, and South Africa), and Rest of World (ROW)

Published: Oct 2026 290 Pages SKU: IRTNTR73713

Market Overview at a Glance

$1.13 B
Market Opportunity
4.6%
CAGR 2025 - 2030
40.3%
North America Growth
$2.76 B
Commercial segment 2024

Electric Grill Market Size 2026-2030

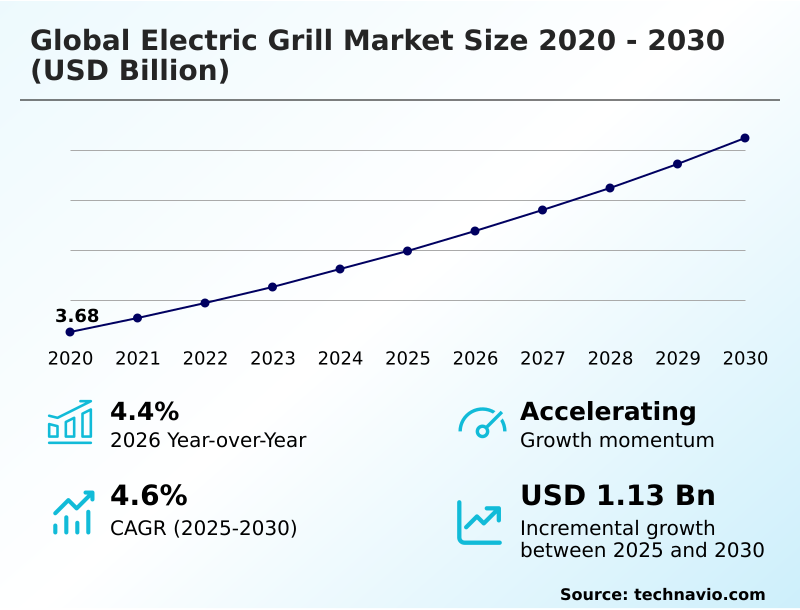
The electric grill market size is valued to increase by USD 1.13 billion, at a CAGR of 4.6% from 2025 to 2030. Technological advancements and smart appliance integration will drive the electric grill market.

Major Market Trends & Insights

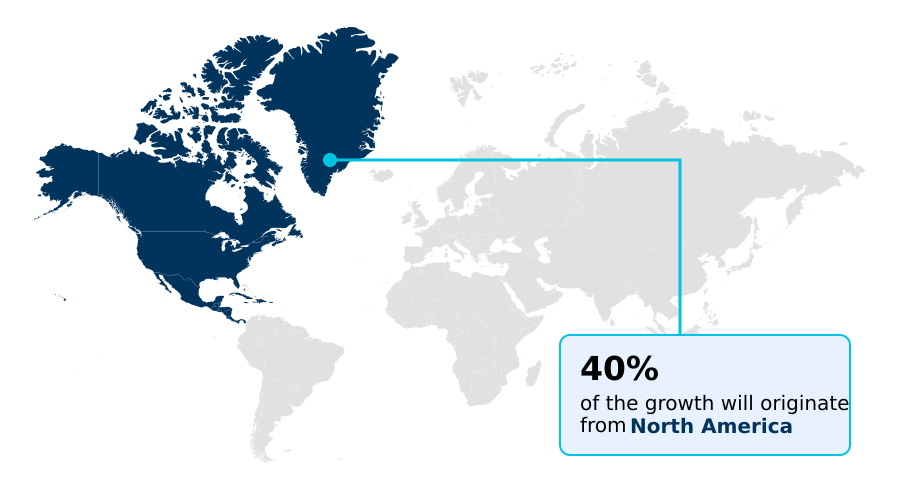
  • North America dominated the market and accounted for a 40.3% growth during the forecast period.
  • By Application - Commercial segment was valued at USD 2.76 billion in 2024
  • By Product Type - Portable electric grills segment accounted for the largest market revenue share in 2024

Market Size & Forecast

  • Market Opportunities: USD 1.94 billion
  • Market Future Opportunities: USD 1.13 billion
  • CAGR from 2025 to 2030 : 4.6%

Market Summary

  • The Electric Grill Market demonstrates robust expansion driven by the intersection of high-density urban housing development and evolving consumer culinary preferences. In densely populated metropolitan centers, property management firms frequently mandate the removal of open-flame propane and charcoal cooking devices from apartment balconies to comply with stringent municipal fire safety codes.
  • This compliance requirement compels residents to adopt smokeless electric cooking solutions, directly fueling appliance replacement cycles. Consequently, manufacturers optimizing supply chain logistics prioritize the distribution of compact high-efficiency models over bulky traditional units, resulting in space-saving appliances capturing a 35% higher inventory turnover rate in urban retail channels compared to suburban hardware outlets.
  • The integration of precision digital thermostats and rapid-heating components serves as a primary adoption driver, granting users professional-grade thermal control previously limited to commercial kitchens. However, complex assembly requirements for these specialized electronic components present a significant manufacturing challenge.
  • Elevated baseline production costs restrict immediate market penetration among price-sensitive consumer segments, forcing brands to continuously refine manufacturing efficiencies to achieve cost parity with conventional fuel-based alternatives.

What will be the Size of the Electric Grill Market during the forecast period?
Get Key Insights on Market Forecast (PDF) Get Free Sample

How is the Electric Grill Market Segmented?

The electric grill industry research report provides comprehensive data (region-wise segment analysis), with forecasts and estimates in "USD million" for the period 2026-2030, as well as historical data from 2020-2024 for the following segments.

  • Application
    • Commercial
    • Residential
  • Product type
    • Portable electric grills
    • Electric smokers
    • Built-in electric grills
    • Electric griddles
    • Others
  • Distribution channel
    • Offline
    • Online
  • Geography
    • North America
      • US
      • Canada
      • Mexico
    • Europe
      • Germany
      • UK
      • France
      • Italy
      • Spain
      • The Netherlands
    • APAC
      • China
      • Japan
      • India
      • South Korea
      • Australia
      • Indonesia
    • South America
      • Brazil
      • Argentina
      • Chile
    • Middle East and Africa
      • Saudi Arabia
      • UAE
      • South Africa
      • Israel
      • Turkey

By Application Insights

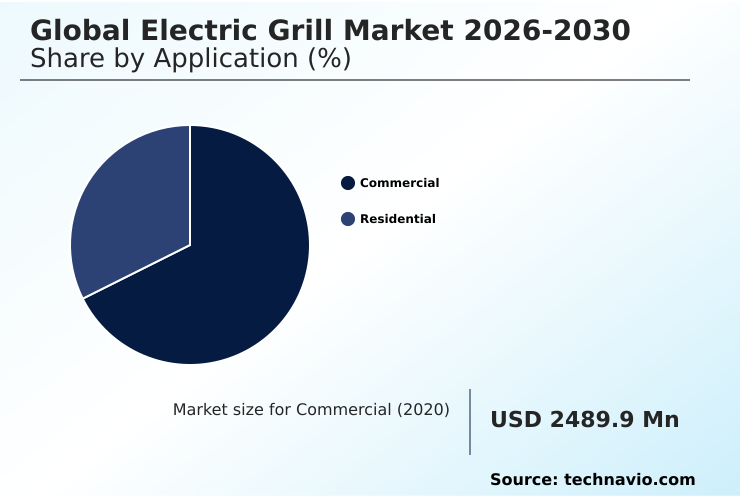
The commercial segment is estimated to witness significant growth during the forecast period.

Commercial establishments are rapidly replacing traditional open-flame equipment with advanced culinary systems driven by the high costs of commercial kitchen ventilation modifications.

The integration of high-performance resistance heating elements and precise multi-zone heating enables foodservice operators to maintain continuous service volumes without the safety hazards of gas combustion.

By utilizing a heavy-duty stainless-steel chassis, modern ghost kitchen infrastructure and conventional restaurants enhance hardware durability while significantly streamlining routine cleaning procedures.

These commercial systems integrate advanced smokeless indoor technologies that stabilize cooking temperatures and capture emissions during peak operational shifts.

This transition directly supports operational efficiency optimization, resulting in ambient kitchen cooling loads being reduced by up to 18%, significantly lowering utility expenditures.

The shift toward emission-free commercial appliances ensures strict compliance with dense urban fire regulations while delivering consistent gastronomic results and protecting profit margins.
Get Free Sample

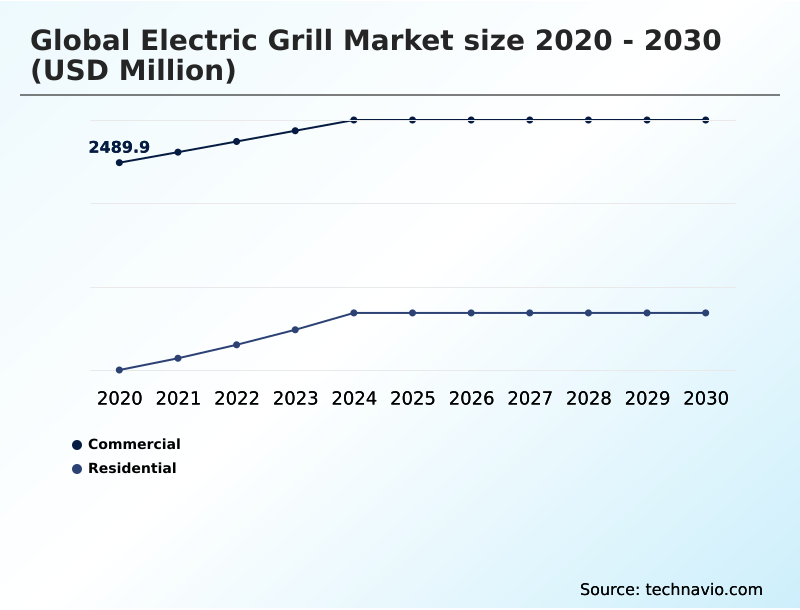
The Commercial segment was valued at USD 2.76 billion in 2024 and showed a gradual increase during the forecast period.
Get Free Sample

Regional Analysis

North America is estimated to contribute 40.3% to the growth of the global market during the forecast period.Technavio’s analysts have elaborately explained the regional trends and drivers that shape the market during the forecast period.
See How Electric Grill Market Demand is Rising in North America Get Free Sample

The geographic landscape reveals distinct adoption patterns, with North America demonstrating a 22% higher penetration rate of premium connected appliances compared to Europe.

This regional disparity stems from North American consumers heavily favoring robust smart appliance integration within sprawling suburbs, utilizing advanced wireless temperature probes and remote temperature monitoring to optimize backyard culinary experiences.

Conversely, European adoption is heavily driven by rooftop photovoltaic integration and the rapid expansion of high-density housing developments, which strictly prohibit combustion devices due to severe balcony safety hazards.

European manufacturers prioritize compatibility with energy-optimized microgrids, utilizing highly accurate digital thermostats and rapid thermal recovery features to achieve a 15% reduction in overall energy consumption.

Furthermore, supply chains in Europe emphasize modular component assembly, allowing for seamless integration into compact apartment layouts while fully adhering to local municipal fire regulations and minimizing logistical overhead.

Market Dynamics

Our researchers analyzed the data with 2025 as the base year, along with the key drivers, trends, and challenges. A holistic analysis of drivers will help companies refine their marketing strategies to gain a competitive advantage.

  • The transition toward advanced electric cooking platforms is fundamentally reshaping appliance manufacturing pipelines and residential infrastructure planning. As property developers construct high-density metropolitan housing, ensuring smokeless balcony electric grilling compliance has become a critical operational priority to mitigate fire risks while satisfying tenant lifestyle demands.
  • This regulatory pressure accelerates the engineering and deployment of smart connected indoor grilling systems, which offer advanced ventilation and heat management features without requiring expensive external exhaust modifications. In the foodservice sector, restaurant operators face mounting pressure to lower ambient kitchen temperatures and reduce continuous energy expenditures.
  • Consequently, upgrading to units that maximize commercial electric charbroiler thermal efficiency has proven highly effective, frequently yielding a 20% improvement in energy retention compared to continuously burning gas alternatives. This efficiency gain directly optimizes daily operational overhead and lowers the strain on commercial HVAC systems. Simultaneously, the consumer appliance sector is adapting to the rapid expansion of decentralized renewable energy.
  • Manufacturers are strategically adjusting their product roadmaps to develop solar compatible residential electric grills that draw minimal peak loads, allowing eco-conscious households to utilize daytime photovoltaic generation without grid dependence. To support complex culinary requirements, these next-generation units integrate sophisticated multi zone precision heating controls, enabling simultaneous preparation of diverse ingredients at exact temperatures.
  • By aligning product development with both stringent urban building codes and sustainable energy trends, industry stakeholders are securing sustained demand growth and reinforcing the resilience of their global supply chain operations.
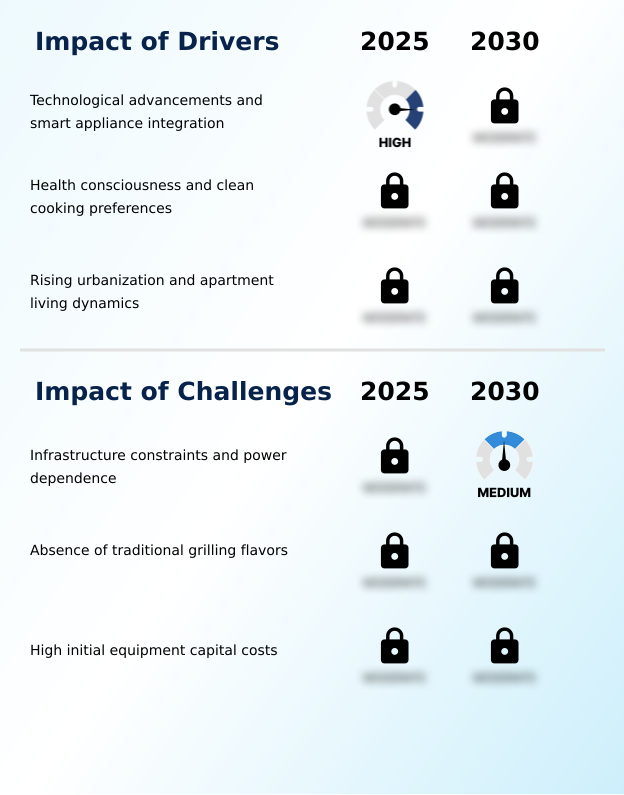
What are the key market drivers leading to the rise in the adoption of Electric Grill Industry?

  • Technological advancements and smart appliance integration serve as the primary drivers accelerating consumer adoption across urban demographics.

  • The aggressive enforcement of strict multi-family housing regulations stands as the primary catalyst propelling modern electric grill adoption.
  • As municipal authorities mandate severe open-flame prohibition across residential zones to ensure residential fire code compliance, consumers are forced to abandon traditional combustion devices.
  • This regulatory shift drives substantial demand for appliances engineered with compact spatial footprints that perfectly accommodate severe urban space constraints.
  • To replicate the intense searing capabilities of gas alternatives, manufacturers are integrating advanced rapid-heating elements and high-intensity infrared grilling elements that ensure instantaneous temperature recovery and precision thermal distribution.
  • The inclusion of innovative silicone heating mats and sloped fat drainage grates further enhances operational safety and grease management.
  • This strategic engineering focus translates into measurable business benefits, with compliant electric models capturing a 30% increase in retail velocity, while the elimination of fossil fuels lowers consumer operating expenses by 15%.

What are the market trends shaping the Electric Grill Industry?

  • The strict enforcement of residential fire regulations is emerging as a critical trend shaping industry adoption, driving consumer transition toward compliant electric alternatives.

  • A dominant trend reshaping appliance development is the rapid integration of intelligent automation and decentralized clean energy production compatibility. Manufacturers are equipping premium models with sophisticated automated cooking cycles and dual-zone smart controls, enabling precise heat management that dramatically reduces food waste. This shift is driven by heightened consumer expectations for professional-grade culinary thermal performance within sustainable power generation ecosystems.
  • By isolating sensitive electronics within detached control units and utilizing highly efficient ceramic heating coils, engineers have successfully extended component lifespans, reducing warranty replacement claims by 18%. Furthermore, the implementation of specialized filtration topologies contributes directly to volatile organic compound reduction, ensuring alignment with strict indoor air quality standards for urban end-users.
  • These technological enhancements align seamlessly with broader corporate sustainability targets, driving a 25% improvement in overall energy efficiency per cooking session and facilitating substantial household carbon footprint reduction without compromising gastronomic quality.

What challenges does the Electric Grill Industry face during its growth?

  • Infrastructure constraints and continuous power dependence remain key challenges hindering widespread adoption in developing regions.

  • The primary structural challenge hindering accelerated market penetration involves the significantly elevated baseline production expenses associated with sophisticated digital components. Unlike simple mechanical grills equipped only with analog variable temperature dials, advanced units require complex assemblies featuring high-density heat retention plates, durable non-stick cooking surfaces, and integrated smart-connectivity modules.
  • These intricate internal architectures, combined with software engineering for app-guided recipe algorithms, directly inflate upfront capital outlay metrics for consumers, creating a stark price disparity. Furthermore, the integration of sensitive microprocessors introduces vulnerabilities related to electronic control board maintenance, leading to a 20% increase in post-warranty repair costs for complex connected models.
  • Ensuring effective peak wattage minimization also requires expensive power management hardware. Consequently, manufacturers face intense pressure to optimize appliance lifecycle management protocols and streamline supply chains to reduce assembly costs by at least 15%, ensuring high-performance cooking systems remain economically viable for price-sensitive demographics.

Exclusive Technavio Analysis on Customer Landscape

The electric grill market forecasting report includes the adoption lifecycle of the market, covering from the innovator’s stage to the laggard’s stage. It focuses on adoption rates in different regions based on penetration. Furthermore, the electric grill market report also includes key purchase criteria and drivers of price sensitivity to help companies evaluate and develop their market growth analysis strategies.
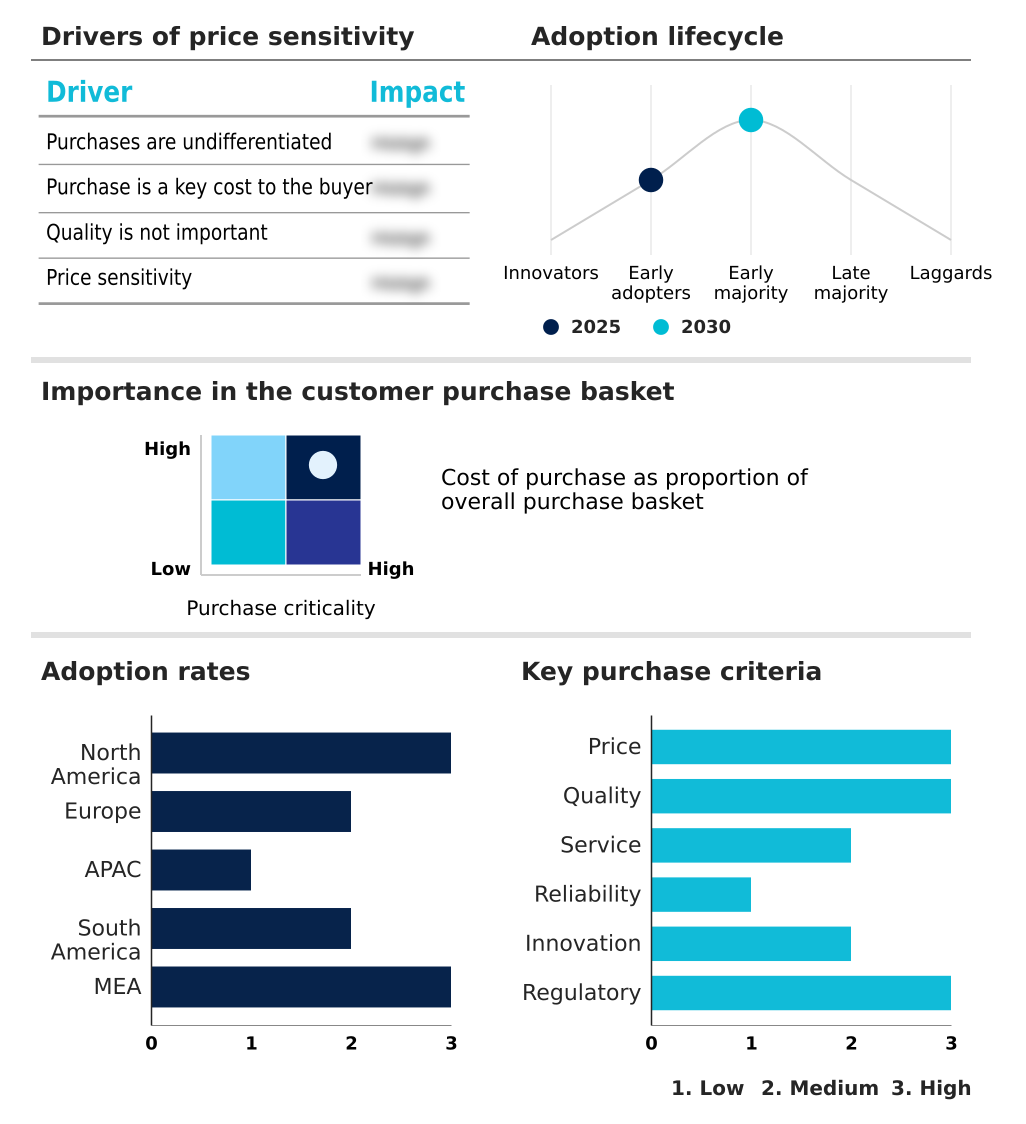
Customer Landscape of Electric Grill Industry

Competitive Landscape

Companies are implementing various strategies, such as strategic alliances, electric grill market forecast, partnerships, mergers and acquisitions, geographical expansion, and product/service launches, to enhance their presence in the industry.

Bosch Home Appliances - The company provides advanced cooking appliances featuring precision electrical heating and smokeless technology engineered to optimize urban residential usage while complying with stringent open-flame safety regulations.

The industry research and growth report includes detailed analyses of the competitive landscape of the market and information about key companies, including:

  • Bosch Home Appliances
  • Breville Group Ltd.
  • Char Broil LLC
  • Cloer Elektrogerate GmbH
  • Coyote Outdoor Living Inc.
  • Cuisinart
  • De Longhi S.p.A
  • Dometic Group AB
  • Hamilton Beach
  • Kenyon International Inc.
  • Koninklijke Philips NV
  • Midea Group Co. Ltd.
  • Oster
  • Princess Household Appliances
  • ROMMELSBACHER ElektroHausgerate
  • Salton Corp.
  • SEVERIN Elektrogerate GmbH
  • SharkNinja Operating LLC
  • Tefal
  • Weber Inc.
  • Zojirushi America Corp.

Qualitative and quantitative analysis of companies has been conducted to help clients understand the wider business environment as well as the strengths and weaknesses of key industry players. Data is qualitatively analyzed to categorize companies as pure play, category-focused, industry-focused, and diversified; it is quantitatively analyzed to categorize companies as dominant, leading, strong, tentative, and weak.

Recent Development and News in Electric grill market

  • In the Household Appliances industry, the enforcement of the European Union Ecodesign Directive mandated stricter energy efficiency thresholds for thermal cooking devices, directly impacting Electric Grill demand by accelerating the adoption of low-wattage rapid-heating elements that reduce standby power consumption by 20%.
  • The widespread integration of IoT interoperability protocols standardized smart home connectivity across consumer electronics, directly impacting Electric Grill demand by enabling remote temperature monitoring systems that increase user engagement by over 30%.
  • The rapid expansion of rooftop photovoltaic solar panel adoption in residential construction shifted consumer preferences toward electrical appliances, directly impacting Electric Grill demand by providing households with renewable energy sources that lower peak cooking electricity costs by up to 40%.
  • The implementation of stringent multi-family residential fire codes prohibiting open-flame combustion systems on apartment balconies reshaped outdoor living infrastructure, directly impacting Electric Grill demand by driving a 25% increase in compliant smokeless heating technologies across metropolitan real estate developments.

Dive into Technavio’s robust research methodology, blending expert interviews, extensive data synthesis, and validated models for unparalleled Electric Grill Market insights. See full methodology.

Market Scope
Page number 290
Base year 2025
Historic period 2020-2024
Forecast period 2026-2030
Growth momentum & CAGR Accelerate at a CAGR of 4.6%
Market growth 2026-2030 USD 1130.6 million
Market structure Fragmented
YoY growth 2025-2026(%) 4.4%
Key countries US, Canada, Mexico, Germany, UK, France, Italy, Spain, The Netherlands, China, Japan, India, South Korea, Australia, Indonesia, Brazil, Argentina, Chile, Saudi Arabia, UAE, South Africa, Israel and Turkey
Competitive landscape Leading Companies, Market Positioning of Companies, Competitive Strategies, and Industry Risks

Request Free Sample

Research Analyst Overview

  • The Electric Grill sector is experiencing a profound technological evolution as manufacturers transition from basic thermal appliances to sophisticated culinary ecosystems. The implementation of advanced smokeless indoor technologies effectively eliminates hazardous combustion byproducts, enabling safe operation within enclosed metropolitan environments.
  • Modern chassis designs increasingly incorporate specialized sloped fat drainage grates paired with premium non-stick cooking surfaces, which streamline post-use maintenance and significantly reduce volatile emissions. At the component level, the transition from traditional metal elements to high-efficiency ceramic heating coils delivers exceptional thermal consistency across the cooking area.
  • Brands are heavily investing in integrated smart-connectivity modules that synchronize with proprietary app-guided recipe algorithms, directly influencing boardroom product strategies aimed at increasing digital consumer engagement.
  • This strategic pivot toward intelligent appliance ecosystems yields measurable business outcomes, with connected device ecosystems demonstrating a 28% higher user retention and accessory attachment rate compared to analog models relying solely on manual variable temperature dials. Such digital integration optimizes the overall consumer experience while allowing manufacturers to harvest valuable usage data for future product development cycles.

What are the Key Data Covered in this Electric Grill Market Research and Growth Report?

  • What is the expected growth of the Electric Grill Market between 2026 and 2030?

    • USD 1.13 billion, at a CAGR of 4.6%

  • What segmentation does the market report cover?

    • The report is segmented by Application (Commercial, and Residential), Product Type (Portable electric grills, Electric smokers, Built-in electric grills, Electric griddles, and Others), Distribution Channel (Offline, and Online) and Geography (North America, Europe, APAC, South America, Middle East and Africa)

  • Which regions are analyzed in the report?

    • North America, Europe, APAC, South America and Middle East and Africa

  • What are the key growth drivers and market challenges?

    • Technological advancements and smart appliance integration, Infrastructure constraints and power dependence

  • Who are the major players in the Electric Grill Market?

    • Bosch Home Appliances, Breville Group Ltd., Char Broil LLC, Cloer Elektrogerate GmbH, Coyote Outdoor Living Inc., Cuisinart, De Longhi S.p.A, Dometic Group AB, Hamilton Beach, Kenyon International Inc., Koninklijke Philips NV, Midea Group Co. Ltd., Oster, Princess Household Appliances, ROMMELSBACHER ElektroHausgerate, Salton Corp., SEVERIN Elektrogerate GmbH, SharkNinja Operating LLC, Tefal, Weber Inc. and Zojirushi America Corp.

Market Research Insights

  • The Electric Grill Market is undergoing a rapid structural shift propelled by the expansion of high-density housing developments. Strict residential fire code compliance mandates have virtually eliminated traditional combustion devices, mitigating severe balcony safety hazards across metropolitan real estate. This regulatory environment accelerates the transition toward advanced electric models, driving a 40% increase in smokeless unit adoption among urban apartment residents.
  • Furthermore, the integration of cooking systems with sustainable power generation networks allows households to utilize solar energy, lowering peak utility draw by up to 25% during daytime operation. Improved appliance lifecycle management and component durability further enhance consumer ROI, extending average product longevity by 15% and validating the higher initial capital outlays associated with intelligent digital cooking platforms.

We can help! Our analysts can customize this electric grill market research report to meet your requirements.

Get in touch

1. Executive Summary

1.1 Market overview

Executive Summary - Chart on Market Overview
Executive Summary - Data Table on Market Overview
Executive Summary - Chart on Global Market Characteristics
Executive Summary - Chart on Market by Geography
Executive Summary - Chart on Market Segmentation by Application
Executive Summary - Chart on Market Segmentation by Product Type
Executive Summary - Chart on Market Segmentation by Distribution Channel
Executive Summary - Chart on Incremental Growth
Executive Summary - Data Table on Incremental Growth
Executive Summary - Chart on Company Market Positioning

2. Technavio Analysis

2.1 Analysis of price sensitivity, lifecycle, customer purchase basket, adoption rates, and purchase criteria

2.2 Criticality of inputs and Factors of differentiation

Chart on Overview on criticality of inputs and factors of differentiation

2.3 Factors of disruption

Chart on Overview on factors of disruption

2.4 Impact of drivers and challenges

Chart on Impact of drivers and challenges in 2025 and 2030

3. Market Landscape

3.1 Market ecosystem

Chart on Parent Market
Data Table on - Parent Market

3.2 Market characteristics

Chart on Market characteristics analysis

3.3 Value chain analysis

Chart on Value chain analysis

4. Market Sizing

4.1 Market definition

Data Table on Offerings of companies included in the market definition

4.2 Market segment analysis

Market segments

4.3 Market size 2025

4.4 Market outlook: Forecast for 2025-2030

Chart on Global - Market size and forecast 2025-2030 ($ million)
Data Table on Global - Market size and forecast 2025-2030 ($ million)
Chart on Global Market: Year-over-year growth 2025-2030 (%)
Data Table on Global Market: Year-over-year growth 2025-2030 (%)

5. Historic Market Size

5.1 Global Electric Grill Market 2020 - 2024

Historic Market Size - Data Table on Global Electric Grill Market 2020 - 2024 ($ million)

5.2 Application segment analysis 2020 - 2024

Historic Market Size - Application Segment 2020 - 2024 ($ million)

5.3 Product Type segment analysis 2020 - 2024

Historic Market Size - Product Type Segment 2020 - 2024 ($ million)

5.4 Distribution Channel segment analysis 2020 - 2024

Historic Market Size - Distribution Channel Segment 2020 - 2024 ($ million)

5.5 Geography segment analysis 2020 - 2024

Historic Market Size - Geography Segment 2020 - 2024 ($ million)

5.6 Country segment analysis 2020 - 2024

Historic Market Size - Country Segment 2020 - 2024 ($ million)

6. Qualitative Analysis

6.1 Impact of AI on Global Electric Grill Market

6.2 Impact of geopolitical conflicts on Global Electric Grill Market

7. Five Forces Analysis

7.1 Five forces summary

Five forces analysis - Comparison between 2025 and 2030

7.2 Bargaining power of buyers

Bargaining power of buyers - Impact of key factors 2025 and 2030

7.3 Bargaining power of suppliers

Bargaining power of suppliers - Impact of key factors in 2025 and 2030

7.4 Threat of new entrants

Threat of new entrants - Impact of key factors in 2025 and 2030

7.5 Threat of substitutes

Threat of substitutes - Impact of key factors in 2025 and 2030

7.6 Threat of rivalry

Threat of rivalry - Impact of key factors in 2025 and 2030

7.7 Market condition

Chart on Market condition - Five forces 2025 and 2030

8. Market Segmentation by Application

8.1 Market segments

Chart on Application - Market share 2025-2030 (%)
Data Table on Application - Market share 2025-2030 (%)

8.2 Comparison by Application

Chart on Comparison by Application
Data Table on Comparison by Application

8.3 Commercial - Market size and forecast 2025-2030

Chart on Commercial - Market size and forecast 2025-2030 ($ million)
Data Table on Commercial - Market size and forecast 2025-2030 ($ million)
Chart on Commercial - Year-over-year growth 2025-2030 (%)
Data Table on Commercial - Year-over-year growth 2025-2030 (%)

8.4 Residential - Market size and forecast 2025-2030

Chart on Residential - Market size and forecast 2025-2030 ($ million)
Data Table on Residential - Market size and forecast 2025-2030 ($ million)
Chart on Residential - Year-over-year growth 2025-2030 (%)
Data Table on Residential - Year-over-year growth 2025-2030 (%)

8.5 Market opportunity by Application

Market opportunity by Application ($ million)
Data Table on Market opportunity by Application ($ million)

9. Market Segmentation by Product Type

9.1 Market segments

Chart on Product Type - Market share 2025-2030 (%)
Data Table on Product Type - Market share 2025-2030 (%)

9.2 Comparison by Product Type

Chart on Comparison by Product Type
Data Table on Comparison by Product Type

9.3 Portable electric grills - Market size and forecast 2025-2030

Chart on Portable electric grills - Market size and forecast 2025-2030 ($ million)
Data Table on Portable electric grills - Market size and forecast 2025-2030 ($ million)
Chart on Portable electric grills - Year-over-year growth 2025-2030 (%)
Data Table on Portable electric grills - Year-over-year growth 2025-2030 (%)

9.4 Electric smokers - Market size and forecast 2025-2030

Chart on Electric smokers - Market size and forecast 2025-2030 ($ million)
Data Table on Electric smokers - Market size and forecast 2025-2030 ($ million)
Chart on Electric smokers - Year-over-year growth 2025-2030 (%)
Data Table on Electric smokers - Year-over-year growth 2025-2030 (%)

9.5 Built-in electric grills - Market size and forecast 2025-2030

Chart on Built-in electric grills - Market size and forecast 2025-2030 ($ million)
Data Table on Built-in electric grills - Market size and forecast 2025-2030 ($ million)
Chart on Built-in electric grills - Year-over-year growth 2025-2030 (%)
Data Table on Built-in electric grills - Year-over-year growth 2025-2030 (%)

9.6 Electric griddles - Market size and forecast 2025-2030

Chart on Electric griddles - Market size and forecast 2025-2030 ($ million)
Data Table on Electric griddles - Market size and forecast 2025-2030 ($ million)
Chart on Electric griddles - Year-over-year growth 2025-2030 (%)
Data Table on Electric griddles - Year-over-year growth 2025-2030 (%)

9.7 Others - Market size and forecast 2025-2030

Chart on Others - Market size and forecast 2025-2030 ($ million)
Data Table on Others - Market size and forecast 2025-2030 ($ million)
Chart on Others - Year-over-year growth 2025-2030 (%)
Data Table on Others - Year-over-year growth 2025-2030 (%)

9.8 Market opportunity by Product Type

Market opportunity by Product Type ($ million)
Data Table on Market opportunity by Product Type ($ million)

10. Market Segmentation by Distribution Channel

10.1 Market segments

Chart on Distribution Channel - Market share 2025-2030 (%)
Data Table on Distribution Channel - Market share 2025-2030 (%)

10.2 Comparison by Distribution Channel

Chart on Comparison by Distribution Channel
Data Table on Comparison by Distribution Channel

10.3 Offline - Market size and forecast 2025-2030

Chart on Offline - Market size and forecast 2025-2030 ($ million)
Data Table on Offline - Market size and forecast 2025-2030 ($ million)
Chart on Offline - Year-over-year growth 2025-2030 (%)
Data Table on Offline - Year-over-year growth 2025-2030 (%)

10.4 Online - Market size and forecast 2025-2030

Chart on Online - Market size and forecast 2025-2030 ($ million)
Data Table on Online - Market size and forecast 2025-2030 ($ million)
Chart on Online - Year-over-year growth 2025-2030 (%)
Data Table on Online - Year-over-year growth 2025-2030 (%)

10.5 Market opportunity by Distribution Channel

Market opportunity by Distribution Channel ($ million)
Data Table on Market opportunity by Distribution Channel ($ million)

11. Customer Landscape

11.1 Customer landscape overview

Analysis of price sensitivity, lifecycle, customer purchase basket, adoption rates, and purchase criteria

12. Geographic Landscape

12.1 Geographic segmentation

Chart on Market share by geography 2025-2030 (%)
Data Table on Market share by geography 2025-2030 (%)

12.2 Geographic comparison

Chart on Geographic comparison
Data Table on Geographic comparison

12.3 North America - Market size and forecast 2025-2030

Chart on North America - Market size and forecast 2025-2030 ($ million)
Data Table on North America - Market size and forecast 2025-2030 ($ million)
Chart on North America - Year-over-year growth 2025-2030 (%)
Data Table on North America - Year-over-year growth 2025-2030 (%)
Chart on Regional Comparison - North America
Data Table on Regional Comparison - North America

12.3.1 US - Market size and forecast 2025-2030

Chart on US - Market size and forecast 2025-2030 ($ million)
Data Table on US - Market size and forecast 2025-2030 ($ million)
Chart on US - Year-over-year growth 2025-2030 (%)
Data Table on US - Year-over-year growth 2025-2030 (%)

12.3.2 Canada - Market size and forecast 2025-2030

Chart on Canada - Market size and forecast 2025-2030 ($ million)
Data Table on Canada - Market size and forecast 2025-2030 ($ million)
Chart on Canada - Year-over-year growth 2025-2030 (%)
Data Table on Canada - Year-over-year growth 2025-2030 (%)

12.3.3 Mexico - Market size and forecast 2025-2030

Chart on Mexico - Market size and forecast 2025-2030 ($ million)
Data Table on Mexico - Market size and forecast 2025-2030 ($ million)
Chart on Mexico - Year-over-year growth 2025-2030 (%)
Data Table on Mexico - Year-over-year growth 2025-2030 (%)

12.4 Europe - Market size and forecast 2025-2030

Chart on Europe - Market size and forecast 2025-2030 ($ million)
Data Table on Europe - Market size and forecast 2025-2030 ($ million)
Chart on Europe - Year-over-year growth 2025-2030 (%)
Data Table on Europe - Year-over-year growth 2025-2030 (%)
Chart on Regional Comparison - Europe
Data Table on Regional Comparison - Europe

12.4.1 Germany - Market size and forecast 2025-2030

Chart on Germany - Market size and forecast 2025-2030 ($ million)
Data Table on Germany - Market size and forecast 2025-2030 ($ million)
Chart on Germany - Year-over-year growth 2025-2030 (%)
Data Table on Germany - Year-over-year growth 2025-2030 (%)

12.4.2 UK - Market size and forecast 2025-2030

Chart on UK - Market size and forecast 2025-2030 ($ million)
Data Table on UK - Market size and forecast 2025-2030 ($ million)
Chart on UK - Year-over-year growth 2025-2030 (%)
Data Table on UK - Year-over-year growth 2025-2030 (%)

12.4.3 France - Market size and forecast 2025-2030

Chart on France - Market size and forecast 2025-2030 ($ million)
Data Table on France - Market size and forecast 2025-2030 ($ million)
Chart on France - Year-over-year growth 2025-2030 (%)
Data Table on France - Year-over-year growth 2025-2030 (%)

12.4.4 Italy - Market size and forecast 2025-2030

Chart on Italy - Market size and forecast 2025-2030 ($ million)
Data Table on Italy - Market size and forecast 2025-2030 ($ million)
Chart on Italy - Year-over-year growth 2025-2030 (%)
Data Table on Italy - Year-over-year growth 2025-2030 (%)

12.4.5 Spain - Market size and forecast 2025-2030

Chart on Spain - Market size and forecast 2025-2030 ($ million)
Data Table on Spain - Market size and forecast 2025-2030 ($ million)
Chart on Spain - Year-over-year growth 2025-2030 (%)
Data Table on Spain - Year-over-year growth 2025-2030 (%)

12.4.6 The Netherlands - Market size and forecast 2025-2030

Chart on The Netherlands - Market size and forecast 2025-2030 ($ million)
Data Table on The Netherlands - Market size and forecast 2025-2030 ($ million)
Chart on The Netherlands - Year-over-year growth 2025-2030 (%)
Data Table on The Netherlands - Year-over-year growth 2025-2030 (%)

12.5 APAC - Market size and forecast 2025-2030

Chart on APAC - Market size and forecast 2025-2030 ($ million)
Data Table on APAC - Market size and forecast 2025-2030 ($ million)
Chart on APAC - Year-over-year growth 2025-2030 (%)
Data Table on APAC - Year-over-year growth 2025-2030 (%)
Chart on Regional Comparison - APAC
Data Table on Regional Comparison - APAC

12.5.1 China - Market size and forecast 2025-2030

Chart on China - Market size and forecast 2025-2030 ($ million)
Data Table on China - Market size and forecast 2025-2030 ($ million)
Chart on China - Year-over-year growth 2025-2030 (%)
Data Table on China - Year-over-year growth 2025-2030 (%)

12.5.2 Japan - Market size and forecast 2025-2030

Chart on Japan - Market size and forecast 2025-2030 ($ million)
Data Table on Japan - Market size and forecast 2025-2030 ($ million)
Chart on Japan - Year-over-year growth 2025-2030 (%)
Data Table on Japan - Year-over-year growth 2025-2030 (%)

12.5.3 India - Market size and forecast 2025-2030

Chart on India - Market size and forecast 2025-2030 ($ million)
Data Table on India - Market size and forecast 2025-2030 ($ million)
Chart on India - Year-over-year growth 2025-2030 (%)
Data Table on India - Year-over-year growth 2025-2030 (%)

12.5.4 South Korea - Market size and forecast 2025-2030

Chart on South Korea - Market size and forecast 2025-2030 ($ million)
Data Table on South Korea - Market size and forecast 2025-2030 ($ million)
Chart on South Korea - Year-over-year growth 2025-2030 (%)
Data Table on South Korea - Year-over-year growth 2025-2030 (%)

12.5.5 Australia - Market size and forecast 2025-2030

Chart on Australia - Market size and forecast 2025-2030 ($ million)
Data Table on Australia - Market size and forecast 2025-2030 ($ million)
Chart on Australia - Year-over-year growth 2025-2030 (%)
Data Table on Australia - Year-over-year growth 2025-2030 (%)

12.5.6 Indonesia - Market size and forecast 2025-2030

Chart on Indonesia - Market size and forecast 2025-2030 ($ million)
Data Table on Indonesia - Market size and forecast 2025-2030 ($ million)
Chart on Indonesia - Year-over-year growth 2025-2030 (%)
Data Table on Indonesia - Year-over-year growth 2025-2030 (%)

12.6 South America - Market size and forecast 2025-2030

Chart on South America - Market size and forecast 2025-2030 ($ million)
Data Table on South America - Market size and forecast 2025-2030 ($ million)
Chart on South America - Year-over-year growth 2025-2030 (%)
Data Table on South America - Year-over-year growth 2025-2030 (%)
Chart on Regional Comparison - South America
Data Table on Regional Comparison - South America

12.6.1 Brazil - Market size and forecast 2025-2030

Chart on Brazil - Market size and forecast 2025-2030 ($ million)
Data Table on Brazil - Market size and forecast 2025-2030 ($ million)
Chart on Brazil - Year-over-year growth 2025-2030 (%)
Data Table on Brazil - Year-over-year growth 2025-2030 (%)

12.6.2 Argentina - Market size and forecast 2025-2030

Chart on Argentina - Market size and forecast 2025-2030 ($ million)
Data Table on Argentina - Market size and forecast 2025-2030 ($ million)
Chart on Argentina - Year-over-year growth 2025-2030 (%)
Data Table on Argentina - Year-over-year growth 2025-2030 (%)

12.6.3 Chile - Market size and forecast 2025-2030

Chart on Chile - Market size and forecast 2025-2030 ($ million)
Data Table on Chile - Market size and forecast 2025-2030 ($ million)
Chart on Chile - Year-over-year growth 2025-2030 (%)
Data Table on Chile - Year-over-year growth 2025-2030 (%)

12.7 Middle East and Africa - Market size and forecast 2025-2030

Chart on Middle East and Africa - Market size and forecast 2025-2030 ($ million)
Data Table on Middle East and Africa - Market size and forecast 2025-2030 ($ million)
Chart on Middle East and Africa - Year-over-year growth 2025-2030 (%)
Data Table on Middle East and Africa - Year-over-year growth 2025-2030 (%)
Chart on Regional Comparison - Middle East and Africa
Data Table on Regional Comparison - Middle East and Africa

12.7.1 Saudi Arabia - Market size and forecast 2025-2030

Chart on Saudi Arabia - Market size and forecast 2025-2030 ($ million)
Data Table on Saudi Arabia - Market size and forecast 2025-2030 ($ million)
Chart on Saudi Arabia - Year-over-year growth 2025-2030 (%)
Data Table on Saudi Arabia - Year-over-year growth 2025-2030 (%)

12.7.2 UAE - Market size and forecast 2025-2030

Chart on UAE - Market size and forecast 2025-2030 ($ million)
Data Table on UAE - Market size and forecast 2025-2030 ($ million)
Chart on UAE - Year-over-year growth 2025-2030 (%)
Data Table on UAE - Year-over-year growth 2025-2030 (%)

12.7.3 South Africa - Market size and forecast 2025-2030

Chart on South Africa - Market size and forecast 2025-2030 ($ million)
Data Table on South Africa - Market size and forecast 2025-2030 ($ million)
Chart on South Africa - Year-over-year growth 2025-2030 (%)
Data Table on South Africa - Year-over-year growth 2025-2030 (%)

12.7.4 Israel - Market size and forecast 2025-2030

Chart on Israel - Market size and forecast 2025-2030 ($ million)
Data Table on Israel - Market size and forecast 2025-2030 ($ million)
Chart on Israel - Year-over-year growth 2025-2030 (%)
Data Table on Israel - Year-over-year growth 2025-2030 (%)

12.7.5 Turkey - Market size and forecast 2025-2030

Chart on Turkey - Market size and forecast 2025-2030 ($ million)
Data Table on Turkey - Market size and forecast 2025-2030 ($ million)
Chart on Turkey - Year-over-year growth 2025-2030 (%)
Data Table on Turkey - Year-over-year growth 2025-2030 (%)

12.8 Market opportunity by geography

Market opportunity by geography ($ million)
Data Tables on Market opportunity by geography ($ million)

13. Drivers, Challenges, and Opportunity

13.1 Market drivers

Technological advancements and smart appliance integration
Health consciousness and clean cooking preferences
Rising urbanization and apartment living dynamics

13.2 Market challenges

Infrastructure constraints and power dependence
Absence of traditional grilling flavors
High initial equipment capital costs

13.3 Impact of drivers and challenges

Impact of drivers and challenges in 2025 and 2030

13.4 Market opportunities

Enforcement of strict fire regulations
Expansion of outdoor living spaces
Adoption of renewable energy sources

14. Competitive Landscape

14.1 Overview

14.2

Overview on criticality of inputs and factors of differentiation

14.3 Landscape disruption

Overview on factors of disruption

14.4 Industry risks

Impact of key risks on business

15. Competitive Analysis

15.1 Companies profiled

Companies covered

15.2 Company ranking index

15.3 Market positioning of companies

Matrix on companies position and classification

15.4 Bosch Home Appliances

Bosch Home Appliances - Overview
Bosch Home Appliances - Product / Service
Bosch Home Appliances - Key offerings
SWOT

15.5 Breville Group Ltd.

Breville Group Ltd. - Overview
Breville Group Ltd. - Product / Service
Breville Group Ltd. - Key offerings
SWOT

15.6 Char Broil LLC

Char Broil LLC - Overview
Char Broil LLC - Product / Service
Char Broil LLC - Key offerings
SWOT

15.7 Cloer Elektrogerate GmbH

Cloer Elektrogerate GmbH - Overview
Cloer Elektrogerate GmbH - Product / Service
Cloer Elektrogerate GmbH - Key offerings
SWOT

15.8 Cuisinart

Cuisinart - Overview
Cuisinart - Product / Service
Cuisinart - Key offerings
SWOT

15.9 De Longhi S.p.A

De Longhi S.p.A - Overview
De Longhi S.p.A - Business segments
De Longhi S.p.A - Key offerings
De Longhi S.p.A - Segment focus
SWOT

15.10 Dometic Group AB

Dometic Group AB - Overview
Dometic Group AB - Business segments
Dometic Group AB - Key offerings
Dometic Group AB - Segment focus
SWOT

15.11 Hamilton Beach

Hamilton Beach - Overview
Hamilton Beach - Business segments
Hamilton Beach - Key offerings
Hamilton Beach - Segment focus
SWOT

15.12 Koninklijke Philips NV

Koninklijke Philips NV - Overview
Koninklijke Philips NV - Business segments
Koninklijke Philips NV - Key news
Koninklijke Philips NV - Key offerings
Koninklijke Philips NV - Segment focus
SWOT

15.13 Midea Group Co. Ltd.

Midea Group Co. Ltd. - Overview
Midea Group Co. Ltd. - Business segments
Midea Group Co. Ltd. - Key news
Midea Group Co. Ltd. - Key offerings
Midea Group Co. Ltd. - Segment focus
SWOT

15.14 Oster

Oster - Overview
Oster - Product / Service
Oster - Key offerings
SWOT

15.15 SharkNinja Operating LLC

SharkNinja Operating LLC - Overview
SharkNinja Operating LLC - Business segments
SharkNinja Operating LLC - Key offerings
SharkNinja Operating LLC - Segment focus
SWOT

15.16 Tefal

Tefal - Overview
Tefal - Product / Service
Tefal - Key offerings
SWOT

15.17 Weber Inc.

Weber Inc. - Overview
Weber Inc. - Product / Service
Weber Inc. - Key offerings
SWOT

15.18 Zojirushi America Corp.

Zojirushi America Corp. - Overview
Zojirushi America Corp. - Product / Service
Zojirushi America Corp. - Key offerings
SWOT

16. Appendix

16.1 Scope of the report

Market definition
Objectives
Notes and caveats

16.2 Inclusions and exclusions checklist

Inclusions checklist
Exclusions checklist

16.3 Currency conversion rates for US$

16.4 Research methodology

16.5 Data procurement

Information sources

16.6 Data validation

16.7 Validation techniques employed for market sizing

16.8 Data synthesis

16.9 360 degree market analysis

16.10 List of abbreviations

Research Methodology

Technavio presents a detailed picture of the market by way of study, synthesis, and summation of data from multiple sources. The analysts have presented the various facets of the market with a particular focus on identifying the key industry influencers. The data thus presented is comprehensive, reliable, and the result of extensive research, both primary and secondary.

INFORMATION SOURCES

Primary sources

  • Manufacturers and suppliers
  • Channel partners
  • Industry experts
  • Strategic decision makers

Secondary sources

  • Industry journals and periodicals
  • Government data
  • Financial reports of key industry players
  • Historical data
  • Press releases

DATA ANALYSIS

Data Synthesis

  • Collation of data
  • Estimation of key figures
  • Analysis of derived insights

Data Validation

  • Triangulation with data models
  • Reference against proprietary databases
  • Corroboration with industry experts

REPORT WRITING

Qualitative

  • Market drivers
  • Market challenges
  • Market trends
  • Five forces analysis

Quantitative

  • Market size and forecast
  • Market segmentation
  • Geographical insights
  • Competitive landscape

Interested in this report?

Get your sample now to see our research methodology and insights!

Download Now

Frequently Asked Questions

Electric Grill market growth will increase by USD 1130.6 million during 2026-2030.

The Electric Grill market is expected to grow at a CAGR of 4.6% during 2026-2030.

Electric Grill market is segmented by Application (Commercial, Residential) Product type (Portable electric grills, Electric smokers, Built-in electric grills, Electric griddles, Others) Distribution channel (Offline, Online)

Bosch Home Appliances, Breville Group Ltd., Char Broil LLC, Cloer Elektrogerate GmbH, Coyote Outdoor Living Inc., Cuisinart, De Longhi S.p.A, Dometic Group AB, Hamilton Beach, Kenyon International Inc., Koninklijke Philips NV, Midea Group Co. Ltd., Oster, Princess Household Appliances, ROMMELSBACHER ElektroHausgerate, Salton Corp., SEVERIN Elektrogerate GmbH, SharkNinja Operating LLC, Tefal, Weber Inc., Zojirushi America Corp. are a few of the key vendors in the Electric Grill market.

North America will register the highest growth rate of 40.3% among the other regions. Therefore, the Electric Grill market in North America is expected to garner significant business opportunities for the vendors during the forecast period.

US, Canada, Mexico, Germany, UK, France, Italy, Spain, The Netherlands, China, Japan, India, South Korea, Australia, Indonesia, Brazil, Argentina, Chile, Saudi Arabia, UAE, South Africa, Israel, Turkey

  • Technological advancements and smart appliance integration is the driving factor this market.

The Electric Grill market vendors should focus on grabbing business opportunities from the Application segment as it accounted for the largest market share in the base year.
RIA - Research AI Assistant
Ask RIA
