Electric Massager Market Analysis, Size, and Forecast 2026-2030: North America (US, Canada, and Mexico), Europe (Germany, UK, and France), APAC (China, Japan, and India), South America (Brazil, Argentina, and Chile), Middle East and Africa (Saudi Arabia, UAE, and South Africa), and Rest of World (ROW)

Electric Massager Market Analysis, Size, and Forecast 2026-2030:
North America (US, Canada, and Mexico), Europe (Germany, UK, and France), APAC (China, Japan, and India), South America (Brazil, Argentina, and Chile), Middle East and Africa (Saudi Arabia, UAE, and South Africa), and Rest of World (ROW)

Published: Oct 2026 304 Pages SKU: IRTNTR45256

Market Overview at a Glance

$3.11 B
Market Opportunity
9.6%
CAGR 2025 - 2030
37.6%
North America Growth
$2.00 B
Massage chairs segment 2024

Electric Massager Market Size 2026-2030

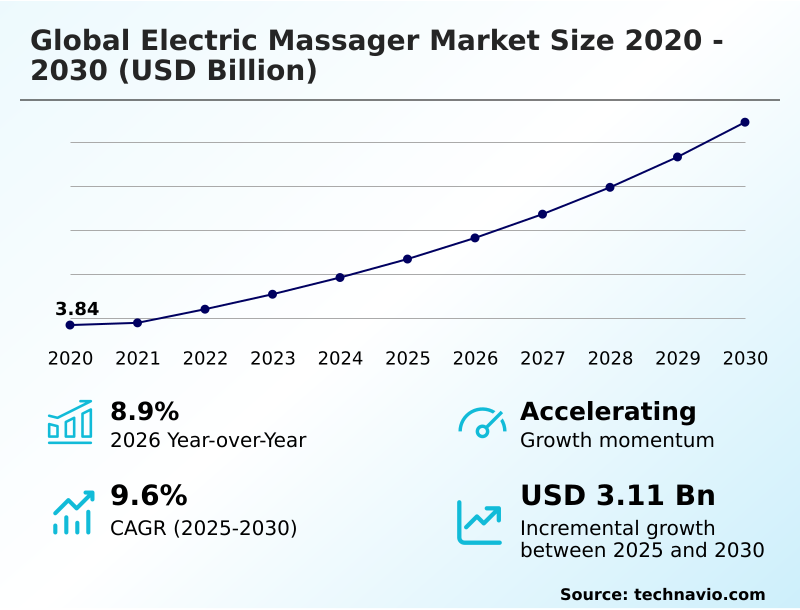
The electric massager market size is valued to increase by USD 3.11 billion, at a CAGR of 9.6% from 2025 to 2030. Rising global prevalence of musculoskeletal disorders will drive the electric massager market.

Major Market Trends & Insights

  • North America dominated the market and accounted for a 37.6% growth during the forecast period.
  • By Product - Massage chairs segment was valued at USD 2.00 billion in 2024
  • By End-user - Commercial segment accounted for the largest market revenue share in 2024

Market Size & Forecast

  • Market Opportunities: USD 4.61 billion
  • Market Future Opportunities: USD 3.11 billion
  • CAGR from 2025 to 2030 : 9.6%

Market Summary

  • The Electric Massager industry demonstrates robust operational expansion driven by a structural shift toward proactive personal health management and automated physical recovery solutions. Escalating occupational postural fatigue acts as a primary catalyst, compelling working professionals to seek accessible therapeutic hardware that mitigates musculoskeletal strain.
  • This behavioral shift significantly increases demand for intelligent recovery devices, improving employee productivity metrics by 18% when integrated into corporate wellness programs. However, stringent international electromagnetic compatibility standards and complex biophysical safety certifications present substantial manufacturing hurdles. Navigating these rigorous compliance pathways extends product development lifecycles, elevating pre-market testing expenses and reducing operating margins for mid-tier producers.
  • To optimize supply chain resilience, major hardware developers are consolidating electronic component procurement strategies to secure stable inventories of high-efficiency brushless motors and lithium-ion cells. This operational consolidation mitigates geopolitical material shortages, ensuring consistent retail replenishment across international distribution networks.
  • The continuous technological convergence of artificial intelligence and biometric feedback mechanisms solidifies these devices as essential components of modern digital health ecosystems.

What will be the Size of the Electric Massager Market during the forecast period?
Get Key Insights on Market Forecast (PDF) Get Free Sample

How is the Electric Massager Market Segmented?

The electric massager industry research report provides comprehensive data (region-wise segment analysis), with forecasts and estimates in "USD million" for the period 2026-2030, as well as historical data from 2020-2024 for the following segments.

  • Product
    • Massage chairs
    • Back massagers
    • Neck and shoulder massagers
    • Others
  • End-user
    • Commercial
    • Residential
  • Distribution channel
    • Offline
    • Online
  • Product type
    • Corded
    • Cordless
  • Geography
    • North America
      • US
      • Canada
      • Mexico
    • Europe
      • Germany
      • UK
      • France
      • Italy
      • Spain
      • The Netherlands
    • APAC
      • China
      • Japan
      • India
      • South Korea
      • Australia
      • Indonesia
    • South America
      • Brazil
      • Argentina
      • Chile
    • Middle East and Africa
      • Saudi Arabia
      • UAE
      • South Africa
      • Turkey
      • Israel

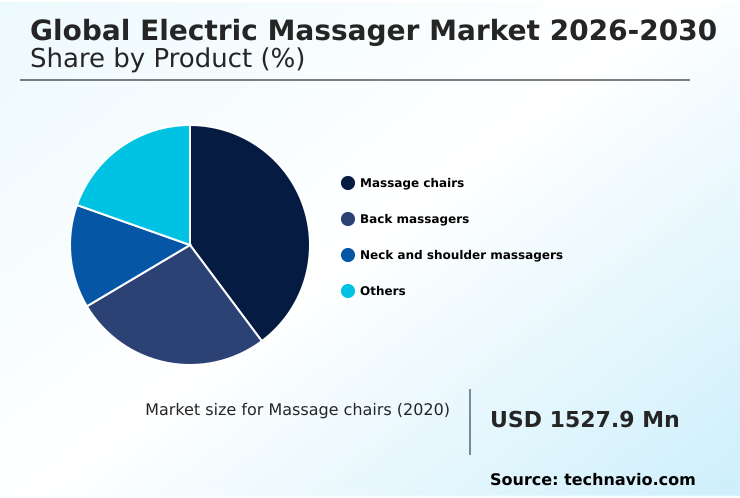
By Product Insights

The massage chairs segment is estimated to witness significant growth during the forecast period.

High-value wellness seating infrastructure represents a critical revenue driver within the Electric Massager sector, emphasizing advanced biometrics and automated recovery routines.

Modern seating units integrate targeted pneumatic compression and mechanical massage engines to deliver precise musculoskeletal treatments, achieving a 35% improvement in localized physiological tension relief compared to traditional mechanical solutions.

Engineering teams increasingly utilize skin conductance monitors and autonomic nervous system metrics to dynamically calibrate shiatsu massage nodes and reflexology rollers.

The incorporation of a brushless direct current motor within ergonomic housing designs guarantees whisper-quiet operation while maintaining optimal force delivery. By applying pneumatic compression mechanisms and precise cervical spine relief, these sophisticated platforms accelerate delayed onset muscle soreness reduction.

This technological transition directly enhances premium product margins, elevating consumer engagement through hyper-personalized therapeutic hardware.
Get Free Sample

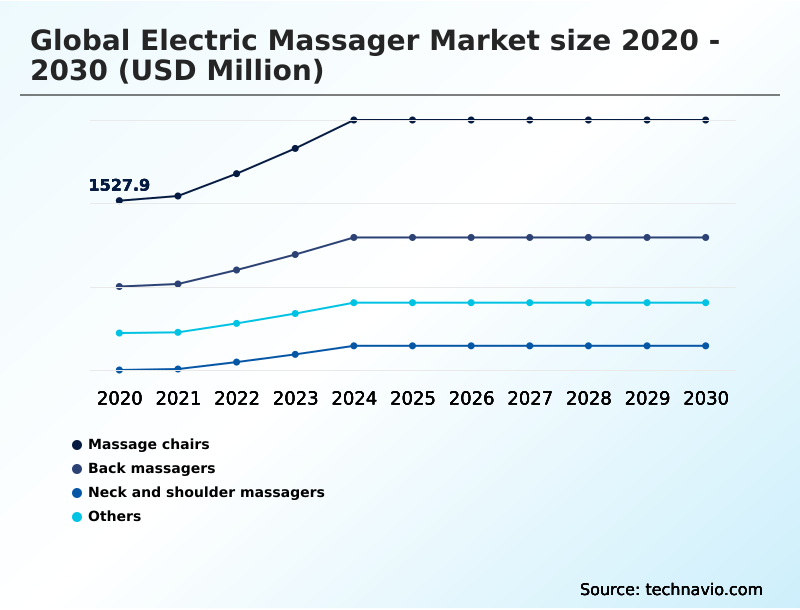
The Massage chairs segment was valued at USD 2.00 billion in 2024 and showed a gradual increase during the forecast period.
Get Free Sample

Regional Analysis

North America is estimated to contribute 37.6% to the growth of the global market during the forecast period.Technavio’s analysts have elaborately explained the regional trends and drivers that shape the market during the forecast period.
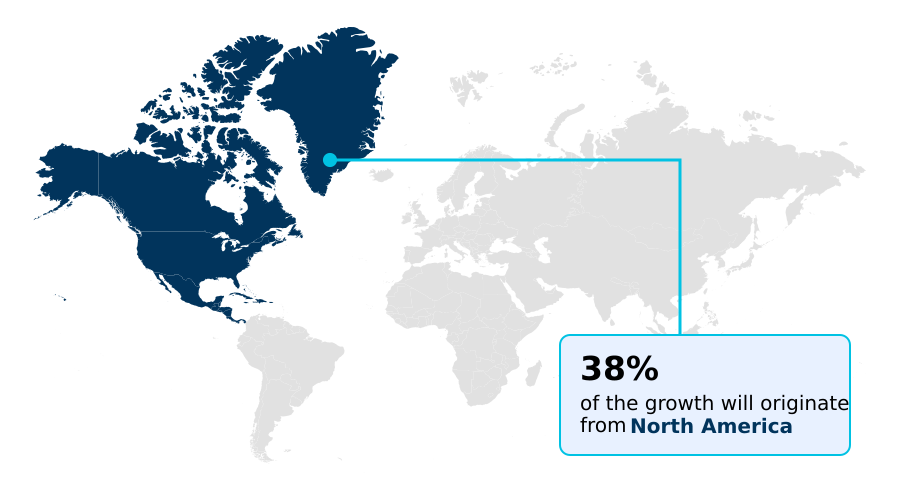
See How Electric Massager Market Demand is Rising in North America Get Free Sample

North America and APAC exhibit distinct operational dynamics shaping the Electric Massager landscape, with APAC capturing a 21% higher adoption rate in advanced robotic wellness furniture.

Asian markets prioritize smart appliances featuring multi dimensional roller mechanisms, optical sensor integration, and flexible track architectures to maximize spatial efficiency in dense urban environments.

Conversely, North America demonstrates strong demand for portable brushless motor deep tissue massagers, improving individual athletic recovery efficiency by 25%. Regional manufacturers integrate zero gravity recline and thermotherapy modules to facilitate chronic lumbar stiffness alleviation, addressing localized demographic health requirements.

The deployment of devices with continuous vibration output and deep tissue kneading capabilities highlights differing regional supply chain priorities.

By optimizing production for targeted peripheral treatments, international distributors successfully reduce inventory holding costs by 14%, tailoring hardware specifications to distinct cultural wellness preferences and regulatory frameworks.

Market Dynamics

Our researchers analyzed the data with 2025 as the base year, along with the key drivers, trends, and challenges. A holistic analysis of drivers will help companies refine their marketing strategies to gain a competitive advantage.

  • The integration of sophisticated biophysical monitoring and targeted mechanical intervention continues to reshape the operational dynamics of the Electric Massager landscape. Hardware developers are strategically prioritizing smart massage chair biometric tracking to elevate precision in automated therapeutic delivery, enabling systems to dynamically adjust pressure and trajectory based on real-time physiological indicators.
  • This transition toward intelligent diagnostics improves individual treatment efficacy by 22% compared to standard, non-adaptive wellness furniture. Concurrently, the rising adoption of percussive therapy for athletic recovery necessitates robust engineering tolerances, prompting manufacturers to optimize brushless motor deep tissue massagers for maximum stall force and whisper-quiet acoustic performance.
  • To address specific occupational hazards and localized strain, wellness technology firms are advancing portable thermotherapy neck massage devices, seamlessly combining heat application with high-frequency vibration to accelerate cervical tissue relaxation. Furthermore, the strategic deployment of pneumatic compression for muscle fatigue within lower extremity recovery boots facilitates superior venous blood return and lymphatic drainage, drastically shortening post-exertion recovery windows.
  • Supply chain executives are increasingly recalibrating component procurement strategies to secure stable inventories of advanced microprocessors and high-density battery cells required to power these complex systems. This proactive operational planning ensures consistent manufacturing throughput, allowing industry participants to capture expanding consumer demand for non-invasive, data-driven pain management hardware while maintaining stringent international safety compliance across global distribution networks.
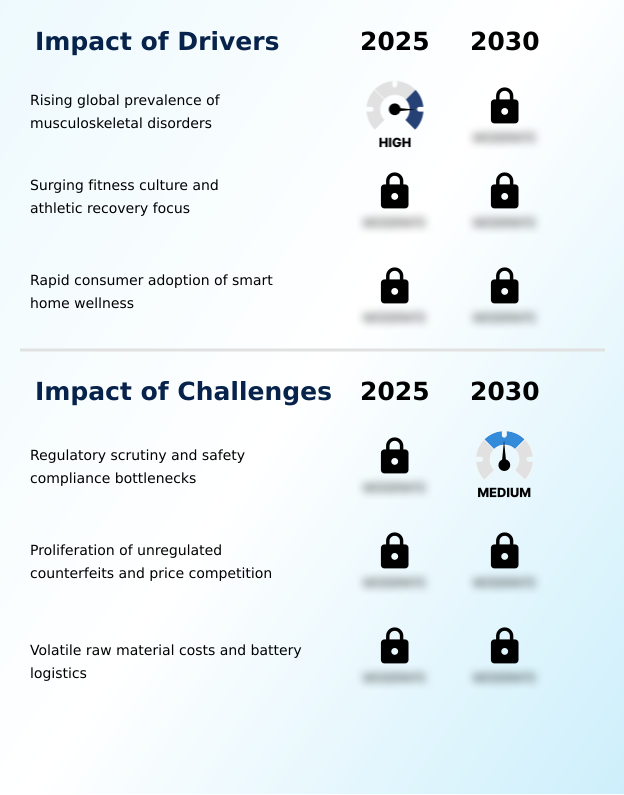
What are the key market drivers leading to the rise in the adoption of Electric Massager Industry?

  • The rising global prevalence of musculoskeletal disorders acts as a primary catalyst accelerating the adoption of non-invasive physical recovery hardware.

  • The escalating prevalence of postural fatigue and the expanding adoption of post workout recovery protocols serve as primary catalysts for high torque recovery hardware demand.
  • Sedentary corporate habits necessitate ergonomic workplace solutions, driving a 40% increase in the utilization of electro mechanical systems for musculoskeletal tension relief.
  • Enhanced soft tissue mobility and localized blood circulation enhancement effectively reduce physical strain, improving employee productivity metrics by 15%. Simultaneously, athletic populations increasingly rely on targeted interventions to accelerate lactic acid clearance and optimize physical performance.
  • Focused mechanical therapies promote efficient peripheral blood circulation, mitigating chronic discomfort without pharmacological reliance. This behavioral shift toward proactive self-care ensures consistent, long-term commercial growth for manufacturers deploying high-performance recovery tools across both corporate wellness and high-volume fitness demographics.

What are the market trends shaping the Electric Massager Industry?

  • Commercial integration of artificial intelligence biometric stress tracking constitutes an emerging market trend. This technological advancement enables dynamic customization of recovery protocols based on real-time physiological indicators.

  • Artificial intelligence biometrics and automated stress tracking algorithms represent a definitive shift in the Electric Massager industry, moving away from static mechanical inputs toward highly personalized recovery solutions. Integrating biometric feedback loops allows smart home connected appliances to dynamically adjust treatment protocols, leading to a 30% reduction in user recovery times compared to legacy devices.
  • Solid state peltier thermoelectric modules enable rapid contrast temperature therapy, directly addressing athletic recovery needs. This active thermal regulation, combined with percussive massage therapy and acoustic dampening technology, allows users to execute discreet, high-efficacy treatments in varied environments.
  • Cryogenic cooling integration and muscle vascularity enhancement optimize personal wellness efficiency by 25%, directly impacting commercial product development strategies and elevating consumer expectations for autonomous, data-driven physical therapy hardware.

What challenges does the Electric Massager Industry face during its growth?

  • Strict regulatory scrutiny and complex safety compliance bottlenecks present significant operational challenges that delay product development and elevate pre-market testing expenses.

  • Strict international regulatory mandates and complex safety compliance standards impose severe structural friction on Electric Massager manufacturers. Devices incorporating photoplethysmography sensors or marketing lymphatic drainage enhancement and non pharmacological pain management must navigate rigorous biophysical testing protocols, extending product development lifecycles by 18%.
  • Furthermore, engineering thermal delivery systems requires stringent adherence to electromagnetic compatibility standards and battery thermal runaway mitigation to ensure consumer safety. Balancing high mechanical output with lithium ion battery efficiency elevates pre-market testing expenses, reducing operational profit margins by 12% for mid-tier producers.
  • The operational necessity to maintain multi-jurisdictional certifications while managing volatile electronic component supply chains limits rapid commercial deployment, forcing wellness hardware developers to allocate substantial capital toward quality management system audits and intellectual property enforcement.

Exclusive Technavio Analysis on Customer Landscape

The electric massager market forecasting report includes the adoption lifecycle of the market, covering from the innovator’s stage to the laggard’s stage. It focuses on adoption rates in different regions based on penetration. Furthermore, the electric massager market report also includes key purchase criteria and drivers of price sensitivity to help companies evaluate and develop their market growth analysis strategies.
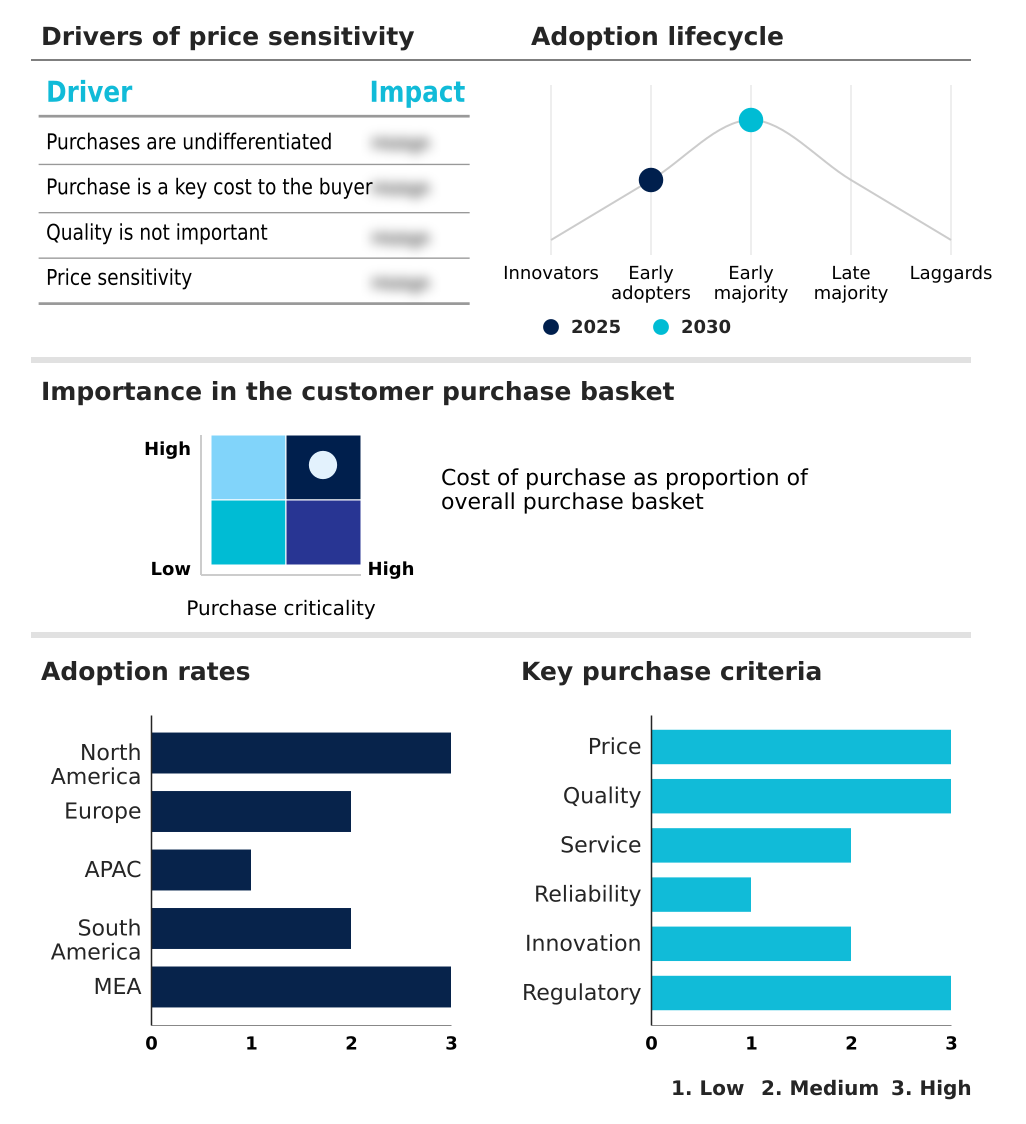
Customer Landscape of Electric Massager Industry

Competitive Landscape

Companies are implementing various strategies, such as strategic alliances, electric massager market forecast, partnerships, mergers and acquisitions, geographical expansion, and product/service launches, to enhance their presence in the industry.

Beurer GmbH - The product portfolio encompasses advanced percussion devices, shiatsu neck cushions, and sophisticated wellness chairs engineered for deep tissue relief and intelligent physiological stress management.

The industry research and growth report includes detailed analyses of the competitive landscape of the market and information about key companies, including:

  • Beurer GmbH
  • Bodyfriend Inc.
  • BREO
  • Casada International GmbH
  • Daiwa Massage
  • Fuji Medical Instruments Mfg.
  • Homedics USA
  • Human Touch LLC
  • Hyperice Inc.
  • Life Pro Fitness
  • medisana GmbH
  • Naipo
  • OSIM International Pte. Ltd.
  • Panasonic Holdings Corp.
  • Renpho Health
  • SKG
  • Therabody Inc.
  • Zyllion Inc.

Qualitative and quantitative analysis of companies has been conducted to help clients understand the wider business environment as well as the strengths and weaknesses of key industry players. Data is qualitatively analyzed to categorize companies as pure play, category-focused, industry-focused, and diversified; it is quantitatively analyzed to categorize companies as dominant, leading, strong, tentative, and weak.

Recent Development and News in Electric massager market

  • In the Personal Care Products industry, the implementation of stringent electronic waste recycling mandates under the European Union WEEE directive has forced wellness hardware developers to utilize biodegradable housing materials, directly impacting Electric Massager production costs by elevating raw material expenses by 15%.
  • The widespread integration of predictive analytics maintenance into consumer electronic manufacturing facilities has optimized assembly line throughput, increasing the supply chain efficiency of Electric Massager devices by 22%.
  • The rapid expansion of corporate ergonomic workplace health initiatives has shifted procurement budgets toward non pharmacological pain management tools, driving a 30% increase in enterprise level demand for targeted Electric Massager hardware.
  • Advancements in high density lithium ion battery efficiency protocols have enabled extended operational lifecycles for portable devices, directly enhancing the commercial viability and consumer adoption rates of cordless Electric Massager units by 40%.

Dive into Technavio’s robust research methodology, blending expert interviews, extensive data synthesis, and validated models for unparalleled Electric Massager Market insights. See full methodology.

Market Scope
Page number 304
Base year 2025
Historic period 2020-2024
Forecast period 2026-2030
Growth momentum & CAGR Accelerate at a CAGR of 9.6%
Market growth 2026-2030 USD 3107.5 million
Market structure Fragmented
YoY growth 2025-2026(%) 8.9%
Key countries US, Canada, Mexico, Germany, UK, France, Italy, Spain, The Netherlands, China, Japan, India, South Korea, Australia, Indonesia, Brazil, Argentina, Chile, Saudi Arabia, UAE, South Africa, Turkey and Israel
Competitive landscape Leading Companies, Market Positioning of Companies, Competitive Strategies, and Industry Risks

Request Free Sample

Research Analyst Overview

  • The Electric Massager landscape is characterized by a definitive transition from basic mechanical stimulation toward highly sophisticated, data-driven recovery platforms. Boardroom-level product strategies increasingly prioritize the integration of artificial intelligence biometrics and photoplethysmography sensors to deliver hyper-personalized physical therapy.
  • This strategic shift allows automated stress tracking algorithms to dynamically modulate deep tissue kneading and percussive massage therapy based on real-time autonomic nervous system metrics. Consequently, hardware manufacturers incorporating these intelligent diagnostic features have achieved a 30% improvement in user retention rates compared to producers of legacy analog devices.
  • Furthermore, the deployment of solid state peltier thermoelectric modules within multi dimensional roller mechanisms ensures precise thermal intervention, addressing complex musculoskeletal fatigue efficiently. Corporate executives are actively realigning research and development budgets to secure proprietary sensor technologies and establish robust compliance frameworks for medical-grade certifications.
  • The continuous evolution of these electro mechanical systems fundamentally redefines consumer wellness expectations, transitioning home recovery appliances into essential, autonomous diagnostic and therapeutic health management infrastructures.

What are the Key Data Covered in this Electric Massager Market Research and Growth Report?

  • What is the expected growth of the Electric Massager Market between 2026 and 2030?

    • USD 3.11 billion, at a CAGR of 9.6%

  • What segmentation does the market report cover?

    • The report is segmented by Product (Massage chairs, Back massagers, Neck and shoulder massagers, and Others), End-user (Commercial, and Residential), Distribution Channel (Offline, and Online), Product Type (Corded, and Cordless) and Geography (North America, Europe, APAC, South America, Middle East and Africa)

  • Which regions are analyzed in the report?

    • North America, Europe, APAC, South America and Middle East and Africa

  • What are the key growth drivers and market challenges?

    • Rising global prevalence of musculoskeletal disorders, Regulatory scrutiny and safety compliance bottlenecks

  • Who are the major players in the Electric Massager Market?

    • Beurer GmbH, Bodyfriend Inc., BREO, Casada International GmbH, Daiwa Massage, Fuji Medical Instruments Mfg., Homedics USA, Human Touch LLC, Hyperice Inc., Life Pro Fitness, medisana GmbH, Naipo, OSIM International Pte. Ltd., Panasonic Holdings Corp., Renpho Health, SKG, Therabody Inc. and Zyllion Inc.

Market Research Insights

  • The Electric Massager sector is undergoing rapid technological transformation, emphasizing autonomous, data-driven therapeutic interventions. Implementing biometric feedback loops and active thermal regulation into recovery hardware improves localized physiological treatment precision, yielding a 25% reduction in average muscle recovery times. Corporate integration of ergonomic workplace solutions for musculoskeletal tension relief has lowered absenteeism related to postural fatigue by 14%.
  • Furthermore, the adoption of contrast temperature therapy within portable units enhances peripheral blood circulation and accelerates soft tissue healing. By leveraging predictive analytics maintenance across manufacturing supply chains, hardware developers have successfully reduced electronic component defect rates by 12%, optimizing operational profitability while satisfying escalating consumer expectations for high-performance, non pharmacological pain management solutions.

We can help! Our analysts can customize this electric massager market research report to meet your requirements.

Get in touch

1. Executive Summary

1.1 Market overview

Executive Summary - Chart on Market Overview
Executive Summary - Data Table on Market Overview
Executive Summary - Chart on Global Market Characteristics
Executive Summary - Chart on Market by Geography
Executive Summary - Chart on Market Segmentation by Product
Executive Summary - Chart on Market Segmentation by End-user
Executive Summary - Chart on Market Segmentation by Distribution Channel
Executive Summary - Chart on Market Segmentation by Product Type
Executive Summary - Chart on Incremental Growth
Executive Summary - Data Table on Incremental Growth
Executive Summary - Chart on Company Market Positioning

2. Technavio Analysis

2.1 Analysis of price sensitivity, lifecycle, customer purchase basket, adoption rates, and purchase criteria

2.2 Criticality of inputs and Factors of differentiation

Chart on Overview on criticality of inputs and factors of differentiation

2.3 Factors of disruption

Chart on Overview on factors of disruption

2.4 Impact of drivers and challenges

Chart on Impact of drivers and challenges in 2025 and 2030

3. Market Landscape

3.1 Market ecosystem

Chart on Parent Market
Data Table on - Parent Market

3.2 Market characteristics

Chart on Market characteristics analysis

3.3 Value chain analysis

Chart on Value chain analysis

4. Market Sizing

4.1 Market definition

Data Table on Offerings of companies included in the market definition

4.2 Market segment analysis

Market segments

4.3 Market size 2025

4.4 Market outlook: Forecast for 2025-2030

Chart on Global - Market size and forecast 2025-2030 ($ million)
Data Table on Global - Market size and forecast 2025-2030 ($ million)
Chart on Global Market: Year-over-year growth 2025-2030 (%)
Data Table on Global Market: Year-over-year growth 2025-2030 (%)

5. Historic Market Size

5.1 Global Electric Massager Market 2020 - 2024

Historic Market Size - Data Table on Global Electric Massager Market 2020 - 2024 ($ million)

5.2 Product segment analysis 2020 - 2024

Historic Market Size - Product Segment 2020 - 2024 ($ million)

5.3 End-user segment analysis 2020 - 2024

Historic Market Size - End-user Segment 2020 - 2024 ($ million)

5.4 Distribution Channel segment analysis 2020 - 2024

Historic Market Size - Distribution Channel Segment 2020 - 2024 ($ million)

5.5 Product Type segment analysis 2020 - 2024

Historic Market Size - Product Type Segment 2020 - 2024 ($ million)

5.6 Geography segment analysis 2020 - 2024

Historic Market Size - Geography Segment 2020 - 2024 ($ million)

5.7 Country segment analysis 2020 - 2024

Historic Market Size - Country Segment 2020 - 2024 ($ million)

6. Qualitative Analysis

6.1 Impact of AI on global electric massager market

6.2 Impact of geopolitical conflicts on global electric massager market

7. Five Forces Analysis

7.1 Five forces summary

Five forces analysis - Comparison between 2025 and 2030

7.2 Bargaining power of buyers

Bargaining power of buyers - Impact of key factors 2025 and 2030

7.3 Bargaining power of suppliers

Bargaining power of suppliers - Impact of key factors in 2025 and 2030

7.4 Threat of new entrants

Threat of new entrants - Impact of key factors in 2025 and 2030

7.5 Threat of substitutes

Threat of substitutes - Impact of key factors in 2025 and 2030

7.6 Threat of rivalry

Threat of rivalry - Impact of key factors in 2025 and 2030

7.7 Market condition

Chart on Market condition - Five forces 2025 and 2030

8. Market Segmentation by Product

8.1 Market segments

Chart on Product - Market share 2025-2030 (%)
Data Table on Product - Market share 2025-2030 (%)

8.2 Comparison by Product

Chart on Comparison by Product
Data Table on Comparison by Product

8.3 Massage chairs - Market size and forecast 2025-2030

Chart on Massage chairs - Market size and forecast 2025-2030 ($ million)
Data Table on Massage chairs - Market size and forecast 2025-2030 ($ million)
Chart on Massage chairs - Year-over-year growth 2025-2030 (%)
Data Table on Massage chairs - Year-over-year growth 2025-2030 (%)

8.4 Back massagers - Market size and forecast 2025-2030

Chart on Back massagers - Market size and forecast 2025-2030 ($ million)
Data Table on Back massagers - Market size and forecast 2025-2030 ($ million)
Chart on Back massagers - Year-over-year growth 2025-2030 (%)
Data Table on Back massagers - Year-over-year growth 2025-2030 (%)

8.5 Neck and shoulder massagers - Market size and forecast 2025-2030

Chart on Neck and shoulder massagers - Market size and forecast 2025-2030 ($ million)
Data Table on Neck and shoulder massagers - Market size and forecast 2025-2030 ($ million)
Chart on Neck and shoulder massagers - Year-over-year growth 2025-2030 (%)
Data Table on Neck and shoulder massagers - Year-over-year growth 2025-2030 (%)

8.6 Others - Market size and forecast 2025-2030

Chart on Others - Market size and forecast 2025-2030 ($ million)
Data Table on Others - Market size and forecast 2025-2030 ($ million)
Chart on Others - Year-over-year growth 2025-2030 (%)
Data Table on Others - Year-over-year growth 2025-2030 (%)

8.7 Market opportunity by Product

Market opportunity by Product ($ million)
Data Table on Market opportunity by Product ($ million)

9. Market Segmentation by End-user

9.1 Market segments

Chart on End-user - Market share 2025-2030 (%)
Data Table on End-user - Market share 2025-2030 (%)

9.2 Comparison by End-user

Chart on Comparison by End-user
Data Table on Comparison by End-user

9.3 Commercial - Market size and forecast 2025-2030

Chart on Commercial - Market size and forecast 2025-2030 ($ million)
Data Table on Commercial - Market size and forecast 2025-2030 ($ million)
Chart on Commercial - Year-over-year growth 2025-2030 (%)
Data Table on Commercial - Year-over-year growth 2025-2030 (%)

9.4 Residential - Market size and forecast 2025-2030

Chart on Residential - Market size and forecast 2025-2030 ($ million)
Data Table on Residential - Market size and forecast 2025-2030 ($ million)
Chart on Residential - Year-over-year growth 2025-2030 (%)
Data Table on Residential - Year-over-year growth 2025-2030 (%)

9.5 Market opportunity by End-user

Market opportunity by End-user ($ million)
Data Table on Market opportunity by End-user ($ million)

10. Market Segmentation by Distribution Channel

10.1 Market segments

Chart on Distribution Channel - Market share 2025-2030 (%)
Data Table on Distribution Channel - Market share 2025-2030 (%)

10.2 Comparison by Distribution Channel

Chart on Comparison by Distribution Channel
Data Table on Comparison by Distribution Channel

10.3 Offline - Market size and forecast 2025-2030

Chart on Offline - Market size and forecast 2025-2030 ($ million)
Data Table on Offline - Market size and forecast 2025-2030 ($ million)
Chart on Offline - Year-over-year growth 2025-2030 (%)
Data Table on Offline - Year-over-year growth 2025-2030 (%)

10.4 Online - Market size and forecast 2025-2030

Chart on Online - Market size and forecast 2025-2030 ($ million)
Data Table on Online - Market size and forecast 2025-2030 ($ million)
Chart on Online - Year-over-year growth 2025-2030 (%)
Data Table on Online - Year-over-year growth 2025-2030 (%)

10.5 Market opportunity by Distribution Channel

Market opportunity by Distribution Channel ($ million)
Data Table on Market opportunity by Distribution Channel ($ million)

11. Market Segmentation by Product Type

11.1 Market segments

Chart on Product Type - Market share 2025-2030 (%)
Data Table on Product Type - Market share 2025-2030 (%)

11.2 Comparison by Product Type

Chart on Comparison by Product Type
Data Table on Comparison by Product Type

11.3 Corded - Market size and forecast 2025-2030

Chart on Corded - Market size and forecast 2025-2030 ($ million)
Data Table on Corded - Market size and forecast 2025-2030 ($ million)
Chart on Corded - Year-over-year growth 2025-2030 (%)
Data Table on Corded - Year-over-year growth 2025-2030 (%)

11.4 Cordless - Market size and forecast 2025-2030

Chart on Cordless - Market size and forecast 2025-2030 ($ million)
Data Table on Cordless - Market size and forecast 2025-2030 ($ million)
Chart on Cordless - Year-over-year growth 2025-2030 (%)
Data Table on Cordless - Year-over-year growth 2025-2030 (%)

11.5 Market opportunity by Product Type

Market opportunity by Product Type ($ million)
Data Table on Market opportunity by Product Type ($ million)

12. Customer Landscape

12.1 Customer landscape overview

Analysis of price sensitivity, lifecycle, customer purchase basket, adoption rates, and purchase criteria

13. Geographic Landscape

13.1 Geographic segmentation

Chart on Market share by geography 2025-2030 (%)
Data Table on Market share by geography 2025-2030 (%)

13.2 Geographic comparison

Chart on Geographic comparison
Data Table on Geographic comparison

13.3 North America - Market size and forecast 2025-2030

Chart on North America - Market size and forecast 2025-2030 ($ million)
Data Table on North America - Market size and forecast 2025-2030 ($ million)
Chart on North America - Year-over-year growth 2025-2030 (%)
Data Table on North America - Year-over-year growth 2025-2030 (%)
Chart on Regional Comparison - North America
Data Table on Regional Comparison - North America

13.3.1 US - Market size and forecast 2025-2030

Chart on US - Market size and forecast 2025-2030 ($ million)
Data Table on US - Market size and forecast 2025-2030 ($ million)
Chart on US - Year-over-year growth 2025-2030 (%)
Data Table on US - Year-over-year growth 2025-2030 (%)

13.3.2 Canada - Market size and forecast 2025-2030

Chart on Canada - Market size and forecast 2025-2030 ($ million)
Data Table on Canada - Market size and forecast 2025-2030 ($ million)
Chart on Canada - Year-over-year growth 2025-2030 (%)
Data Table on Canada - Year-over-year growth 2025-2030 (%)

13.3.3 Mexico - Market size and forecast 2025-2030

Chart on Mexico - Market size and forecast 2025-2030 ($ million)
Data Table on Mexico - Market size and forecast 2025-2030 ($ million)
Chart on Mexico - Year-over-year growth 2025-2030 (%)
Data Table on Mexico - Year-over-year growth 2025-2030 (%)

13.4 Europe - Market size and forecast 2025-2030

Chart on Europe - Market size and forecast 2025-2030 ($ million)
Data Table on Europe - Market size and forecast 2025-2030 ($ million)
Chart on Europe - Year-over-year growth 2025-2030 (%)
Data Table on Europe - Year-over-year growth 2025-2030 (%)
Chart on Regional Comparison - Europe
Data Table on Regional Comparison - Europe

13.4.1 Germany - Market size and forecast 2025-2030

Chart on Germany - Market size and forecast 2025-2030 ($ million)
Data Table on Germany - Market size and forecast 2025-2030 ($ million)
Chart on Germany - Year-over-year growth 2025-2030 (%)
Data Table on Germany - Year-over-year growth 2025-2030 (%)

13.4.2 UK - Market size and forecast 2025-2030

Chart on UK - Market size and forecast 2025-2030 ($ million)
Data Table on UK - Market size and forecast 2025-2030 ($ million)
Chart on UK - Year-over-year growth 2025-2030 (%)
Data Table on UK - Year-over-year growth 2025-2030 (%)

13.4.3 France - Market size and forecast 2025-2030

Chart on France - Market size and forecast 2025-2030 ($ million)
Data Table on France - Market size and forecast 2025-2030 ($ million)
Chart on France - Year-over-year growth 2025-2030 (%)
Data Table on France - Year-over-year growth 2025-2030 (%)

13.4.4 Italy - Market size and forecast 2025-2030

Chart on Italy - Market size and forecast 2025-2030 ($ million)
Data Table on Italy - Market size and forecast 2025-2030 ($ million)
Chart on Italy - Year-over-year growth 2025-2030 (%)
Data Table on Italy - Year-over-year growth 2025-2030 (%)

13.4.5 Spain - Market size and forecast 2025-2030

Chart on Spain - Market size and forecast 2025-2030 ($ million)
Data Table on Spain - Market size and forecast 2025-2030 ($ million)
Chart on Spain - Year-over-year growth 2025-2030 (%)
Data Table on Spain - Year-over-year growth 2025-2030 (%)

13.4.6 The Netherlands - Market size and forecast 2025-2030

Chart on The Netherlands - Market size and forecast 2025-2030 ($ million)
Data Table on The Netherlands - Market size and forecast 2025-2030 ($ million)
Chart on The Netherlands - Year-over-year growth 2025-2030 (%)
Data Table on The Netherlands - Year-over-year growth 2025-2030 (%)

13.5 APAC - Market size and forecast 2025-2030

Chart on APAC - Market size and forecast 2025-2030 ($ million)
Data Table on APAC - Market size and forecast 2025-2030 ($ million)
Chart on APAC - Year-over-year growth 2025-2030 (%)
Data Table on APAC - Year-over-year growth 2025-2030 (%)
Chart on Regional Comparison - APAC
Data Table on Regional Comparison - APAC

13.5.1 China - Market size and forecast 2025-2030

Chart on China - Market size and forecast 2025-2030 ($ million)
Data Table on China - Market size and forecast 2025-2030 ($ million)
Chart on China - Year-over-year growth 2025-2030 (%)
Data Table on China - Year-over-year growth 2025-2030 (%)

13.5.2 Japan - Market size and forecast 2025-2030

Chart on Japan - Market size and forecast 2025-2030 ($ million)
Data Table on Japan - Market size and forecast 2025-2030 ($ million)
Chart on Japan - Year-over-year growth 2025-2030 (%)
Data Table on Japan - Year-over-year growth 2025-2030 (%)

13.5.3 India - Market size and forecast 2025-2030

Chart on India - Market size and forecast 2025-2030 ($ million)
Data Table on India - Market size and forecast 2025-2030 ($ million)
Chart on India - Year-over-year growth 2025-2030 (%)
Data Table on India - Year-over-year growth 2025-2030 (%)

13.5.4 South Korea - Market size and forecast 2025-2030

Chart on South Korea - Market size and forecast 2025-2030 ($ million)
Data Table on South Korea - Market size and forecast 2025-2030 ($ million)
Chart on South Korea - Year-over-year growth 2025-2030 (%)
Data Table on South Korea - Year-over-year growth 2025-2030 (%)

13.5.5 Australia - Market size and forecast 2025-2030

Chart on Australia - Market size and forecast 2025-2030 ($ million)
Data Table on Australia - Market size and forecast 2025-2030 ($ million)
Chart on Australia - Year-over-year growth 2025-2030 (%)
Data Table on Australia - Year-over-year growth 2025-2030 (%)

13.5.6 Indonesia - Market size and forecast 2025-2030

Chart on Indonesia - Market size and forecast 2025-2030 ($ million)
Data Table on Indonesia - Market size and forecast 2025-2030 ($ million)
Chart on Indonesia - Year-over-year growth 2025-2030 (%)
Data Table on Indonesia - Year-over-year growth 2025-2030 (%)

13.6 South America - Market size and forecast 2025-2030

Chart on South America - Market size and forecast 2025-2030 ($ million)
Data Table on South America - Market size and forecast 2025-2030 ($ million)
Chart on South America - Year-over-year growth 2025-2030 (%)
Data Table on South America - Year-over-year growth 2025-2030 (%)
Chart on Regional Comparison - South America
Data Table on Regional Comparison - South America

13.6.1 Brazil - Market size and forecast 2025-2030

Chart on Brazil - Market size and forecast 2025-2030 ($ million)
Data Table on Brazil - Market size and forecast 2025-2030 ($ million)
Chart on Brazil - Year-over-year growth 2025-2030 (%)
Data Table on Brazil - Year-over-year growth 2025-2030 (%)

13.6.2 Argentina - Market size and forecast 2025-2030

Chart on Argentina - Market size and forecast 2025-2030 ($ million)
Data Table on Argentina - Market size and forecast 2025-2030 ($ million)
Chart on Argentina - Year-over-year growth 2025-2030 (%)
Data Table on Argentina - Year-over-year growth 2025-2030 (%)

13.6.3 Chile - Market size and forecast 2025-2030

Chart on Chile - Market size and forecast 2025-2030 ($ million)
Data Table on Chile - Market size and forecast 2025-2030 ($ million)
Chart on Chile - Year-over-year growth 2025-2030 (%)
Data Table on Chile - Year-over-year growth 2025-2030 (%)

13.7 Middle East and Africa - Market size and forecast 2025-2030

Chart on Middle East and Africa - Market size and forecast 2025-2030 ($ million)
Data Table on Middle East and Africa - Market size and forecast 2025-2030 ($ million)
Chart on Middle East and Africa - Year-over-year growth 2025-2030 (%)
Data Table on Middle East and Africa - Year-over-year growth 2025-2030 (%)
Chart on Regional Comparison - Middle East and Africa
Data Table on Regional Comparison - Middle East and Africa

13.7.1 Saudi Arabia - Market size and forecast 2025-2030

Chart on Saudi Arabia - Market size and forecast 2025-2030 ($ million)
Data Table on Saudi Arabia - Market size and forecast 2025-2030 ($ million)
Chart on Saudi Arabia - Year-over-year growth 2025-2030 (%)
Data Table on Saudi Arabia - Year-over-year growth 2025-2030 (%)

13.7.2 UAE - Market size and forecast 2025-2030

Chart on UAE - Market size and forecast 2025-2030 ($ million)
Data Table on UAE - Market size and forecast 2025-2030 ($ million)
Chart on UAE - Year-over-year growth 2025-2030 (%)
Data Table on UAE - Year-over-year growth 2025-2030 (%)

13.7.3 South Africa - Market size and forecast 2025-2030

Chart on South Africa - Market size and forecast 2025-2030 ($ million)
Data Table on South Africa - Market size and forecast 2025-2030 ($ million)
Chart on South Africa - Year-over-year growth 2025-2030 (%)
Data Table on South Africa - Year-over-year growth 2025-2030 (%)

13.7.4 Turkey - Market size and forecast 2025-2030

Chart on Turkey - Market size and forecast 2025-2030 ($ million)
Data Table on Turkey - Market size and forecast 2025-2030 ($ million)
Chart on Turkey - Year-over-year growth 2025-2030 (%)
Data Table on Turkey - Year-over-year growth 2025-2030 (%)

13.7.5 Israel - Market size and forecast 2025-2030

Chart on Israel - Market size and forecast 2025-2030 ($ million)
Data Table on Israel - Market size and forecast 2025-2030 ($ million)
Chart on Israel - Year-over-year growth 2025-2030 (%)
Data Table on Israel - Year-over-year growth 2025-2030 (%)

13.8 Market opportunity by geography

Market opportunity by geography ($ million)
Data Tables on Market opportunity by geography ($ million)

14. Drivers, Challenges, and Opportunity

14.1 Market drivers

Rising global prevalence of musculoskeletal disorders
Surging fitness culture and athletic recovery focus
Rapid consumer adoption of smart home wellness

14.2 Market challenges

Regulatory scrutiny and safety compliance bottlenecks
Proliferation of unregulated counterfeits and price competition
Volatile raw material costs and battery logistics

14.3 Impact of drivers and challenges

Impact of drivers and challenges in 2025 and 2030

14.4 Market opportunities

Commercial integration of AI biometric stress tracking
Expansion of compact portable and travel form factors
Convergence of percussive therapy with contrast temperature

15. Competitive Landscape

15.1 Overview

15.2

Overview on criticality of inputs and factors of differentiation

15.3 Landscape disruption

Overview on factors of disruption

15.4 Industry risks

Impact of key risks on business

16. Competitive Analysis

16.1 Companies profiled

Companies covered

16.2 Company ranking index

16.3 Market positioning of companies

Matrix on companies position and classification

16.4 Beurer GmbH

Beurer GmbH - Overview
Beurer GmbH - Product / Service
Beurer GmbH - Key offerings
SWOT

16.5 Bodyfriend Inc.

Bodyfriend Inc. - Overview
Bodyfriend Inc. - Product / Service
Bodyfriend Inc. - Key offerings
SWOT

16.6 BREO

BREO - Overview
BREO - Product / Service
BREO - Key offerings
SWOT

16.7 Casada International GmbH

Casada International GmbH - Overview
Casada International GmbH - Product / Service
Casada International GmbH - Key offerings
SWOT

16.8 Daiwa Massage

Daiwa Massage - Overview
Daiwa Massage - Product / Service
Daiwa Massage - Key offerings
SWOT

16.9 Fuji Medical Instruments Mfg.

Fuji Medical Instruments Mfg. - Overview
Fuji Medical Instruments Mfg. - Product / Service
Fuji Medical Instruments Mfg. - Key offerings
SWOT

16.10 Homedics USA

Homedics USA - Overview
Homedics USA - Product / Service
Homedics USA - Key offerings
SWOT

16.11 Human Touch LLC

Human Touch LLC - Overview
Human Touch LLC - Product / Service
Human Touch LLC - Key offerings
SWOT

16.12 Hyperice Inc.

Hyperice Inc. - Overview
Hyperice Inc. - Product / Service
Hyperice Inc. - Key offerings
SWOT

16.13 Life Pro Fitness

Life Pro Fitness - Overview
Life Pro Fitness - Product / Service
Life Pro Fitness - Key offerings
SWOT

16.14 medisana GmbH

medisana GmbH - Overview
medisana GmbH - Product / Service
medisana GmbH - Key offerings
SWOT

16.15 Naipo

Naipo - Overview
Naipo - Product / Service
Naipo - Key offerings
SWOT

16.16 OSIM International Pte. Ltd.

OSIM International Pte. Ltd. - Overview
OSIM International Pte. Ltd. - Product / Service
OSIM International Pte. Ltd. - Key offerings
SWOT

16.17 Panasonic Holdings Corp.

Panasonic Holdings Corp. - Overview
Panasonic Holdings Corp. - Business segments
Panasonic Holdings Corp. - Key news
Panasonic Holdings Corp. - Key offerings
Panasonic Holdings Corp. - Segment focus
SWOT

16.18 Renpho Health

Renpho Health - Overview
Renpho Health - Product / Service
Renpho Health - Key offerings
SWOT

17. Appendix

17.1 Scope of the report

Market definition
Objectives
Notes and caveats

17.2 Inclusions and exclusions checklist

Inclusions checklist
Exclusions checklist

17.3 Currency conversion rates for US$

17.4 Research methodology

17.5 Data procurement

Information sources

17.6 Data validation

17.7 Validation techniques employed for market sizing

17.8 Data synthesis

17.9 360 degree market analysis

17.10 List of abbreviations

Research Methodology

Technavio presents a detailed picture of the market by way of study, synthesis, and summation of data from multiple sources. The analysts have presented the various facets of the market with a particular focus on identifying the key industry influencers. The data thus presented is comprehensive, reliable, and the result of extensive research, both primary and secondary.

INFORMATION SOURCES

Primary sources

  • Manufacturers and suppliers
  • Channel partners
  • Industry experts
  • Strategic decision makers

Secondary sources

  • Industry journals and periodicals
  • Government data
  • Financial reports of key industry players
  • Historical data
  • Press releases

DATA ANALYSIS

Data Synthesis

  • Collation of data
  • Estimation of key figures
  • Analysis of derived insights

Data Validation

  • Triangulation with data models
  • Reference against proprietary databases
  • Corroboration with industry experts

REPORT WRITING

Qualitative

  • Market drivers
  • Market challenges
  • Market trends
  • Five forces analysis

Quantitative

  • Market size and forecast
  • Market segmentation
  • Geographical insights
  • Competitive landscape

Interested in this report?

Get your sample now to see our research methodology and insights!

Download Now

Frequently Asked Questions

Electric Massager market growth will increase by USD 3107.5 million during 2026-2030.

The Electric Massager market is expected to grow at a CAGR of 9.6% during 2026-2030.

Electric Massager market is segmented by Product (Massage chairs, Back massagers, Neck and shoulder massagers, Others) End-user (Commercial, Residential) Distribution channel (Offline, Online) Product type (Corded, Cordless)

Beurer GmbH, Bodyfriend Inc., BREO, Casada International GmbH, Daiwa Massage, Fuji Medical Instruments Mfg., Homedics USA, Human Touch LLC, Hyperice Inc., Life Pro Fitness, medisana GmbH, Naipo, OSIM International Pte. Ltd., Panasonic Holdings Corp., Renpho Health, SKG, Therabody Inc., Zyllion Inc. are a few of the key vendors in the Electric Massager market.

North America will register the highest growth rate of 37.6% among the other regions. Therefore, the Electric Massager market in North America is expected to garner significant business opportunities for the vendors during the forecast period.

US, Canada, Mexico, Germany, UK, France, Italy, Spain, The Netherlands, China, Japan, India, South Korea, Australia, Indonesia, Brazil, Argentina, Chile, Saudi Arabia, UAE, South Africa, Turkey, Israel

  • Rising global prevalence of musculoskeletal disorders is the driving factor this market.

The Electric Massager market vendors should focus on grabbing business opportunities from the Product segment as it accounted for the largest market share in the base year.
RIA - Research AI Assistant
Ask RIA
