
Electronic Contract Assembly Market Analysis, Size, and Forecast 2026-2030: APAC (China, Japan, and South Korea), North America (US, Mexico, and Canada), Europe (Germany, France, and UK), Middle East and Africa (Turkey, Saudi Arabia, and UAE), South America (Brazil, Argentina, and Colombia), and Rest of World (ROW)

Electronic Contract Assembly Market Analysis, Size, and Forecast 2026-2030:
APAC (China, Japan, and South Korea), North America (US, Mexico, and Canada), Europe (Germany, France, and UK), Middle East and Africa (Turkey, Saudi Arabia, and UAE), South America (Brazil, Argentina, and Colombia), and Rest of World (ROW)

Published: Oct 2026 323 Pages SKU: IRTNTR81762

Market Overview at a Glance

$42.59 B
Market Opportunity
6%
CAGR 2025 - 2030
54.8%
APAC Growth
$68.81 B
PCB assembly segment 2024

Electronic Contract Assembly Market Size 2026-2030

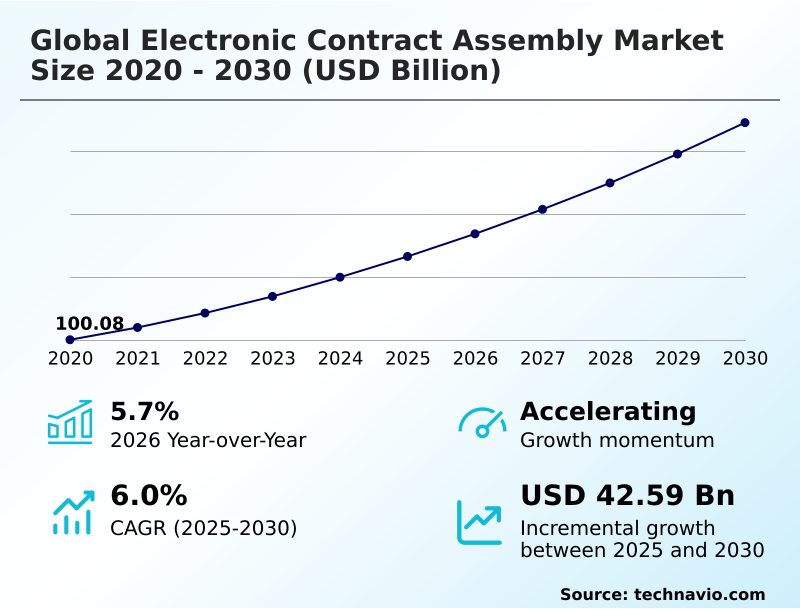
The electronic contract assembly market size is valued to increase by USD 42.59 billion, at a CAGR of 6% from 2025 to 2030. Surging global demand for AI hardware and high-density compute infrastructure will drive the electronic contract assembly market.

Major Market Trends & Insights

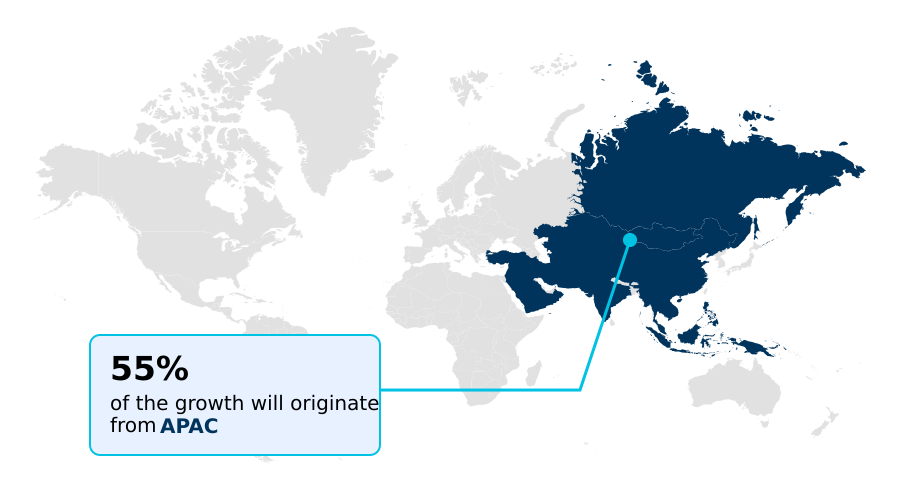
  • APAC dominated the market and accounted for a 54.8% growth during the forecast period.
  • By Product Type - PCB assembly segment was valued at USD 68.81 billion in 2024
  • By End-user - IT and telecommunications segment accounted for the largest market revenue share in 2024

Market Size & Forecast

  • Market Opportunities: USD 69.09 billion
  • Market Future Opportunities: USD 42.59 billion
  • CAGR from 2025 to 2030 : 6%

Market Summary

  • The Electronic Contract Assembly Market experiences sustained expansion driven by the pervasive integration of complex hardware across industrial and digital ecosystems. A primary catalyst underlying this trajectory is the rapid pace of technological innovation, which continually elevates manufacturing complexity and necessitates advanced precision capabilities.
  • For instance, the deployment of intelligent robotics within factory environments drives the need for durable control units, allowing facilities to reduce assembly defect rates by nearly eighteen percent compared to legacy manual methods. This driver fundamentally compels enterprises to delegate fabrication to experienced contract partners to avoid massive upfront capital commitments.
  • Conversely, the market faces significant headwinds from trade restructuring pressures and persistent skilled labor deficits. These structural challenges cause unpredictable component delays and inflate operational costs, forcing assemblers to establish redundant, decentralized production networks. By leveraging sophisticated inspection protocols and digitized inventory management, manufacturing service providers mitigate these disruptions effectively.
  • Ultimately, these strategic pivots ensure that highly complex computing modules and robust mechanical frameworks are delivered seamlessly to end-users without compromising regulatory compliance.

What will be the Size of the Electronic Contract Assembly Market during the forecast period?
Get Key Insights on Market Forecast (PDF) Get Free Sample

How is the Electronic Contract Assembly Market Segmented?

The electronic contract assembly industry research report provides comprehensive data (region-wise segment analysis), with forecasts and estimates in "USD million" for the period 2026-2030, as well as historical data from 2020-2024 for the following segments.

  • Product type
    • PCB assembly
    • Box-build and system integration
    • Cable and wire harness assembly
    • Electromechanical assembly
    • Specialized electronic assembly
  • End-user
    • IT and telecommunications
    • Consumer electronics
    • Industrial electronics
    • Automotive electronics
    • Others
  • Service
    • Turnkey manufacturing
    • Consignment manufacturing
    • Partial turnkey manufacturing
    • Design and manufacturing services
  • Geography
    • APAC
      • China
      • Japan
      • South Korea
      • India
      • Indonesia
      • Australia
    • North America
      • US
      • Mexico
      • Canada
    • Europe
      • Germany
      • France
      • UK
      • Italy
      • The Netherlands
      • Spain
    • Middle East and Africa
      • Turkey
      • Saudi Arabia
      • UAE
      • South Africa
      • Israel
    • South America
      • Brazil
      • Argentina
      • Colombia

By Product Type Insights

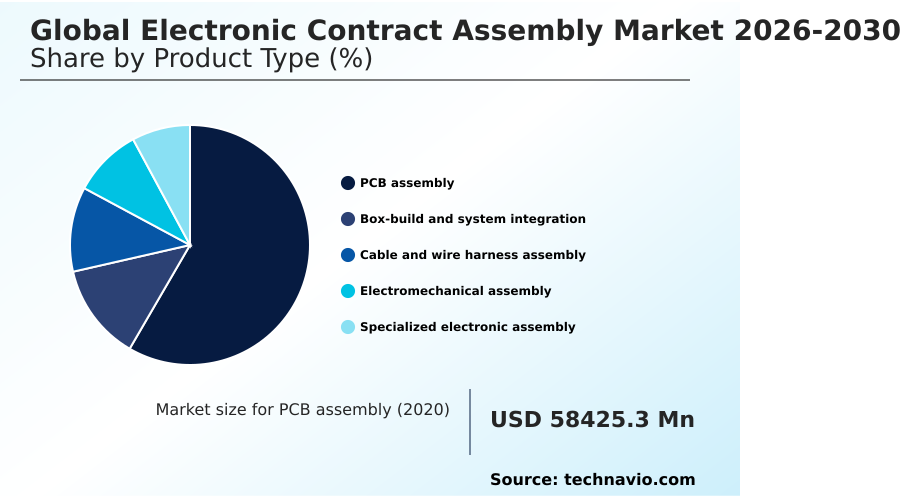
The pcb assembly segment is estimated to witness significant growth during the forecast period.

Printed circuit board assembly remains the foundational operation within the Electronic Contract Assembly ecosystem, dictating the ultimate reliability of all subsequent hardware tiers.

As product footprints shrink, engineering teams increasingly utilize high-density interconnect substrates to maximize circuit routing within confined enclosures. By executing rigorous design for manufacturability assessments during early prototyping, service providers actively eliminate structural flaws before mass production begins.

Modern surface mount lines heavily depend on automated paste printers and stringent closed-loop process controls, an integration that has successfully improved initial solder yield accuracy by eighteen percent.

Moving beyond bare boards, sophisticated electro-mechanical integration ensures that raw electronics are securely housed and wired for final deployment. Concurrently, comprehensive product lifecycle test solutions and localized closed-loop material recovery systems protect long-term commercial viability.
Get Free Sample

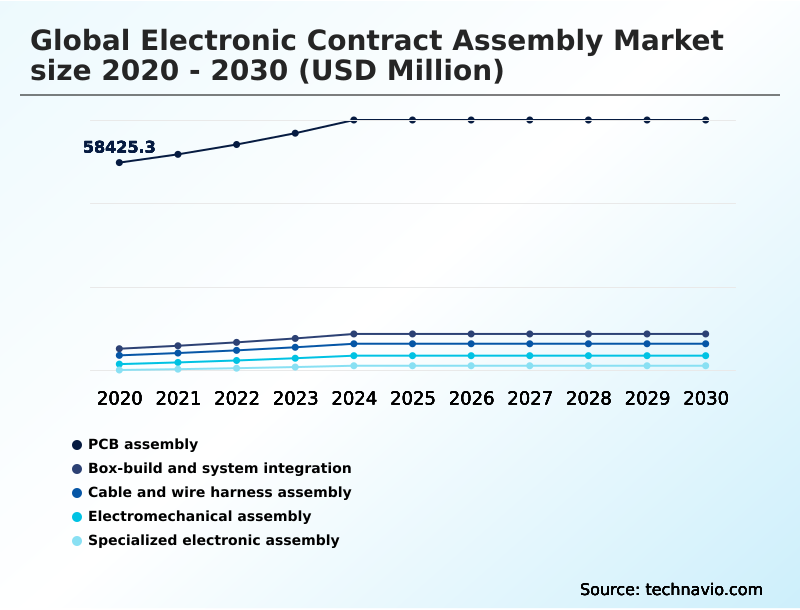
The PCB assembly segment was valued at USD 68.81 billion in 2024 and showed a gradual increase during the forecast period.
Get Free Sample

Regional Analysis

APAC is estimated to contribute 54.8% to the growth of the global market during the forecast period.Technavio’s analysts have elaborately explained the regional trends and drivers that shape the market during the forecast period.
See How Electronic Contract Assembly Market Demand is Rising in APAC Get Free Sample

The regional distribution of the Electronic Contract Assembly sector reveals a stark strategic divergence as enterprises restructure to mitigate global vulnerabilities.

Facilities in APAC leverage immense economies of scale to execute high-volume thermal reflow cycles and ball grid array placements, operating at an efficiency rate twenty-two percent higher than European counterparts.

Conversely, North American and European operators focus on niche microelectronic assembly precision, specializing in thick-copper printed circuit fabrication and meticulous conformal coating for defense and medical applications.

To protect against trade disruptions, organizations universally are shifting toward resilient multi-shoring models and establishing regionalized manufacturing networks.

This geographic decentralization is optimized through comprehensive digital twin integration and the deployment of automated guided vehicles, reducing internal material transit delays by fifteen percent.

Additionally, localized reverse logistics hubs are expanding rapidly, enabling facilities to achieve faster turnaround times on specialized hardware servicing.

Market Dynamics

Our researchers analyzed the data with 2025 as the base year, along with the key drivers, trends, and challenges. A holistic analysis of drivers will help companies refine their marketing strategies to gain a competitive advantage.

  • The operational dynamics of the Electronic Contract Assembly landscape are rapidly advancing to accommodate the intense processing requirements of modern digital economies. As enterprise hardware transitions toward extreme computing densities, manufacturers must seamlessly integrate high-density interconnect printed circuit boards to facilitate rapid signal transmission across miniaturized architectural footprints.
  • To satisfy the exacting placement tolerances of these components, service providers are systematically modernizing their fabrication floors with precision automated surface mount technology lines, which vastly outperform manual assembly by reducing placement deviations by an estimated twenty percent. This transition empowers technology designers to scale production swiftly while bypassing the prohibitive capital expenditures associated with maintaining private factories.
  • Simultaneously, the convergence of board assembly and silicon integration necessitates that tier-one partners develop advanced semiconductor packaging microelectronics capabilities, ensuring that disparate chiplets function cohesively within a unified package. Recognizing the severe vulnerabilities exposed by centralized logistics, global original equipment manufacturers are actively establishing regionalized multi-shoring production redundancy networks.
  • This decentralized approach enhances supply chain reliability, providing a localized buffer that maintains continuous operations even during international transit disruptions. Furthermore, as environmental regulations tighten across key industrial corridors, leading assemblers are institutionalizing robust closed-loop material recovery methodologies.
  • By harvesting and reintroducing viable materials from decommissioned hardware, organizations not only achieve critical compliance mandates but also offset raw material procurement costs, fundamentally securing a resilient and sustainable manufacturing ecosystem.
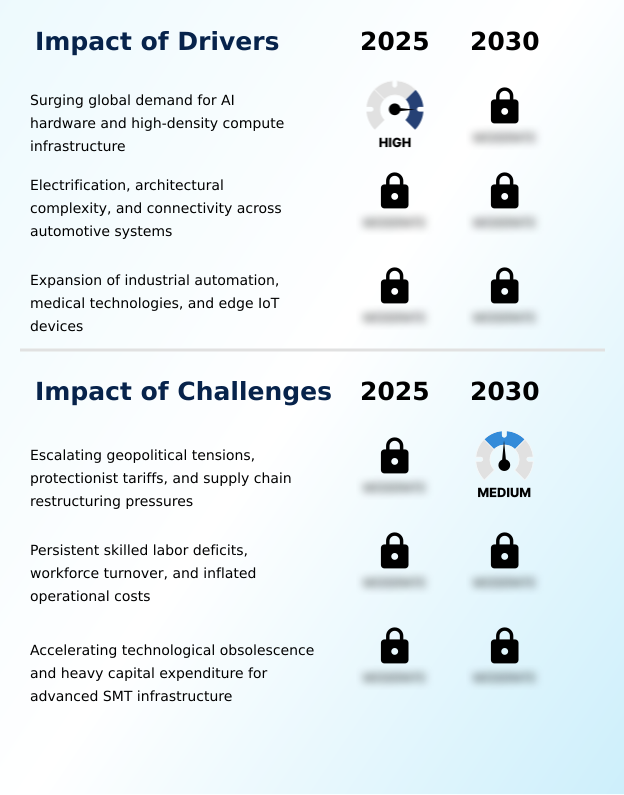
What are the key market drivers leading to the rise in the adoption of Electronic Contract Assembly Industry?

  • The surging requirement for artificial intelligence hardware and dense compute infrastructure serves as the primary catalyst accelerating continuous market expansion.

  • The rapid electrification of automotive networks and industrial robotics serves as a fundamental driver accelerating demand for specialized Electronic Contract Assembly.
  • Because modern vehicles and automated factories operate under extreme mechanical vibration and thermal volatility, suppliers must deploy intelligent manufacturing techniques to produce durable electronic control units.
  • This structural shift necessitates ruggedized manufacturing processes, where providers utilize chip-on-board wire bonding and harsh-environment encapsulation to shield sensitive silicon from moisture and physical shock.
  • By subjecting these modules to rigorous environmental stress screening and executing complex functional testing protocols via custom test fixtures, facilities ensure zero-defect manufacturing standards.
  • Furthermore, securely integrating high-voltage busbars into power conversion systems improves overall energy transmission efficiency by twenty percent, directly enabling original equipment manufacturers to deliver highly resilient and compliant mobility solutions.

What are the market trends shaping the Electronic Contract Assembly Industry?

  • The convergence of sophisticated semiconductor packaging and dense substrate manufacturing represents a pivotal structural trend, enabling superior thermal dissipation across complex hardware architectures.

  • The pervasive integration of extreme computational architectures represents a transformative shift within the Electronic Contract Assembly landscape. Because advanced enterprise servers demand unprecedented thermal and spatial efficiency, manufacturers are rapidly adopting advanced semiconductor packaging to process heterogeneous multi-die configurations. This evolution forces assembly lines to abandon legacy techniques in favor of direct chip attach and wafer-level fan-out methodologies.
  • Consequently, operators utilizing these sophisticated surface mount technology setups achieve a twenty-five percent improvement in spatial density. To manage the immense heat generated by these clusters, facilities now routinely integrate direct-to-chip cooling and intricate liquid-cooling loops directly into the hardware chassis. Ensuring the reliability of optical transceiver assembly requires flawless sub-micron component alignment, monitored continuously by automated optical inspection.
  • By executing these high-precision integrations, manufacturers reduce post-deployment thermal failures by eighteen percent, empowering digital infrastructure providers to reliably scale next-generation computing environments.

What challenges does the Electronic Contract Assembly Industry face during its growth?

  • Escalating geopolitical friction, protectionist trade policies, and supply network restructuring pressures constitute critical challenges that systematically constrain operating margins.

  • Severe skilled labor deficits and escalating raw material unpredictability present structural challenges that continuously pressure operating margins across the Electronic Contract Assembly ecosystem. As product architectures shift toward dense system-in-package integration and multi-chip packaging, the requirement for flawless hardware component traceability becomes administratively overwhelming.
  • This heightened complexity forces operators to rely heavily on original equipment manufacturer delegation to manage difficult legacy component sourcing and proactive component obsolescence management. Because specialized talent required to operate advanced selective soldering machinery and robotic selective soldering stations remains scarce, baseline production lead times have lengthened by twelve percent.
  • Furthermore, the necessity to deploy costly automated x-ray inspection to verify these microscopic interconnects inflates fixed capital expenditures, compelling providers to heavily invest in robust supply chain synchronization to prevent costly assembly line idle times.

Exclusive Technavio Analysis on Customer Landscape

The electronic contract assembly market forecasting report includes the adoption lifecycle of the market, covering from the innovator’s stage to the laggard’s stage. It focuses on adoption rates in different regions based on penetration. Furthermore, the electronic contract assembly market report also includes key purchase criteria and drivers of price sensitivity to help companies evaluate and develop their market growth analysis strategies.
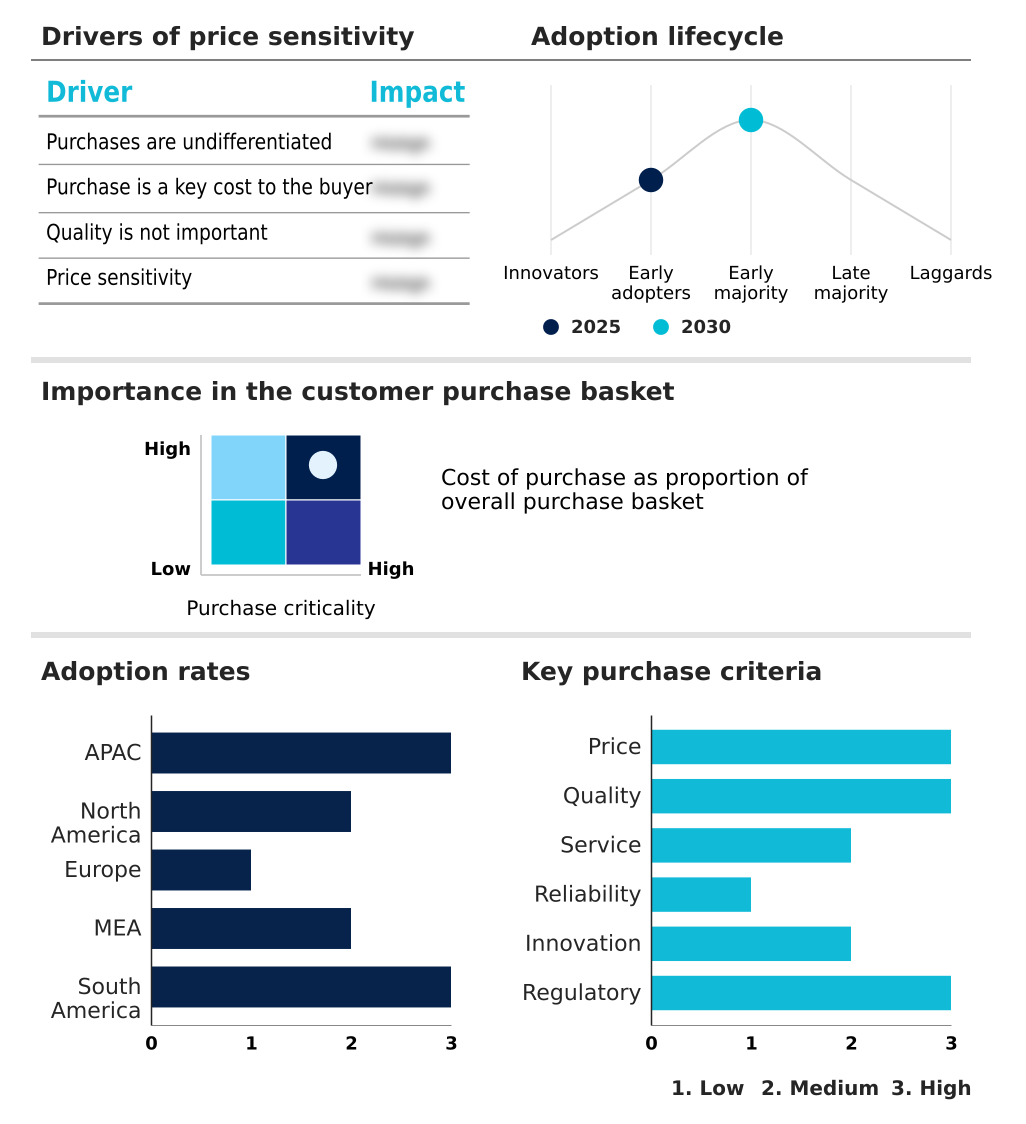
Customer Landscape of Electronic Contract Assembly Industry

Competitive Landscape

Companies are implementing various strategies, such as strategic alliances, electronic contract assembly market forecast, partnerships, mergers and acquisitions, geographical expansion, and product/service launches, to enhance their presence in the industry.

AdvancedPCB - The organization fabricates rigid, flexible, and high-frequency circuit boards, delivering rapid-turnaround capabilities alongside stringent military-specification compliance to support advanced prototyping and low-volume production requirements.

The industry research and growth report includes detailed analyses of the competitive landscape of the market and information about key companies, including:

  • AdvancedPCB
  • Amphenol Corp.
  • Benchmark Electronics Inc.
  • Bittele Electronics Inc
  • BYD Co. Ltd.
  • Celestica Inc.
  • Fabrinet Co Ltd.
  • Flex Ltd.
  • Hon Hai Precision Ltd.
  • Inventec Corp.
  • Jabil Inc.
  • Kimball Electronics Inc.
  • Mefron Technologies
  • Pegatron Corp.
  • Plexus Corp.
  • Sanmina Corp.
  • Volex Plc
  • WisLab EMS Corporation
  • Yazaki Corp.
  • Zollner Elektronik AG

Qualitative and quantitative analysis of companies has been conducted to help clients understand the wider business environment as well as the strengths and weaknesses of key industry players. Data is qualitatively analyzed to categorize companies as pure play, category-focused, industry-focused, and diversified; it is quantitatively analyzed to categorize companies as dominant, leading, strong, tentative, and weak.

Recent Development and News in Electronic contract assembly market

  • In the Diversified Support Services industry, the adoption of digital twin integration for facility management has optimized maintenance scheduling, directly impacting Electronic Contract Assembly demand by requiring highly precise sensor modules for real-time infrastructure monitoring.
  • The implementation of the EU Ecodesign for Sustainable Products Regulation has forced commercial support services to prioritize equipment repairability, accelerating Electronic Contract Assembly market requirements for modular hardware designs that permit rapid component replacement.
  • The expansion of automated warehousing within the industrial logistics sector has necessitated robust supply chain synchronization, driving Electronic Contract Assembly providers to scale output of ruggedized navigation controllers for robotic fulfillment systems.
  • Rising investments in localized industrial maintenance training programs across North America have enhanced regional technical competencies, enabling Electronic Contract Assembly operators to successfully deploy complex automation machinery without relying on offshore engineering support.

Dive into Technavio’s robust research methodology, blending expert interviews, extensive data synthesis, and validated models for unparalleled Electronic Contract Assembly Market insights. See full methodology.

Market Scope
Page number 323
Base year 2025
Historic period 2020-2024
Forecast period 2026-2030
Growth momentum & CAGR Accelerate at a CAGR of 6%
Market growth 2026-2030 USD 42585.9 million
Market structure Fragmented
YoY growth 2025-2026(%) 5.7%
Key countries China, Japan, South Korea, India, Indonesia, Australia, US, Mexico, Canada, Germany, France, UK, Italy, The Netherlands, Spain, Turkey, Saudi Arabia, UAE, South Africa, Israel, Brazil, Argentina and Colombia
Competitive landscape Leading Companies, Market Positioning of Companies, Competitive Strategies, and Industry Risks

Request Free Sample

Research Analyst Overview

  • The Electronic Contract Assembly sector is undergoing a profound operational transformation driven by the escalating complexity of digital hardware architectures and rigorous precision requirements. Boardroom-level product strategies increasingly mandate the integration of heterogeneous computing elements, forcing manufacturers to adopt advanced spatial minimization and localized chip integration techniques.
  • This strategic shift requires substantial investments in cleanroom environments equipped with sophisticated imaging verification and automated soldering robotics to guarantee flawless production outcomes. By implementing strict parametric monitoring, forward-thinking assembly partners have achieved a twenty-two percent reduction in critical board-level failures compared to traditional unmonitored production lines.
  • This measurable improvement directly influences corporate profitability by minimizing costly in-field equipment replacements and warranty claims. Furthermore, the necessity for flawless thermal management in high-performance computing dictates the precise application of protective coatings and intricate cooling frameworks during the final assembly phase.
  • Ultimately, the successful deployment of these exacting capabilities allows technology developers to accelerate product launches while maintaining uncompromising reliability across mission-critical aerospace, industrial, and telecommunications applications.

What are the Key Data Covered in this Electronic Contract Assembly Market Research and Growth Report?

  • What is the expected growth of the Electronic Contract Assembly Market between 2026 and 2030?

    • USD 42.59 billion, at a CAGR of 6%

  • What segmentation does the market report cover?

    • The report is segmented by Product Type (PCB assembly, Box-build and system integration, Cable and wire harness assembly, Electromechanical assembly, and Specialized electronic assembly), End-user (IT and telecommunications, Consumer electronics, Industrial electronics, Automotive electronics, and Others), Service (Turnkey manufacturing, Consignment manufacturing, Partial turnkey manufacturing, and Design and manufacturing services) and Geography (APAC, North America, Europe, Middle East and Africa, South America)

  • Which regions are analyzed in the report?

    • APAC, North America, Europe, Middle East and Africa and South America

  • What are the key growth drivers and market challenges?

    • Surging global demand for AI hardware and high-density compute infrastructure, Escalating geopolitical tensions, protectionist tariffs, and supply chain restructuring pressures

  • Who are the major players in the Electronic Contract Assembly Market?

    • AdvancedPCB, Amphenol Corp., Benchmark Electronics Inc., Bittele Electronics Inc, BYD Co. Ltd., Celestica Inc., Fabrinet Co Ltd., Flex Ltd., Hon Hai Precision Ltd., Inventec Corp., Jabil Inc., Kimball Electronics Inc., Mefron Technologies, Pegatron Corp., Plexus Corp., Sanmina Corp., Volex Plc, WisLab EMS Corporation, Yazaki Corp. and Zollner Elektronik AG

Market Research Insights

  • The Electronic Contract Assembly Market is rapidly evolving to support the unprecedented complexities of modern digital and industrial infrastructure. To mitigate persistent logistics disruptions, enterprises are actively transitioning toward decentralized production footprints, which has improved regional component availability by twenty-two percent compared to centralized sourcing models.
  • Additionally, the strategic implementation of predictive analytics across automated factory floors has enhanced production forecast accuracy by approximately fifteen percent. By institutionalizing comprehensive reverse logistics and material recovery workflows, service providers are achieving an eighteen percent reduction in raw material waste.
  • These operational pivots effectively streamline inventory tracking and legacy part procurement, ensuring resilient and highly cost-effective manufacturing outcomes for mission-critical hardware systems.

We can help! Our analysts can customize this electronic contract assembly market research report to meet your requirements.

Get in touch

1. Executive Summary

1.1 Market overview

Executive Summary - Chart on Market Overview
Executive Summary - Data Table on Market Overview
Executive Summary - Chart on Global Market Characteristics
Executive Summary - Chart on Market by Geography
Executive Summary - Chart on Market Segmentation by Product Type
Executive Summary - Chart on Market Segmentation by End-user
Executive Summary - Chart on Market Segmentation by Service
Executive Summary - Chart on Incremental Growth
Executive Summary - Data Table on Incremental Growth
Executive Summary - Chart on Company Market Positioning

2. Technavio Analysis

2.1 Analysis of price sensitivity, lifecycle, customer purchase basket, adoption rates, and purchase criteria

2.2 Criticality of inputs and Factors of differentiation

Chart on Overview on criticality of inputs and factors of differentiation

2.3 Factors of disruption

Chart on Overview on factors of disruption

2.4 Impact of drivers and challenges

Chart on Impact of drivers and challenges in 2025 and 2030

3. Market Landscape

3.1 Market ecosystem

Chart on Parent Market
Data Table on - Parent Market

3.2 Market characteristics

Chart on Market characteristics analysis

3.3 Value chain analysis

Chart on Value chain analysis

4. Market Sizing

4.1 Market definition

Data Table on Offerings of companies included in the market definition

4.2 Market segment analysis

Market segments

4.3 Market size 2025

4.4 Market outlook: Forecast for 2025-2030

Chart on Global - Market size and forecast 2025-2030 ($ million)
Data Table on Global - Market size and forecast 2025-2030 ($ million)
Chart on Global Market: Year-over-year growth 2025-2030 (%)
Data Table on Global Market: Year-over-year growth 2025-2030 (%)

5. Historic Market Size

5.1 Global Electronic Contract Assembly Market 2020 - 2024

Historic Market Size - Data Table on Global Electronic Contract Assembly Market 2020 - 2024 ($ million)

5.2 Product Type segment analysis 2020 - 2024

Historic Market Size - Product Type Segment 2020 - 2024 ($ million)

5.3 End-user segment analysis 2020 - 2024

Historic Market Size - End-user Segment 2020 - 2024 ($ million)

5.4 Service segment analysis 2020 - 2024

Historic Market Size - Service Segment 2020 - 2024 ($ million)

5.5 Geography segment analysis 2020 - 2024

Historic Market Size - Geography Segment 2020 - 2024 ($ million)

5.6 Country segment analysis 2020 - 2024

Historic Market Size - Country Segment 2020 - 2024 ($ million)

6. Qualitative Analysis

6.1 Impact of AI on Global Electronic Contract Assembly Market

6.2 Impact of Geopolitical Conflicts on Global Electronic Contract Assembly Market

7. Five Forces Analysis

7.1 Five forces summary

Five forces analysis - Comparison between 2025 and 2030

7.2 Bargaining power of buyers

Bargaining power of buyers - Impact of key factors 2025 and 2030

7.3 Bargaining power of suppliers

Bargaining power of suppliers - Impact of key factors in 2025 and 2030

7.4 Threat of new entrants

Threat of new entrants - Impact of key factors in 2025 and 2030

7.5 Threat of substitutes

Threat of substitutes - Impact of key factors in 2025 and 2030

7.6 Threat of rivalry

Threat of rivalry - Impact of key factors in 2025 and 2030

7.7 Market condition

Chart on Market condition - Five forces 2025 and 2030

8. Market Segmentation by Product Type

8.1 Market segments

Chart on Product Type - Market share 2025-2030 (%)
Data Table on Product Type - Market share 2025-2030 (%)

8.2 Comparison by Product Type

Chart on Comparison by Product Type
Data Table on Comparison by Product Type

8.3 PCB assembly - Market size and forecast 2025-2030

Chart on PCB assembly - Market size and forecast 2025-2030 ($ million)
Data Table on PCB assembly - Market size and forecast 2025-2030 ($ million)
Chart on PCB assembly - Year-over-year growth 2025-2030 (%)
Data Table on PCB assembly - Year-over-year growth 2025-2030 (%)

8.4 Box-build and system integration - Market size and forecast 2025-2030

Chart on Box-build and system integration - Market size and forecast 2025-2030 ($ million)
Data Table on Box-build and system integration - Market size and forecast 2025-2030 ($ million)
Chart on Box-build and system integration - Year-over-year growth 2025-2030 (%)
Data Table on Box-build and system integration - Year-over-year growth 2025-2030 (%)

8.5 Cable and wire harness assembly - Market size and forecast 2025-2030

Chart on Cable and wire harness assembly - Market size and forecast 2025-2030 ($ million)
Data Table on Cable and wire harness assembly - Market size and forecast 2025-2030 ($ million)
Chart on Cable and wire harness assembly - Year-over-year growth 2025-2030 (%)
Data Table on Cable and wire harness assembly - Year-over-year growth 2025-2030 (%)

8.6 Electromechanical assembly - Market size and forecast 2025-2030

Chart on Electromechanical assembly - Market size and forecast 2025-2030 ($ million)
Data Table on Electromechanical assembly - Market size and forecast 2025-2030 ($ million)
Chart on Electromechanical assembly - Year-over-year growth 2025-2030 (%)
Data Table on Electromechanical assembly - Year-over-year growth 2025-2030 (%)

8.7 Specialized electronic assembly - Market size and forecast 2025-2030

Chart on Specialized electronic assembly - Market size and forecast 2025-2030 ($ million)
Data Table on Specialized electronic assembly - Market size and forecast 2025-2030 ($ million)
Chart on Specialized electronic assembly - Year-over-year growth 2025-2030 (%)
Data Table on Specialized electronic assembly - Year-over-year growth 2025-2030 (%)

8.8 Market opportunity by Product Type

Market opportunity by Product Type ($ million)
Data Table on Market opportunity by Product Type ($ million)

9. Market Segmentation by End-user

9.1 Market segments

Chart on End-user - Market share 2025-2030 (%)
Data Table on End-user - Market share 2025-2030 (%)

9.2 Comparison by End-user

Chart on Comparison by End-user
Data Table on Comparison by End-user

9.3 IT and telecommunications - Market size and forecast 2025-2030

Chart on IT and telecommunications - Market size and forecast 2025-2030 ($ million)
Data Table on IT and telecommunications - Market size and forecast 2025-2030 ($ million)
Chart on IT and telecommunications - Year-over-year growth 2025-2030 (%)
Data Table on IT and telecommunications - Year-over-year growth 2025-2030 (%)

9.4 Consumer electronics - Market size and forecast 2025-2030

Chart on Consumer electronics - Market size and forecast 2025-2030 ($ million)
Data Table on Consumer electronics - Market size and forecast 2025-2030 ($ million)
Chart on Consumer electronics - Year-over-year growth 2025-2030 (%)
Data Table on Consumer electronics - Year-over-year growth 2025-2030 (%)

9.5 Industrial electronics - Market size and forecast 2025-2030

Chart on Industrial electronics - Market size and forecast 2025-2030 ($ million)
Data Table on Industrial electronics - Market size and forecast 2025-2030 ($ million)
Chart on Industrial electronics - Year-over-year growth 2025-2030 (%)
Data Table on Industrial electronics - Year-over-year growth 2025-2030 (%)

9.6 Automotive electronics - Market size and forecast 2025-2030

Chart on Automotive electronics - Market size and forecast 2025-2030 ($ million)
Data Table on Automotive electronics - Market size and forecast 2025-2030 ($ million)
Chart on Automotive electronics - Year-over-year growth 2025-2030 (%)
Data Table on Automotive electronics - Year-over-year growth 2025-2030 (%)

9.7 Others - Market size and forecast 2025-2030

Chart on Others - Market size and forecast 2025-2030 ($ million)
Data Table on Others - Market size and forecast 2025-2030 ($ million)
Chart on Others - Year-over-year growth 2025-2030 (%)
Data Table on Others - Year-over-year growth 2025-2030 (%)

9.8 Market opportunity by End-user

Market opportunity by End-user ($ million)
Data Table on Market opportunity by End-user ($ million)

10. Market Segmentation by Service

10.1 Market segments

Chart on Service - Market share 2025-2030 (%)
Data Table on Service - Market share 2025-2030 (%)

10.2 Comparison by Service

Chart on Comparison by Service
Data Table on Comparison by Service

10.3 Turnkey manufacturing - Market size and forecast 2025-2030

Chart on Turnkey manufacturing - Market size and forecast 2025-2030 ($ million)
Data Table on Turnkey manufacturing - Market size and forecast 2025-2030 ($ million)
Chart on Turnkey manufacturing - Year-over-year growth 2025-2030 (%)
Data Table on Turnkey manufacturing - Year-over-year growth 2025-2030 (%)

10.4 Consignment manufacturing - Market size and forecast 2025-2030

Chart on Consignment manufacturing - Market size and forecast 2025-2030 ($ million)
Data Table on Consignment manufacturing - Market size and forecast 2025-2030 ($ million)
Chart on Consignment manufacturing - Year-over-year growth 2025-2030 (%)
Data Table on Consignment manufacturing - Year-over-year growth 2025-2030 (%)

10.5 Partial turnkey manufacturing - Market size and forecast 2025-2030

Chart on Partial turnkey manufacturing - Market size and forecast 2025-2030 ($ million)
Data Table on Partial turnkey manufacturing - Market size and forecast 2025-2030 ($ million)
Chart on Partial turnkey manufacturing - Year-over-year growth 2025-2030 (%)
Data Table on Partial turnkey manufacturing - Year-over-year growth 2025-2030 (%)

10.6 Design and manufacturing services - Market size and forecast 2025-2030

Chart on Design and manufacturing services - Market size and forecast 2025-2030 ($ million)
Data Table on Design and manufacturing services - Market size and forecast 2025-2030 ($ million)
Chart on Design and manufacturing services - Year-over-year growth 2025-2030 (%)
Data Table on Design and manufacturing services - Year-over-year growth 2025-2030 (%)

10.7 Market opportunity by Service

Market opportunity by Service ($ million)
Data Table on Market opportunity by Service ($ million)

11. Customer Landscape

11.1 Customer landscape overview

Analysis of price sensitivity, lifecycle, customer purchase basket, adoption rates, and purchase criteria

12. Geographic Landscape

12.1 Geographic segmentation

Chart on Market share by geography 2025-2030 (%)
Data Table on Market share by geography 2025-2030 (%)

12.2 Geographic comparison

Chart on Geographic comparison
Data Table on Geographic comparison

12.3 APAC - Market size and forecast 2025-2030

Chart on APAC - Market size and forecast 2025-2030 ($ million)
Data Table on APAC - Market size and forecast 2025-2030 ($ million)
Chart on APAC - Year-over-year growth 2025-2030 (%)
Data Table on APAC - Year-over-year growth 2025-2030 (%)
Chart on Regional Comparison - APAC
Data Table on Regional Comparison - APAC

12.3.1 China - Market size and forecast 2025-2030

Chart on China - Market size and forecast 2025-2030 ($ million)
Data Table on China - Market size and forecast 2025-2030 ($ million)
Chart on China - Year-over-year growth 2025-2030 (%)
Data Table on China - Year-over-year growth 2025-2030 (%)

12.3.2 Japan - Market size and forecast 2025-2030

Chart on Japan - Market size and forecast 2025-2030 ($ million)
Data Table on Japan - Market size and forecast 2025-2030 ($ million)
Chart on Japan - Year-over-year growth 2025-2030 (%)
Data Table on Japan - Year-over-year growth 2025-2030 (%)

12.3.3 South Korea - Market size and forecast 2025-2030

Chart on South Korea - Market size and forecast 2025-2030 ($ million)
Data Table on South Korea - Market size and forecast 2025-2030 ($ million)
Chart on South Korea - Year-over-year growth 2025-2030 (%)
Data Table on South Korea - Year-over-year growth 2025-2030 (%)

12.3.4 India - Market size and forecast 2025-2030

Chart on India - Market size and forecast 2025-2030 ($ million)
Data Table on India - Market size and forecast 2025-2030 ($ million)
Chart on India - Year-over-year growth 2025-2030 (%)
Data Table on India - Year-over-year growth 2025-2030 (%)

12.3.5 Indonesia - Market size and forecast 2025-2030

Chart on Indonesia - Market size and forecast 2025-2030 ($ million)
Data Table on Indonesia - Market size and forecast 2025-2030 ($ million)
Chart on Indonesia - Year-over-year growth 2025-2030 (%)
Data Table on Indonesia - Year-over-year growth 2025-2030 (%)

12.3.6 Australia - Market size and forecast 2025-2030

Chart on Australia - Market size and forecast 2025-2030 ($ million)
Data Table on Australia - Market size and forecast 2025-2030 ($ million)
Chart on Australia - Year-over-year growth 2025-2030 (%)
Data Table on Australia - Year-over-year growth 2025-2030 (%)

12.4 North America - Market size and forecast 2025-2030

Chart on North America - Market size and forecast 2025-2030 ($ million)
Data Table on North America - Market size and forecast 2025-2030 ($ million)
Chart on North America - Year-over-year growth 2025-2030 (%)
Data Table on North America - Year-over-year growth 2025-2030 (%)
Chart on Regional Comparison - North America
Data Table on Regional Comparison - North America

12.4.1 US - Market size and forecast 2025-2030

Chart on US - Market size and forecast 2025-2030 ($ million)
Data Table on US - Market size and forecast 2025-2030 ($ million)
Chart on US - Year-over-year growth 2025-2030 (%)
Data Table on US - Year-over-year growth 2025-2030 (%)

12.4.2 Mexico - Market size and forecast 2025-2030

Chart on Mexico - Market size and forecast 2025-2030 ($ million)
Data Table on Mexico - Market size and forecast 2025-2030 ($ million)
Chart on Mexico - Year-over-year growth 2025-2030 (%)
Data Table on Mexico - Year-over-year growth 2025-2030 (%)

12.4.3 Canada - Market size and forecast 2025-2030

Chart on Canada - Market size and forecast 2025-2030 ($ million)
Data Table on Canada - Market size and forecast 2025-2030 ($ million)
Chart on Canada - Year-over-year growth 2025-2030 (%)
Data Table on Canada - Year-over-year growth 2025-2030 (%)

12.5 Europe - Market size and forecast 2025-2030

Chart on Europe - Market size and forecast 2025-2030 ($ million)
Data Table on Europe - Market size and forecast 2025-2030 ($ million)
Chart on Europe - Year-over-year growth 2025-2030 (%)
Data Table on Europe - Year-over-year growth 2025-2030 (%)
Chart on Regional Comparison - Europe
Data Table on Regional Comparison - Europe

12.5.1 Germany - Market size and forecast 2025-2030

Chart on Germany - Market size and forecast 2025-2030 ($ million)
Data Table on Germany - Market size and forecast 2025-2030 ($ million)
Chart on Germany - Year-over-year growth 2025-2030 (%)
Data Table on Germany - Year-over-year growth 2025-2030 (%)

12.5.2 France - Market size and forecast 2025-2030

Chart on France - Market size and forecast 2025-2030 ($ million)
Data Table on France - Market size and forecast 2025-2030 ($ million)
Chart on France - Year-over-year growth 2025-2030 (%)
Data Table on France - Year-over-year growth 2025-2030 (%)

12.5.3 UK - Market size and forecast 2025-2030

Chart on UK - Market size and forecast 2025-2030 ($ million)
Data Table on UK - Market size and forecast 2025-2030 ($ million)
Chart on UK - Year-over-year growth 2025-2030 (%)
Data Table on UK - Year-over-year growth 2025-2030 (%)

12.5.4 Italy - Market size and forecast 2025-2030

Chart on Italy - Market size and forecast 2025-2030 ($ million)
Data Table on Italy - Market size and forecast 2025-2030 ($ million)
Chart on Italy - Year-over-year growth 2025-2030 (%)
Data Table on Italy - Year-over-year growth 2025-2030 (%)

12.5.5 The Netherlands - Market size and forecast 2025-2030

Chart on The Netherlands - Market size and forecast 2025-2030 ($ million)
Data Table on The Netherlands - Market size and forecast 2025-2030 ($ million)
Chart on The Netherlands - Year-over-year growth 2025-2030 (%)
Data Table on The Netherlands - Year-over-year growth 2025-2030 (%)

12.5.6 Spain - Market size and forecast 2025-2030

Chart on Spain - Market size and forecast 2025-2030 ($ million)
Data Table on Spain - Market size and forecast 2025-2030 ($ million)
Chart on Spain - Year-over-year growth 2025-2030 (%)
Data Table on Spain - Year-over-year growth 2025-2030 (%)

12.6 Middle East and Africa - Market size and forecast 2025-2030

Chart on Middle East and Africa - Market size and forecast 2025-2030 ($ million)
Data Table on Middle East and Africa - Market size and forecast 2025-2030 ($ million)
Chart on Middle East and Africa - Year-over-year growth 2025-2030 (%)
Data Table on Middle East and Africa - Year-over-year growth 2025-2030 (%)
Chart on Regional Comparison - Middle East and Africa
Data Table on Regional Comparison - Middle East and Africa

12.6.1 Turkey - Market size and forecast 2025-2030

Chart on Turkey - Market size and forecast 2025-2030 ($ million)
Data Table on Turkey - Market size and forecast 2025-2030 ($ million)
Chart on Turkey - Year-over-year growth 2025-2030 (%)
Data Table on Turkey - Year-over-year growth 2025-2030 (%)

12.6.2 Saudi Arabia - Market size and forecast 2025-2030

Chart on Saudi Arabia - Market size and forecast 2025-2030 ($ million)
Data Table on Saudi Arabia - Market size and forecast 2025-2030 ($ million)
Chart on Saudi Arabia - Year-over-year growth 2025-2030 (%)
Data Table on Saudi Arabia - Year-over-year growth 2025-2030 (%)

12.6.3 UAE - Market size and forecast 2025-2030

Chart on UAE - Market size and forecast 2025-2030 ($ million)
Data Table on UAE - Market size and forecast 2025-2030 ($ million)
Chart on UAE - Year-over-year growth 2025-2030 (%)
Data Table on UAE - Year-over-year growth 2025-2030 (%)

12.6.4 South Africa - Market size and forecast 2025-2030

Chart on South Africa - Market size and forecast 2025-2030 ($ million)
Data Table on South Africa - Market size and forecast 2025-2030 ($ million)
Chart on South Africa - Year-over-year growth 2025-2030 (%)
Data Table on South Africa - Year-over-year growth 2025-2030 (%)

12.6.5 Israel - Market size and forecast 2025-2030

Chart on Israel - Market size and forecast 2025-2030 ($ million)
Data Table on Israel - Market size and forecast 2025-2030 ($ million)
Chart on Israel - Year-over-year growth 2025-2030 (%)
Data Table on Israel - Year-over-year growth 2025-2030 (%)

12.7 South America - Market size and forecast 2025-2030

Chart on South America - Market size and forecast 2025-2030 ($ million)
Data Table on South America - Market size and forecast 2025-2030 ($ million)
Chart on South America - Year-over-year growth 2025-2030 (%)
Data Table on South America - Year-over-year growth 2025-2030 (%)
Chart on Regional Comparison - South America
Data Table on Regional Comparison - South America

12.7.1 Brazil - Market size and forecast 2025-2030

Chart on Brazil - Market size and forecast 2025-2030 ($ million)
Data Table on Brazil - Market size and forecast 2025-2030 ($ million)
Chart on Brazil - Year-over-year growth 2025-2030 (%)
Data Table on Brazil - Year-over-year growth 2025-2030 (%)

12.7.2 Argentina - Market size and forecast 2025-2030

Chart on Argentina - Market size and forecast 2025-2030 ($ million)
Data Table on Argentina - Market size and forecast 2025-2030 ($ million)
Chart on Argentina - Year-over-year growth 2025-2030 (%)
Data Table on Argentina - Year-over-year growth 2025-2030 (%)

12.7.3 Colombia - Market size and forecast 2025-2030

Chart on Colombia - Market size and forecast 2025-2030 ($ million)
Data Table on Colombia - Market size and forecast 2025-2030 ($ million)
Chart on Colombia - Year-over-year growth 2025-2030 (%)
Data Table on Colombia - Year-over-year growth 2025-2030 (%)

12.8 Market opportunity by geography

Market opportunity by geography ($ million)
Data Tables on Market opportunity by geography ($ million)

13. Drivers, Challenges, and Opportunity

13.1 Market drivers

Surging global demand for AI hardware and high-density compute infrastructure
Electrification, architectural complexity, and connectivity across automotive systems
Expansion of industrial automation, medical technologies, and edge IoT devices

13.2 Market challenges

Escalating geopolitical tensions, protectionist tariffs, and supply chain restructuring pressures
Persistent skilled labor deficits, workforce turnover, and inflated operational costs
Accelerating technological obsolescence and heavy capital expenditure for advanced SMT infrastructure

13.3 Impact of drivers and challenges

Impact of drivers and challenges in 2025 and 2030

13.4 Market opportunities

Convergence of advanced semiconductor packaging and high-density substrate assembly
Institutionalization of circular lifecycle engineering and closed-loop component recovery
Strategic multi-shoring and resilient production redundancy via regionalized value chains

14. Competitive Landscape

14.1 Overview

14.2

Overview on criticality of inputs and factors of differentiation

14.3 Landscape disruption

Overview on factors of disruption

14.4 Industry risks

Impact of key risks on business

15. Competitive Analysis

15.1 Companies profiled

Companies covered

15.2 Company ranking index

15.3 Market positioning of companies

Matrix on companies position and classification

15.4 AdvancedPCB

AdvancedPCB - Overview
AdvancedPCB - Product / Service
AdvancedPCB - Key offerings
SWOT

15.5 Benchmark Electronics Inc.

Benchmark Electronics Inc. - Overview
Benchmark Electronics Inc. - Business segments
Benchmark Electronics Inc. - Key offerings
Benchmark Electronics Inc. - Segment focus
SWOT

15.6 Bittele Electronics Inc

Bittele Electronics Inc - Overview
Bittele Electronics Inc - Product / Service
Bittele Electronics Inc - Key offerings
SWOT

15.7 BYD Co. Ltd.

BYD Co. Ltd. - Overview
BYD Co. Ltd. - Business segments
BYD Co. Ltd. - Key offerings
BYD Co. Ltd. - Segment focus
SWOT

15.8 Celestica Inc.

Celestica Inc. - Overview
Celestica Inc. - Business segments
Celestica Inc. - Key offerings
Celestica Inc. - Segment focus
SWOT

15.9 Fabrinet Co Ltd.

Fabrinet Co Ltd. - Overview
Fabrinet Co Ltd. - Product / Service
Fabrinet Co Ltd. - Key offerings
SWOT

15.10 Flex Ltd.

Flex Ltd. - Overview
Flex Ltd. - Business segments
Flex Ltd. - Key offerings
Flex Ltd. - Segment focus
SWOT

15.11 Hon Hai Precision Ltd.

Hon Hai Precision Ltd. - Overview
Hon Hai Precision Ltd. - Business segments
Hon Hai Precision Ltd. - Key offerings
Hon Hai Precision Ltd. - Segment focus
SWOT

15.12 Inventec Corp.

Inventec Corp. - Overview
Inventec Corp. - Business segments
Inventec Corp. - Key offerings
Inventec Corp. - Segment focus
SWOT

15.13 Jabil Inc.

Jabil Inc. - Overview
Jabil Inc. - Business segments
Jabil Inc. - Key offerings
Jabil Inc. - Segment focus
SWOT

15.14 Pegatron Corp.

Pegatron Corp. - Overview
Pegatron Corp. - Business segments
Pegatron Corp. - Key offerings
Pegatron Corp. - Segment focus
SWOT

15.15 Plexus Corp.

Plexus Corp. - Overview
Plexus Corp. - Business segments
Plexus Corp. - Key offerings
Plexus Corp. - Segment focus
SWOT

15.16 Sanmina Corp.

Sanmina Corp. - Overview
Sanmina Corp. - Product / Service
Sanmina Corp. - Key offerings
SWOT

15.17 WisLab EMS Corporation

WisLab EMS Corporation - Overview
WisLab EMS Corporation - Product / Service
WisLab EMS Corporation - Key offerings
SWOT

15.18 Zollner Elektronik AG

Zollner Elektronik AG - Overview
Zollner Elektronik AG - Product / Service
Zollner Elektronik AG - Key offerings
SWOT

16. Appendix

16.1 Scope of the report

Market definition
Objectives
Notes and caveats

16.2 Inclusions and exclusions checklist

Inclusions checklist
Exclusions checklist

16.3 Currency conversion rates for US$

16.4 Research methodology

16.5 Data procurement

Information sources

16.6 Data validation

16.7 Validation techniques employed for market sizing

16.8 Data synthesis

16.9 360 degree market analysis

16.10 List of abbreviations

Research Methodology

Technavio presents a detailed picture of the market by way of study, synthesis, and summation of data from multiple sources. The analysts have presented the various facets of the market with a particular focus on identifying the key industry influencers. The data thus presented is comprehensive, reliable, and the result of extensive research, both primary and secondary.

INFORMATION SOURCES

Primary sources

  • Manufacturers and suppliers
  • Channel partners
  • Industry experts
  • Strategic decision makers

Secondary sources

  • Industry journals and periodicals
  • Government data
  • Financial reports of key industry players
  • Historical data
  • Press releases

DATA ANALYSIS

Data Synthesis

  • Collation of data
  • Estimation of key figures
  • Analysis of derived insights

Data Validation

  • Triangulation with data models
  • Reference against proprietary databases
  • Corroboration with industry experts

REPORT WRITING

Qualitative

  • Market drivers
  • Market challenges
  • Market trends
  • Five forces analysis

Quantitative

  • Market size and forecast
  • Market segmentation
  • Geographical insights
  • Competitive landscape

Interested in this report?

Get your sample now to see our research methodology and insights!

Download Now

Frequently Asked Questions

Electronic Contract Assembly market growth will increase by USD 42585.9 million during 2026-2030.

The Electronic Contract Assembly market is expected to grow at a CAGR of 6% during 2026-2030.

Electronic Contract Assembly market is segmented by Product type (PCB assembly, Box-build and system integration, Cable and wire harness assembly, Electromechanical assembly, Specialized electronic assembly) End-user (IT and telecommunications, Consumer electronics, Industrial electronics, Automotive electronics, Others) Service (Turnkey manufacturing, Consignment manufacturing, Partial turnkey manufacturing, Design and manufacturing services)

AdvancedPCB, Amphenol Corp., Benchmark Electronics Inc., Bittele Electronics Inc, BYD Co. Ltd., Celestica Inc., Fabrinet Co Ltd., Flex Ltd., Hon Hai Precision Ltd., Inventec Corp., Jabil Inc., Kimball Electronics Inc., Mefron Technologies, Pegatron Corp., Plexus Corp., Sanmina Corp., Volex Plc, WisLab EMS Corporation, Yazaki Corp., Zollner Elektronik AG are a few of the key vendors in the Electronic Contract Assembly market.

APAC will register the highest growth rate of 54.8% among the other regions. Therefore, the Electronic Contract Assembly market in APAC is expected to garner significant business opportunities for the vendors during the forecast period.

China, Japan, South Korea, India, Indonesia, Australia, US, Mexico, Canada, Germany, France, UK, Italy, The Netherlands, Spain, Turkey, Saudi Arabia, UAE, South Africa, Israel, Brazil, Argentina, Colombia

  • Surging global demand for AI hardware and high-density compute infrastructure is the driving factor this market.

The Electronic Contract Assembly market vendors should focus on grabbing business opportunities from the Product type segment as it accounted for the largest market share in the base year.
RIA - Research AI Assistant
Ask RIA
