
Employee Benefit Administration Market Analysis, Size, and Forecast 2026-2030: North America (US, Canada, and Mexico), Europe (UK, Germany, and France), APAC (China, Japan, and India), Middle East and Africa (Saudi Arabia, UAE, and South Africa), South America (Brazil, Argentina, and Colombia), and Rest of World (ROW)

Employee Benefit Administration Market Analysis, Size, and Forecast 2026-2030:
North America (US, Canada, and Mexico), Europe (UK, Germany, and France), APAC (China, Japan, and India), Middle East and Africa (Saudi Arabia, UAE, and South Africa), South America (Brazil, Argentina, and Colombia), and Rest of World (ROW)

Published: Oct 2026 311 Pages SKU: IRTNTR81755

Market Overview at a Glance

$1.59 B
Market Opportunity
10.3%
CAGR 2025 - 2030
33.8%
North America Growth
$716 Mn
Benefits enrollment and eligibility segment 2024

Employee Benefit Administration Market Size 2026-2030

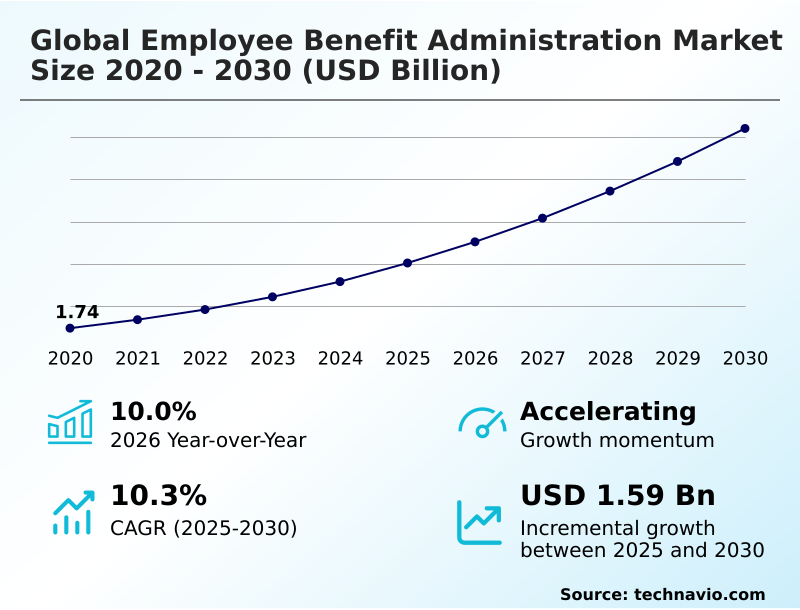
The employee benefit administration market size is valued to increase by USD 1.59 billion, at a CAGR of 10.3% from 2025 to 2030. Proliferation of cloud-native software and AI automation will drive the employee benefit administration market.

Major Market Trends & Insights

  • North America dominated the market and accounted for a 33.8% growth during the forecast period.
  • By Solution - Benefits enrollment and eligibility segment was valued at USD 716 million in 2024
  • By End-user - Large enterprises segment accounted for the largest market revenue share in 2024

Market Size & Forecast

  • Market Opportunities: USD 2.36 billion
  • Market Future Opportunities: USD 1.59 billion
  • CAGR from 2025 to 2030 : 10.3%

Market Summary

  • The Employee Benefit Administration Market exhibits robust demand as organizations transition from fragmented, manual human resource systems to unified SaaS architecture. In modern corporate operations, managing multi-tiered compensation requires sophisticated API integration between internal payroll databases and external insurance carriers.
  • For example, a distributed enterprise utilizing automated eligibility tracking and bidirectional data exchanges can seamlessly update beneficiary statuses during qualifying life events, eliminating error-prone asynchronous transmission cycles. This digital transformation has improved HR processing efficiency by 35% compared to legacy spreadsheet management.
  • The primary driver of this evolution is the proliferation of cloud-native software and AI automation, which drastically reduces administrative overhead and enables predictive analytics for claims evaluation. However, the market faces a substantial challenge in navigating escalating cybersecurity threats and multijurisdictional compliance tracking software engines.
  • Maintaining HIPAA compliance tools alongside strict European data localization protocols demands immense capital investment in zero-trust security architectures, slightly restraining rapid deployment capabilities for mid-market platform providers.

What will be the Size of the Employee Benefit Administration Market during the forecast period?
Get Key Insights on Market Forecast (PDF) Get Free Sample

How is the Employee Benefit Administration Market Segmented?

The employee benefit administration industry research report provides comprehensive data (region-wise segment analysis), with forecasts and estimates in "USD million" for the period 2026-2030, as well as historical data from 2020-2024 for the following segments.

  • Solution
    • Benefits enrollment and eligibility
    • Benefits plan management
    • Benefits compliance and reporting
    • Benefits communication
    • Benefits analytics and decision support
  • End-user
    • Large enterprises
    • SMEs
  • Type
    • Health and medical benefits
    • Retirement and pension benefits
    • Life and disability benefits
    • Dental and vision benefits
    • Voluntary benefits
  • Geography
    • North America
      • US
      • Canada
      • Mexico
    • Europe
      • UK
      • Germany
      • France
      • Italy
      • Spain
      • The Netherlands
    • APAC
      • China
      • Japan
      • India
      • South Korea
      • Australia
      • Indonesia
    • Middle East and Africa
      • Saudi Arabia
      • UAE
      • South Africa
      • Israel
      • Turkey
    • South America
      • Brazil
      • Argentina
      • Colombia

By Solution Insights

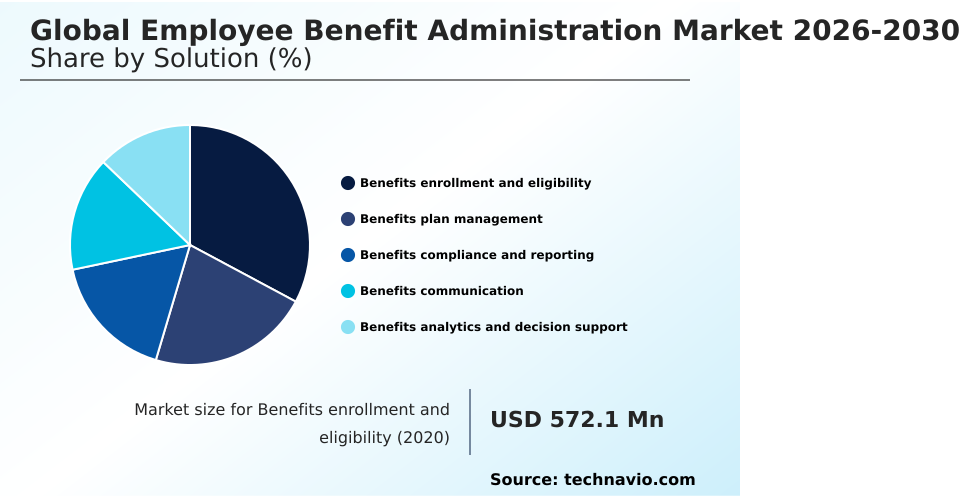
The benefits enrollment and eligibility segment is estimated to witness significant growth during the forecast period.

Benefits enrollment and eligibility systems establish the operational foundation of modern workforce compensation architectures. Through advanced digital transformation, these platforms replace manual tracking with streamlined digital enrollment workflows, automatically verifying participant qualifications.

Utilizing robust application programming interfaces and open API connections, the software synchronizes data instantaneously across carrier networks and internal HR portal automation tools. This integration flawlessly executes electronic payroll deduction and handles complex multi-currency structures for global teams.

Furthermore, automated systems handle intricate COBRA administration and align defined contribution pension matching without tedious manual intervention. Organizations adopting these platforms have improved their error detection rates by 15%, significantly minimizing financial leakage.

By intelligently offering tailored packages, including specialized mental wellness stipends, these segmented solutions optimize administrative throughput and elevate workforce satisfaction metrics.
Get Free Sample

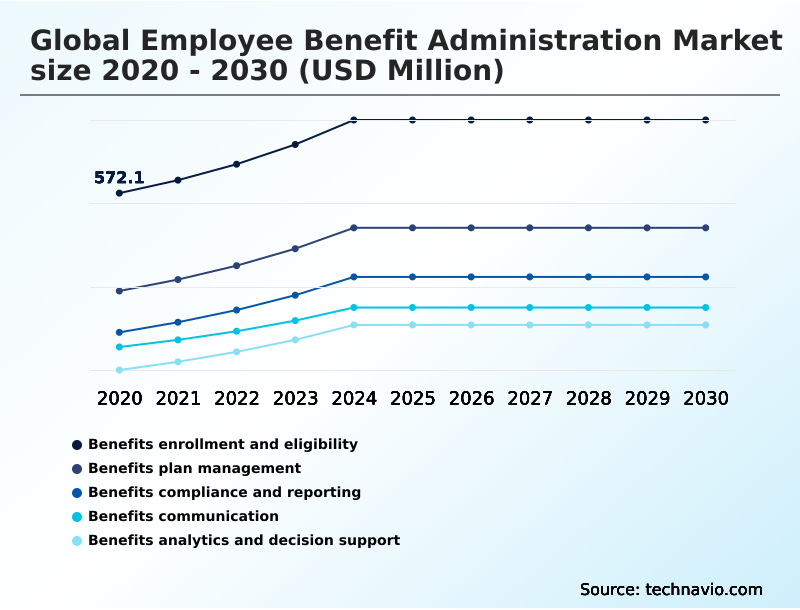
The Benefits enrollment and eligibility segment was valued at USD 716 million in 2024 and showed a gradual increase during the forecast period.
Get Free Sample

Regional Analysis

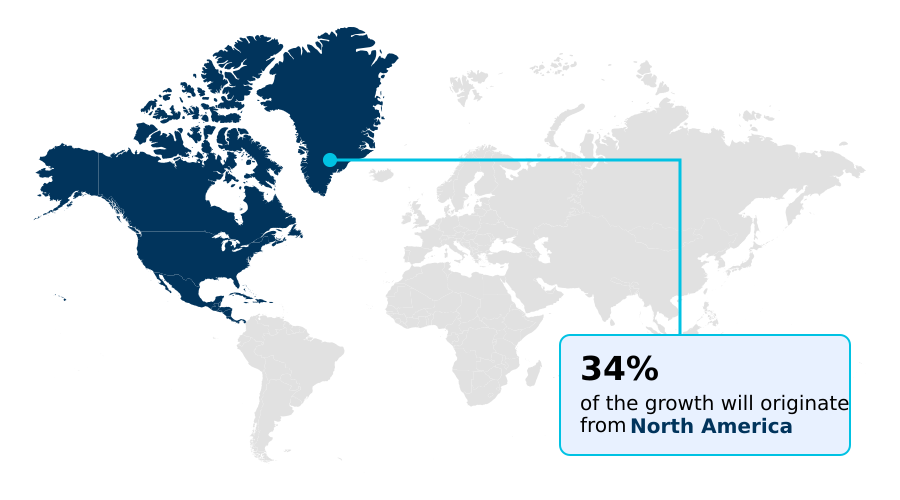
North America is estimated to contribute 33.8% to the growth of the global market during the forecast period.Technavio’s analysts have elaborately explained the regional trends and drivers that shape the market during the forecast period.
See How Employee Benefit Administration Market Demand is Rising in North America Get Free Sample

Regional adoption within the Employee Benefit Administration Market is heavily influenced by divergent regulatory frameworks and digital infrastructure maturity.

North America commands the highest penetration, driven by complex ACA requirements that necessitate advanced fiduciary compliance modules and robust automated compliance engines.

Consequently, North American enterprises utilize high-deductible health plans and price transparency estimator tools extensively, which has reduced corporate healthcare costs by 18% compared to European organizations. Employees effortlessly manage tax-advantaged health savings accounts through these digital portals.

Conversely, the European market focuses intensely on GDPR privacy frameworks and strict data localization protocols, which increases regional implementation cycles by 20%. As multinational corporations demand seamless cross-border harmonization, they increasingly deploy cafeteria-style models to deliver equitable perks worldwide.

These localized adaptations act as critical fiduciary defense mechanisms, protecting global sponsors from severe statutory non-compliance penalties.

Market Dynamics

Our researchers analyzed the data with 2025 as the base year, along with the key drivers, trends, and challenges. A holistic analysis of drivers will help companies refine their marketing strategies to gain a competitive advantage.

  • As organizations scale their global operations, the complexity of managing diverse workforce compensation demands sophisticated cloud native employee benefit platforms. These enterprise solutions replace fragmented manual processes with AI powered automated enrollment tracking, ensuring that human resource departments can process qualifying life events without workflow bottlenecks.
  • Multinational corporations increasingly rely on cross border benefit harmonization tools to maintain equity across geographically dispersed teams while navigating complex statutory environments. This is achieved through advanced multijurisdictional compliance tracking software engines that automatically align internal policies with localized labor mandates.
  • To control escalating medical expenses, plan sponsors are leveraging predictive analytics for claims evaluation, optimizing coverage tiers based on historical utilization. Concurrently, the integration of financial wellness integration in payroll systems enables workers to access emergency funds and manage long-term savings seamlessly. Employers are also enhancing talent retention by deploying cafeteria style voluntary benefit administration, giving employees unprecedented flexibility.
  • Seamless data flow is guaranteed by API connected human capital systems fortified with zero trust security in HR software, protecting sensitive personal data. Modern SaaS architecture for benefit enrollment supports automated EDI 834 data transmission, which reduces administrative processing errors by over 25% compared to legacy ERP benefit software integration methods.
  • These platforms also simplify high deductible health plan tracking and provide automated decision support for enrollment, empowering personnel to select optimal coverage. Ultimately, real time eligibility tracking ecosystems and lifestyle spending account administration platforms ensure comprehensive operational efficiency and competitive total rewards management.
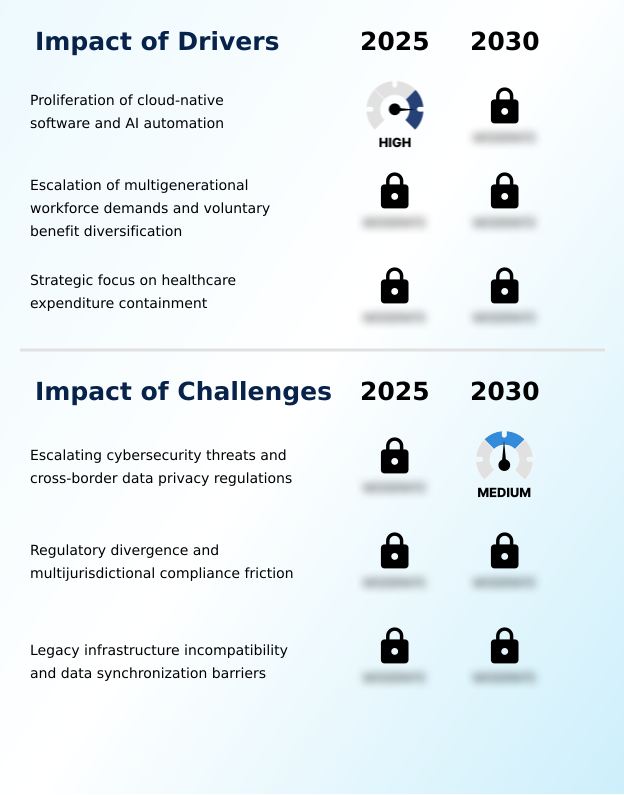
What are the key market drivers leading to the rise in the adoption of Employee Benefit Administration Industry?

  • The rapid proliferation of cloud-native software and advanced artificial intelligence automation serves as the primary catalyst propelling operational efficiencies across the market.

  • The rapid transition toward cloud-native administration and AI automation serves as the primary catalyst propelling the Employee Benefit Administration Market. Modern enterprises require robust API integration to synchronize complex human capital management data seamlessly with external insurance carriers.
  • Upgrading to a unified SaaS architecture eliminates administrative bottlenecks, whereas automated eligibility tracking prevents coverage lapses and mitigates severe compliance liabilities.
  • By utilizing advanced decision-support engines and integrated conversational chatbots, organizations empower employees to make cost-effective choices, which has lowered corporate healthcare premiums by 12%. Furthermore, deploying end-to-end encryption protocols secures sensitive participant data against evolving cyber threats.
  • This technological shift, combined with seamless ERP software integration, eliminates manual EDI 834 enrollment delays, boosting overall workflow efficiency by 35%. Consequently, these digital platforms have become indispensable operational assets for maintaining workforce stability and corporate fiscal discipline.

What are the market trends shaping the Employee Benefit Administration Industry?

  • The integration of financial wellness platforms and embedded payroll financial technology represents a prominent emerging trend shaping the industry. This convergence enables organizations to offer holistic compensation ecosystems that streamline daily wage utilization and long-term asset accumulation.

  • The integration of comprehensive financial wellness solutions directly into human capital infrastructure represents a transformative shift in the Employee Benefit Administration Market. Modern platforms now incorporate automated student loan repayment mechanisms and seamless earned wage access to alleviate workforce monetary anxiety.
  • This convergence requires sophisticated bidirectional data exchanges between enterprise resource planning systems and global financial institutions to ensure accurate liquidity options integration. By deploying predictive analytical engines, administrators can detect early patterns of financial distress and offer targeted interventions.
  • Consequently, organizations utilizing these embedded tools report a 22% improvement in employee retention rates and a 15% reduction in payroll calculation discrepancies. Expanding dependent care infrastructure and flexible lifestyle spending accounts further personalizes the compensation experience through diverse voluntary benefit aggregation.
  • Furthermore, processing actuarial analytics claims within a unified dashboard fundamentally shifts benefits administration from cyclical recordkeeping to a year-round strategic engagement driver.

What challenges does the Employee Benefit Administration Industry face during its growth?

  • Escalating cybersecurity threats and fragmented cross-border data privacy regulations represent critical challenges that significantly impede rapid industry expansion.

  • Escalating cybersecurity threats and fragmented multijurisdictional labor codes present formidable barriers within the Employee Benefit Administration Market. As platforms centralize vast quantities of sensitive information, implementing zero-trust security architectures becomes mandatory, yet it increases software engineering costs by 20% for boutique providers. Furthermore, navigating diverse regulatory frameworks, such as HIPAA compliance tools and local labor laws, introduces immense operational friction.
  • The persistence of legacy infrastructure bridges forces administrators to rely on asynchronous transmission cycles rather than real-time updates. This technological incompatibility causes dropped beneficiary records, increasing manual reconciliation workloads by 25%.
  • While advanced predictive analytics and predictive modeling tools accurately track shifting benefit consumption patterns, balancing constant statutory reporting automation updates across disparate geographies consumes substantial developmental resources, persistently impeding the rapid global expansion of standardized benefits technology.

Exclusive Technavio Analysis on Customer Landscape

The employee benefit administration market forecasting report includes the adoption lifecycle of the market, covering from the innovator’s stage to the laggard’s stage. It focuses on adoption rates in different regions based on penetration. Furthermore, the employee benefit administration market report also includes key purchase criteria and drivers of price sensitivity to help companies evaluate and develop their market growth analysis strategies.
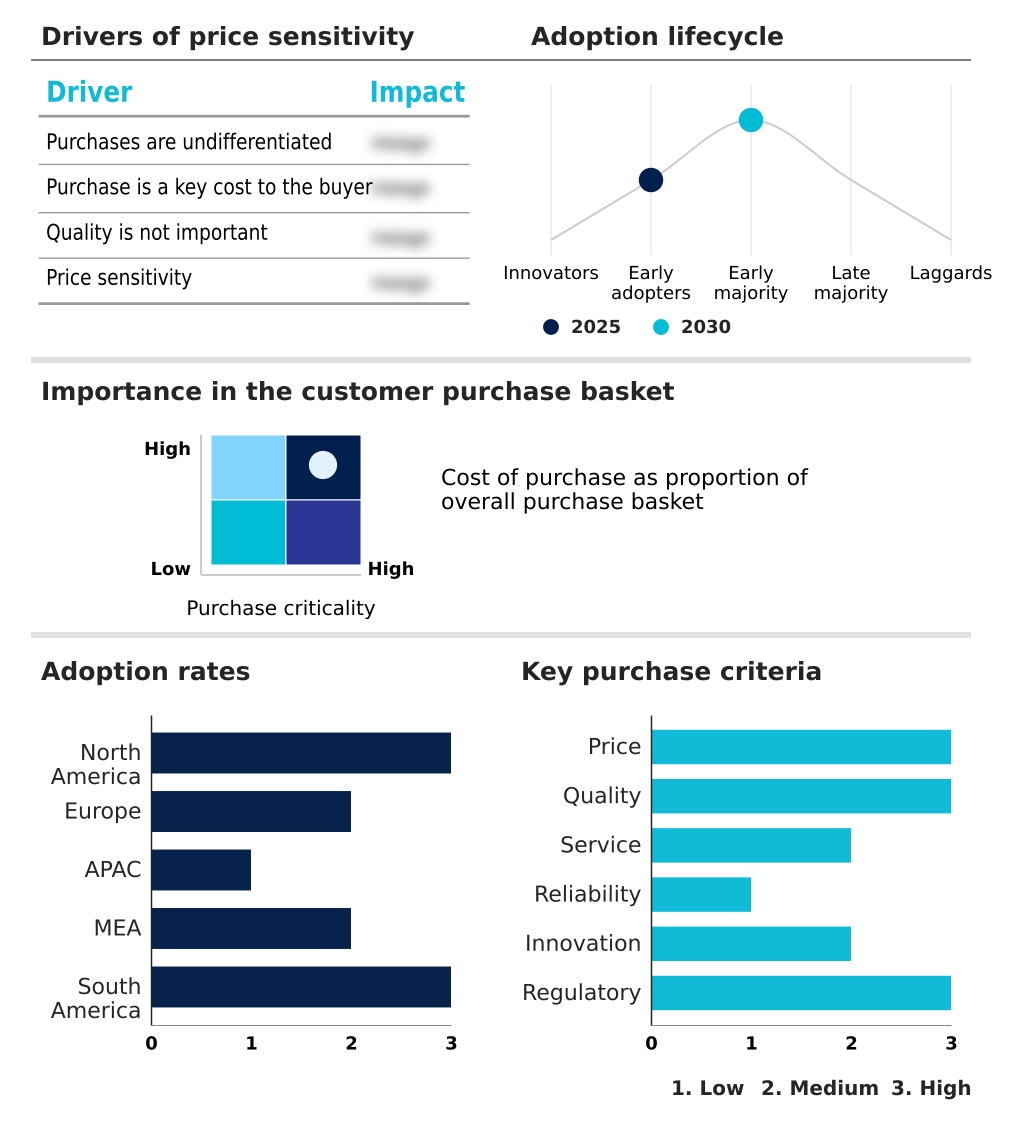
Customer Landscape of Employee Benefit Administration Industry

Competitive Landscape

Companies are implementing various strategies, such as strategic alliances, employee benefit administration market forecast, partnerships, mergers and acquisitions, geographical expansion, and product/service launches, to enhance their presence in the industry.

Alight Inc. - The platform delivers comprehensive human capital solutions through integrated data and technology, offering core benefits administration to connect workplace insights for broader organizational and operational outcomes.

The industry research and growth report includes detailed analyses of the competitive landscape of the market and information about key companies, including:

  • Alight Inc.
  • Aon plc
  • Automatic Data Processing Inc.
  • Businessolver
  • Dayforce Inc.
  • Empower Annuity Insurance Co.
  • Empyrean Benefits Solutions Inc.
  • Fidelity Investments
  • Gusto
  • Justworks Inc.
  • Mercer LLC
  • Paychex Inc.
  • Paycom Software Inc.
  • Paylocity Holding Corp.
  • Personio SE and Co. KG
  • PlanSource
  • Rippling People Center Inc.
  • TriNet Group Inc.
  • Willis Towers Watson Public Ltd
  • Workday Inc.

Qualitative and quantitative analysis of companies has been conducted to help clients understand the wider business environment as well as the strengths and weaknesses of key industry players. Data is qualitatively analyzed to categorize companies as pure play, category-focused, industry-focused, and diversified; it is quantitatively analyzed to categorize companies as dominant, leading, strong, tentative, and weak.

Recent Development and News in Employee benefit administration market

  • In the Diversified Support Services industry, the accelerated transition toward cloud-based delivery models and human capital management outsourcing has centralized back-office operations, directly impacting Employee Benefit Administration demand by driving a 25% increase in API integration requirements for seamless payroll synchronization.
  • Stringent multijurisdictional labor policies such as the GDPR have forced enterprise support providers to adopt robust data security frameworks, increasing the necessity for compliant digital enrollment workflows within global benefits platforms to prevent unauthorized data breaches.
  • The industry-wide shift toward holistic wellness and dependent care infrastructure has prompted corporate facility management and HR service providers to expand flexible allowances, elevating the utilization of cafeteria-style models in voluntary benefit aggregation software by over 30%.
  • Advancements in enterprise automation across BPO service lines have optimized resource planning, pushing Employee Benefit Administration providers to embed AI infrastructure and decision-support engines that improve statutory reporting automation and reduce manual processing overhead by 40%.

Dive into Technavio’s robust research methodology, blending expert interviews, extensive data synthesis, and validated models for unparalleled Employee Benefit Administration Market insights. See full methodology.

Market Scope
Page number 311
Base year 2025
Historic period 2020-2024
Forecast period 2026-2030
Growth momentum & CAGR Accelerate at a CAGR of 10.3%
Market growth 2026-2030 USD 1589.9 million
Market structure Fragmented
YoY growth 2025-2026(%) 10.0%
Key countries US, Canada, Mexico, UK, Germany, France, Italy, Spain, The Netherlands, China, Japan, India, South Korea, Australia, Indonesia, Saudi Arabia, UAE, South Africa, Israel, Turkey, Brazil, Argentina and Colombia
Competitive landscape Leading Companies, Market Positioning of Companies, Competitive Strategies, and Industry Risks

Request Free Sample

Research Analyst Overview

  • The Employee Benefit Administration Market serves as a critical operational pillar for modern enterprises managing complex compensation structures. Driven by evolving workforce demographics and stringent regulatory mandates, organizations are rapidly transitioning toward cloud-native administration architectures. This digital overhaul replaces fragmented manual tracking with automated eligibility tracking, drastically reducing clerical errors.
  • Furthermore, predictive analytics allow total rewards executives to optimize benefit portfolios, directly linking HR strategy to corporate budgeting. The deployment of decision-support engines enables employees to navigate complicated insurance tiers efficiently. Consequently, companies implementing these digital enrollment workflows have achieved a 30% reduction in processing time during high-volume enrollment periods.
  • As cafeteria-style models gain prominence, the demand for seamless voluntary benefit aggregation continues to rise. Integrating actuarial analytics claims processing within these platforms empowers fiduciaries to identify clinical cost drivers accurately.
  • The inclusion of health savings accounts within a unified dashboard ensures that personnel can manage tax-advantaged funds effortlessly, reinforcing the strategic value of automated compliance engines as essential fiduciary defense mechanisms.

What are the Key Data Covered in this Employee Benefit Administration Market Research and Growth Report?

  • What is the expected growth of the Employee Benefit Administration Market between 2026 and 2030?

    • USD 1.59 billion, at a CAGR of 10.3%

  • What segmentation does the market report cover?

    • The report is segmented by Solution (Benefits enrollment and eligibility, Benefits plan management, Benefits compliance and reporting, Benefits communication, and Benefits analytics and decision support), End-user (Large enterprises, and SMEs), Type (Health and medical benefits, Retirement and pension benefits, Life and disability benefits, Dental and vision benefits, and Voluntary benefits) and Geography (North America, Europe, APAC, Middle East and Africa, South America)

  • Which regions are analyzed in the report?

    • North America, Europe, APAC, Middle East and Africa and South America

  • What are the key growth drivers and market challenges?

    • Proliferation of cloud-native software and AI automation, Escalating cybersecurity threats and cross-border data privacy regulations

  • Who are the major players in the Employee Benefit Administration Market?

    • Alight Inc., Aon plc, Automatic Data Processing Inc., Businessolver, Dayforce Inc., Empower Annuity Insurance Co., Empyrean Benefits Solutions Inc., Fidelity Investments, Gusto, Justworks Inc., Mercer LLC, Paychex Inc., Paycom Software Inc., Paylocity Holding Corp., Personio SE and Co. KG, PlanSource, Rippling People Center Inc., TriNet Group Inc., Willis Towers Watson Public Ltd and Workday Inc.

Market Research Insights

  • The Employee Benefit Administration Market is undergoing structural modernization as enterprises adopt agile SaaS architecture to manage complex workforce compensation. Utilizing ERP software integration allows organizations to synchronize disparate human capital management systems seamlessly. This integration enhances statutory reporting automation, leading to a 40% reduction in compliance-related processing delays.
  • Furthermore, deploying conversational chatbots within HR portal automation provides instant answers for open enrollment inquiries, resulting in a 25% improvement in employee satisfaction metrics. Administrators leveraging predictive modeling tools to analyze benefit consumption patterns can optimize their voluntary offerings, decreasing unnecessary corporate healthcare expenditures by 15%.
  • This technology-driven ecosystem ultimately empowers organizations to elevate workforce retention while maintaining strict fiscal discipline and operational accuracy.

We can help! Our analysts can customize this employee benefit administration market research report to meet your requirements.

Get in touch

1. Executive Summary

1.1 Market overview

Executive Summary - Chart on Market Overview
Executive Summary - Data Table on Market Overview
Executive Summary - Chart on Global Market Characteristics
Executive Summary - Chart on Market by Geography
Executive Summary - Chart on Market Segmentation by Solution
Executive Summary - Chart on Market Segmentation by End-user
Executive Summary - Chart on Market Segmentation by Type
Executive Summary - Chart on Incremental Growth
Executive Summary - Data Table on Incremental Growth
Executive Summary - Chart on Company Market Positioning

2. Technavio Analysis

2.1 Analysis of price sensitivity, lifecycle, customer purchase basket, adoption rates, and purchase criteria

2.2 Criticality of inputs and Factors of differentiation

Chart on Overview on criticality of inputs and factors of differentiation

2.3 Factors of disruption

Chart on Overview on factors of disruption

2.4 Impact of drivers and challenges

Chart on Impact of drivers and challenges in 2025 and 2030

3. Market Landscape

3.1 Market ecosystem

Chart on Parent Market
Data Table on - Parent Market

3.2 Market characteristics

Chart on Market characteristics analysis

3.3 Value chain analysis

Chart on Value chain analysis

4. Market Sizing

4.1 Market definition

Data Table on Offerings of companies included in the market definition

4.2 Market segment analysis

Market segments

4.3 Market size 2025

4.4 Market outlook: Forecast for 2025-2030

Chart on Global - Market size and forecast 2025-2030 ($ million)
Data Table on Global - Market size and forecast 2025-2030 ($ million)
Chart on Global Market: Year-over-year growth 2025-2030 (%)
Data Table on Global Market: Year-over-year growth 2025-2030 (%)

5. Historic Market Size

5.1 Global Employee Benefit Administration Market 2020 - 2024

Historic Market Size - Data Table on Global Employee Benefit Administration Market 2020 - 2024 ($ million)

5.2 Solution segment analysis 2020 - 2024

Historic Market Size - Solution Segment 2020 - 2024 ($ million)

5.3 End-user segment analysis 2020 - 2024

Historic Market Size - End-user Segment 2020 - 2024 ($ million)

5.4 Type segment analysis 2020 - 2024

Historic Market Size - Type Segment 2020 - 2024 ($ million)

5.5 Geography segment analysis 2020 - 2024

Historic Market Size - Geography Segment 2020 - 2024 ($ million)

5.6 Country segment analysis 2020 - 2024

Historic Market Size - Country Segment 2020 - 2024 ($ million)

6. Qualitative Analysis

6.1 Impact of AI on Global Employee Benefit Administration Market

6.2 Impact of Geopolitical Conflicts on Global Employee Benefit Administration Market

7. Five Forces Analysis

7.1 Five forces summary

Five forces analysis - Comparison between 2025 and 2030

7.2 Bargaining power of buyers

Bargaining power of buyers - Impact of key factors 2025 and 2030

7.3 Bargaining power of suppliers

Bargaining power of suppliers - Impact of key factors in 2025 and 2030

7.4 Threat of new entrants

Threat of new entrants - Impact of key factors in 2025 and 2030

7.5 Threat of substitutes

Threat of substitutes - Impact of key factors in 2025 and 2030

7.6 Threat of rivalry

Threat of rivalry - Impact of key factors in 2025 and 2030

7.7 Market condition

Chart on Market condition - Five forces 2025 and 2030

8. Market Segmentation by Solution

8.1 Market segments

Chart on Solution - Market share 2025-2030 (%)
Data Table on Solution - Market share 2025-2030 (%)

8.2 Comparison by Solution

Chart on Comparison by Solution
Data Table on Comparison by Solution

8.3 Benefits enrollment and eligibility - Market size and forecast 2025-2030

Chart on Benefits enrollment and eligibility - Market size and forecast 2025-2030 ($ million)
Data Table on Benefits enrollment and eligibility - Market size and forecast 2025-2030 ($ million)
Chart on Benefits enrollment and eligibility - Year-over-year growth 2025-2030 (%)
Data Table on Benefits enrollment and eligibility - Year-over-year growth 2025-2030 (%)

8.4 Benefits plan management - Market size and forecast 2025-2030

Chart on Benefits plan management - Market size and forecast 2025-2030 ($ million)
Data Table on Benefits plan management - Market size and forecast 2025-2030 ($ million)
Chart on Benefits plan management - Year-over-year growth 2025-2030 (%)
Data Table on Benefits plan management - Year-over-year growth 2025-2030 (%)

8.5 Benefits compliance and reporting - Market size and forecast 2025-2030

Chart on Benefits compliance and reporting - Market size and forecast 2025-2030 ($ million)
Data Table on Benefits compliance and reporting - Market size and forecast 2025-2030 ($ million)
Chart on Benefits compliance and reporting - Year-over-year growth 2025-2030 (%)
Data Table on Benefits compliance and reporting - Year-over-year growth 2025-2030 (%)

8.6 Benefits communication - Market size and forecast 2025-2030

Chart on Benefits communication - Market size and forecast 2025-2030 ($ million)
Data Table on Benefits communication - Market size and forecast 2025-2030 ($ million)
Chart on Benefits communication - Year-over-year growth 2025-2030 (%)
Data Table on Benefits communication - Year-over-year growth 2025-2030 (%)

8.7 Benefits analytics and decision support - Market size and forecast 2025-2030

Chart on Benefits analytics and decision support - Market size and forecast 2025-2030 ($ million)
Data Table on Benefits analytics and decision support - Market size and forecast 2025-2030 ($ million)
Chart on Benefits analytics and decision support - Year-over-year growth 2025-2030 (%)
Data Table on Benefits analytics and decision support - Year-over-year growth 2025-2030 (%)

8.8 Market opportunity by Solution

Market opportunity by Solution ($ million)
Data Table on Market opportunity by Solution ($ million)

9. Market Segmentation by End-user

9.1 Market segments

Chart on End-user - Market share 2025-2030 (%)
Data Table on End-user - Market share 2025-2030 (%)

9.2 Comparison by End-user

Chart on Comparison by End-user
Data Table on Comparison by End-user

9.3 Large enterprises - Market size and forecast 2025-2030

Chart on Large enterprises - Market size and forecast 2025-2030 ($ million)
Data Table on Large enterprises - Market size and forecast 2025-2030 ($ million)
Chart on Large enterprises - Year-over-year growth 2025-2030 (%)
Data Table on Large enterprises - Year-over-year growth 2025-2030 (%)

9.4 SMEs - Market size and forecast 2025-2030

Chart on SMEs - Market size and forecast 2025-2030 ($ million)
Data Table on SMEs - Market size and forecast 2025-2030 ($ million)
Chart on SMEs - Year-over-year growth 2025-2030 (%)
Data Table on SMEs - Year-over-year growth 2025-2030 (%)

9.5 Market opportunity by End-user

Market opportunity by End-user ($ million)
Data Table on Market opportunity by End-user ($ million)

10. Market Segmentation by Type

10.1 Market segments

Chart on Type - Market share 2025-2030 (%)
Data Table on Type - Market share 2025-2030 (%)

10.2 Comparison by Type

Chart on Comparison by Type
Data Table on Comparison by Type

10.3 Health and medical benefits - Market size and forecast 2025-2030

Chart on Health and medical benefits - Market size and forecast 2025-2030 ($ million)
Data Table on Health and medical benefits - Market size and forecast 2025-2030 ($ million)
Chart on Health and medical benefits - Year-over-year growth 2025-2030 (%)
Data Table on Health and medical benefits - Year-over-year growth 2025-2030 (%)

10.4 Retirement and pension benefits - Market size and forecast 2025-2030

Chart on Retirement and pension benefits - Market size and forecast 2025-2030 ($ million)
Data Table on Retirement and pension benefits - Market size and forecast 2025-2030 ($ million)
Chart on Retirement and pension benefits - Year-over-year growth 2025-2030 (%)
Data Table on Retirement and pension benefits - Year-over-year growth 2025-2030 (%)

10.5 Life and disability benefits - Market size and forecast 2025-2030

Chart on Life and disability benefits - Market size and forecast 2025-2030 ($ million)
Data Table on Life and disability benefits - Market size and forecast 2025-2030 ($ million)
Chart on Life and disability benefits - Year-over-year growth 2025-2030 (%)
Data Table on Life and disability benefits - Year-over-year growth 2025-2030 (%)

10.6 Dental and vision benefits - Market size and forecast 2025-2030

Chart on Dental and vision benefits - Market size and forecast 2025-2030 ($ million)
Data Table on Dental and vision benefits - Market size and forecast 2025-2030 ($ million)
Chart on Dental and vision benefits - Year-over-year growth 2025-2030 (%)
Data Table on Dental and vision benefits - Year-over-year growth 2025-2030 (%)

10.7 Voluntary benefits - Market size and forecast 2025-2030

Chart on Voluntary benefits - Market size and forecast 2025-2030 ($ million)
Data Table on Voluntary benefits - Market size and forecast 2025-2030 ($ million)
Chart on Voluntary benefits - Year-over-year growth 2025-2030 (%)
Data Table on Voluntary benefits - Year-over-year growth 2025-2030 (%)

10.8 Market opportunity by Type

Market opportunity by Type ($ million)
Data Table on Market opportunity by Type ($ million)

11. Customer Landscape

11.1 Customer landscape overview

Analysis of price sensitivity, lifecycle, customer purchase basket, adoption rates, and purchase criteria

12. Geographic Landscape

12.1 Geographic segmentation

Chart on Market share by geography 2025-2030 (%)
Data Table on Market share by geography 2025-2030 (%)

12.2 Geographic comparison

Chart on Geographic comparison
Data Table on Geographic comparison

12.3 North America - Market size and forecast 2025-2030

Chart on North America - Market size and forecast 2025-2030 ($ million)
Data Table on North America - Market size and forecast 2025-2030 ($ million)
Chart on North America - Year-over-year growth 2025-2030 (%)
Data Table on North America - Year-over-year growth 2025-2030 (%)
Chart on Regional Comparison - North America
Data Table on Regional Comparison - North America

12.3.1 US - Market size and forecast 2025-2030

Chart on US - Market size and forecast 2025-2030 ($ million)
Data Table on US - Market size and forecast 2025-2030 ($ million)
Chart on US - Year-over-year growth 2025-2030 (%)
Data Table on US - Year-over-year growth 2025-2030 (%)

12.3.2 Canada - Market size and forecast 2025-2030

Chart on Canada - Market size and forecast 2025-2030 ($ million)
Data Table on Canada - Market size and forecast 2025-2030 ($ million)
Chart on Canada - Year-over-year growth 2025-2030 (%)
Data Table on Canada - Year-over-year growth 2025-2030 (%)

12.3.3 Mexico - Market size and forecast 2025-2030

Chart on Mexico - Market size and forecast 2025-2030 ($ million)
Data Table on Mexico - Market size and forecast 2025-2030 ($ million)
Chart on Mexico - Year-over-year growth 2025-2030 (%)
Data Table on Mexico - Year-over-year growth 2025-2030 (%)

12.4 Europe - Market size and forecast 2025-2030

Chart on Europe - Market size and forecast 2025-2030 ($ million)
Data Table on Europe - Market size and forecast 2025-2030 ($ million)
Chart on Europe - Year-over-year growth 2025-2030 (%)
Data Table on Europe - Year-over-year growth 2025-2030 (%)
Chart on Regional Comparison - Europe
Data Table on Regional Comparison - Europe

12.4.1 UK - Market size and forecast 2025-2030

Chart on UK - Market size and forecast 2025-2030 ($ million)
Data Table on UK - Market size and forecast 2025-2030 ($ million)
Chart on UK - Year-over-year growth 2025-2030 (%)
Data Table on UK - Year-over-year growth 2025-2030 (%)

12.4.2 Germany - Market size and forecast 2025-2030

Chart on Germany - Market size and forecast 2025-2030 ($ million)
Data Table on Germany - Market size and forecast 2025-2030 ($ million)
Chart on Germany - Year-over-year growth 2025-2030 (%)
Data Table on Germany - Year-over-year growth 2025-2030 (%)

12.4.3 France - Market size and forecast 2025-2030

Chart on France - Market size and forecast 2025-2030 ($ million)
Data Table on France - Market size and forecast 2025-2030 ($ million)
Chart on France - Year-over-year growth 2025-2030 (%)
Data Table on France - Year-over-year growth 2025-2030 (%)

12.4.4 Italy - Market size and forecast 2025-2030

Chart on Italy - Market size and forecast 2025-2030 ($ million)
Data Table on Italy - Market size and forecast 2025-2030 ($ million)
Chart on Italy - Year-over-year growth 2025-2030 (%)
Data Table on Italy - Year-over-year growth 2025-2030 (%)

12.4.5 Spain - Market size and forecast 2025-2030

Chart on Spain - Market size and forecast 2025-2030 ($ million)
Data Table on Spain - Market size and forecast 2025-2030 ($ million)
Chart on Spain - Year-over-year growth 2025-2030 (%)
Data Table on Spain - Year-over-year growth 2025-2030 (%)

12.4.6 The Netherlands - Market size and forecast 2025-2030

Chart on The Netherlands - Market size and forecast 2025-2030 ($ million)
Data Table on The Netherlands - Market size and forecast 2025-2030 ($ million)
Chart on The Netherlands - Year-over-year growth 2025-2030 (%)
Data Table on The Netherlands - Year-over-year growth 2025-2030 (%)

12.5 APAC - Market size and forecast 2025-2030

Chart on APAC - Market size and forecast 2025-2030 ($ million)
Data Table on APAC - Market size and forecast 2025-2030 ($ million)
Chart on APAC - Year-over-year growth 2025-2030 (%)
Data Table on APAC - Year-over-year growth 2025-2030 (%)
Chart on Regional Comparison - APAC
Data Table on Regional Comparison - APAC

12.5.1 China - Market size and forecast 2025-2030

Chart on China - Market size and forecast 2025-2030 ($ million)
Data Table on China - Market size and forecast 2025-2030 ($ million)
Chart on China - Year-over-year growth 2025-2030 (%)
Data Table on China - Year-over-year growth 2025-2030 (%)

12.5.2 Japan - Market size and forecast 2025-2030

Chart on Japan - Market size and forecast 2025-2030 ($ million)
Data Table on Japan - Market size and forecast 2025-2030 ($ million)
Chart on Japan - Year-over-year growth 2025-2030 (%)
Data Table on Japan - Year-over-year growth 2025-2030 (%)

12.5.3 India - Market size and forecast 2025-2030

Chart on India - Market size and forecast 2025-2030 ($ million)
Data Table on India - Market size and forecast 2025-2030 ($ million)
Chart on India - Year-over-year growth 2025-2030 (%)
Data Table on India - Year-over-year growth 2025-2030 (%)

12.5.4 South Korea - Market size and forecast 2025-2030

Chart on South Korea - Market size and forecast 2025-2030 ($ million)
Data Table on South Korea - Market size and forecast 2025-2030 ($ million)
Chart on South Korea - Year-over-year growth 2025-2030 (%)
Data Table on South Korea - Year-over-year growth 2025-2030 (%)

12.5.5 Australia - Market size and forecast 2025-2030

Chart on Australia - Market size and forecast 2025-2030 ($ million)
Data Table on Australia - Market size and forecast 2025-2030 ($ million)
Chart on Australia - Year-over-year growth 2025-2030 (%)
Data Table on Australia - Year-over-year growth 2025-2030 (%)

12.5.6 Indonesia - Market size and forecast 2025-2030

Chart on Indonesia - Market size and forecast 2025-2030 ($ million)
Data Table on Indonesia - Market size and forecast 2025-2030 ($ million)
Chart on Indonesia - Year-over-year growth 2025-2030 (%)
Data Table on Indonesia - Year-over-year growth 2025-2030 (%)

12.6 Middle East and Africa - Market size and forecast 2025-2030

Chart on Middle East and Africa - Market size and forecast 2025-2030 ($ million)
Data Table on Middle East and Africa - Market size and forecast 2025-2030 ($ million)
Chart on Middle East and Africa - Year-over-year growth 2025-2030 (%)
Data Table on Middle East and Africa - Year-over-year growth 2025-2030 (%)
Chart on Regional Comparison - Middle East and Africa
Data Table on Regional Comparison - Middle East and Africa

12.6.1 Saudi Arabia - Market size and forecast 2025-2030

Chart on Saudi Arabia - Market size and forecast 2025-2030 ($ million)
Data Table on Saudi Arabia - Market size and forecast 2025-2030 ($ million)
Chart on Saudi Arabia - Year-over-year growth 2025-2030 (%)
Data Table on Saudi Arabia - Year-over-year growth 2025-2030 (%)

12.6.2 UAE - Market size and forecast 2025-2030

Chart on UAE - Market size and forecast 2025-2030 ($ million)
Data Table on UAE - Market size and forecast 2025-2030 ($ million)
Chart on UAE - Year-over-year growth 2025-2030 (%)
Data Table on UAE - Year-over-year growth 2025-2030 (%)

12.6.3 South Africa - Market size and forecast 2025-2030

Chart on South Africa - Market size and forecast 2025-2030 ($ million)
Data Table on South Africa - Market size and forecast 2025-2030 ($ million)
Chart on South Africa - Year-over-year growth 2025-2030 (%)
Data Table on South Africa - Year-over-year growth 2025-2030 (%)

12.6.4 Israel - Market size and forecast 2025-2030

Chart on Israel - Market size and forecast 2025-2030 ($ million)
Data Table on Israel - Market size and forecast 2025-2030 ($ million)
Chart on Israel - Year-over-year growth 2025-2030 (%)
Data Table on Israel - Year-over-year growth 2025-2030 (%)

12.6.5 Turkey - Market size and forecast 2025-2030

Chart on Turkey - Market size and forecast 2025-2030 ($ million)
Data Table on Turkey - Market size and forecast 2025-2030 ($ million)
Chart on Turkey - Year-over-year growth 2025-2030 (%)
Data Table on Turkey - Year-over-year growth 2025-2030 (%)

12.7 South America - Market size and forecast 2025-2030

Chart on South America - Market size and forecast 2025-2030 ($ million)
Data Table on South America - Market size and forecast 2025-2030 ($ million)
Chart on South America - Year-over-year growth 2025-2030 (%)
Data Table on South America - Year-over-year growth 2025-2030 (%)
Chart on Regional Comparison - South America
Data Table on Regional Comparison - South America

12.7.1 Brazil - Market size and forecast 2025-2030

Chart on Brazil - Market size and forecast 2025-2030 ($ million)
Data Table on Brazil - Market size and forecast 2025-2030 ($ million)
Chart on Brazil - Year-over-year growth 2025-2030 (%)
Data Table on Brazil - Year-over-year growth 2025-2030 (%)

12.7.2 Argentina - Market size and forecast 2025-2030

Chart on Argentina - Market size and forecast 2025-2030 ($ million)
Data Table on Argentina - Market size and forecast 2025-2030 ($ million)
Chart on Argentina - Year-over-year growth 2025-2030 (%)
Data Table on Argentina - Year-over-year growth 2025-2030 (%)

12.7.3 Colombia - Market size and forecast 2025-2030

Chart on Colombia - Market size and forecast 2025-2030 ($ million)
Data Table on Colombia - Market size and forecast 2025-2030 ($ million)
Chart on Colombia - Year-over-year growth 2025-2030 (%)
Data Table on Colombia - Year-over-year growth 2025-2030 (%)

12.8 Market opportunity by geography

Market opportunity by geography ($ million)
Data Tables on Market opportunity by geography ($ million)

13. Drivers, Challenges, and Opportunity

13.1 Market drivers

Proliferation of cloud-native software and AI automation
Escalation of multigenerational workforce demands and voluntary benefit diversification
Strategic focus on healthcare expenditure containment

13.2 Market challenges

Escalating cybersecurity threats and cross-border data privacy regulations
Regulatory divergence and multijurisdictional compliance friction
Legacy infrastructure incompatibility and data synchronization barriers

13.3 Impact of drivers and challenges

Impact of drivers and challenges in 2025 and 2030

13.4 Market opportunities

Integration of financial wellness platforms and embedded payroll financial technology
Convergence of comprehensive family support and holistic care infrastructure
Expansion of cross-border harmonization and distributed workforce benefit orchestration

14. Competitive Landscape

14.1 Overview

14.2

Overview on criticality of inputs and factors of differentiation

14.3 Landscape disruption

Overview on factors of disruption

14.4 Industry risks

Impact of key risks on business

15. Competitive Analysis

15.1 Companies profiled

Companies covered

15.2 Company ranking index

15.3 Market positioning of companies

Matrix on companies position and classification

15.4 Alight Inc.

Alight Inc. - Overview
Alight Inc. - Product / Service
Alight Inc. - Key offerings
SWOT

15.5 Aon plc

Aon plc - Overview
Aon plc - Business segments
Aon plc - Key offerings
Aon plc - Segment focus
SWOT

15.6 Automatic Data Processing Inc.

Automatic Data Processing Inc. - Overview
Automatic Data Processing Inc. - Business segments
Automatic Data Processing Inc. - Key offerings
Automatic Data Processing Inc. - Segment focus
SWOT

15.7 Businessolver

Businessolver - Overview
Businessolver - Product / Service
Businessolver - Key offerings
SWOT

15.8 Dayforce Inc.

Dayforce Inc. - Overview
Dayforce Inc. - Product / Service
Dayforce Inc. - Key offerings
SWOT

15.9 Empower Annuity Insurance Co.

Empower Annuity Insurance Co. - Overview
Empower Annuity Insurance Co. - Product / Service
Empower Annuity Insurance Co. - Key offerings
SWOT

15.10 Fidelity Investments

Fidelity Investments - Overview
Fidelity Investments - Product / Service
Fidelity Investments - Key offerings
SWOT

15.11 Gusto

Gusto - Overview
Gusto - Product / Service
Gusto - Key offerings
SWOT

15.12 Mercer LLC

Mercer LLC - Overview
Mercer LLC - Product / Service
Mercer LLC - Key offerings
SWOT

15.13 Paychex Inc.

Paychex Inc. - Overview
Paychex Inc. - Business segments
Paychex Inc. - Key offerings
Paychex Inc. - Segment focus
SWOT

15.14 Paycom Software Inc.

Paycom Software Inc. - Overview
Paycom Software Inc. - Product / Service
Paycom Software Inc. - Key offerings
SWOT

15.15 Paylocity Holding Corp.

Paylocity Holding Corp. - Overview
Paylocity Holding Corp. - Product / Service
Paylocity Holding Corp. - Key offerings
SWOT

15.16 TriNet Group Inc.

TriNet Group Inc. - Overview
TriNet Group Inc. - Product / Service
TriNet Group Inc. - Key offerings
SWOT

15.17 Willis Towers Watson Public Ltd

Willis Towers Watson Public Ltd - Overview
Willis Towers Watson Public Ltd - Business segments
Willis Towers Watson Public Ltd - Key offerings
Willis Towers Watson Public Ltd - Segment focus
SWOT

15.18 Workday Inc.

Workday Inc. - Overview
Workday Inc. - Product / Service
Workday Inc. - Key news
Workday Inc. - Key offerings
SWOT

16. Appendix

16.1 Scope of the report

Market definition
Objectives
Notes and caveats

16.2 Inclusions and exclusions checklist

Inclusions checklist
Exclusions checklist

16.3 Currency conversion rates for US$

16.4 Research methodology

16.5 Data procurement

Information sources

16.6 Data validation

16.7 Validation techniques employed for market sizing

16.8 Data synthesis

16.9 360 degree market analysis

16.10 List of abbreviations

Research Methodology

Technavio presents a detailed picture of the market by way of study, synthesis, and summation of data from multiple sources. The analysts have presented the various facets of the market with a particular focus on identifying the key industry influencers. The data thus presented is comprehensive, reliable, and the result of extensive research, both primary and secondary.

INFORMATION SOURCES

Primary sources

  • Manufacturers and suppliers
  • Channel partners
  • Industry experts
  • Strategic decision makers

Secondary sources

  • Industry journals and periodicals
  • Government data
  • Financial reports of key industry players
  • Historical data
  • Press releases

DATA ANALYSIS

Data Synthesis

  • Collation of data
  • Estimation of key figures
  • Analysis of derived insights

Data Validation

  • Triangulation with data models
  • Reference against proprietary databases
  • Corroboration with industry experts

REPORT WRITING

Qualitative

  • Market drivers
  • Market challenges
  • Market trends
  • Five forces analysis

Quantitative

  • Market size and forecast
  • Market segmentation
  • Geographical insights
  • Competitive landscape

Interested in this report?

Get your sample now to see our research methodology and insights!

Download Now

Frequently Asked Questions

Employee Benefit Administration market growth will increase by USD 1589.9 million during 2026-2030.

The Employee Benefit Administration market is expected to grow at a CAGR of 10.3% during 2026-2030.

Employee Benefit Administration market is segmented by Solution (Benefits enrollment and eligibility, Benefits plan management, Benefits compliance and reporting, Benefits communication, Benefits analytics and decision support) End-user (Large enterprises, SMEs) Type (Health and medical benefits, Retirement and pension benefits, Life and disability benefits, Dental and vision benefits, Voluntary benefits)

Alight Inc., Aon plc, Automatic Data Processing Inc., Businessolver, Dayforce Inc., Empower Annuity Insurance Co., Empyrean Benefits Solutions Inc., Fidelity Investments, Gusto, Justworks Inc., Mercer LLC, Paychex Inc., Paycom Software Inc., Paylocity Holding Corp., Personio SE and Co. KG, PlanSource, Rippling People Center Inc., TriNet Group Inc., Willis Towers Watson Public Ltd, Workday Inc. are a few of the key vendors in the Employee Benefit Administration market.

North America will register the highest growth rate of 33.8% among the other regions. Therefore, the Employee Benefit Administration market in North America is expected to garner significant business opportunities for the vendors during the forecast period.

US, Canada, Mexico, UK, Germany, France, Italy, Spain, The Netherlands, China, Japan, India, South Korea, Australia, Indonesia, Saudi Arabia, UAE, South Africa, Israel, Turkey, Brazil, Argentina, Colombia

  • Proliferation of cloud-native software and AI automation is the driving factor this market.

The Employee Benefit Administration market vendors should focus on grabbing business opportunities from the Solution segment as it accounted for the largest market share in the base year.
RIA - Research AI Assistant
Ask RIA
