
Emulsion Polymers Market Analysis, Size, and Forecast 2026-2030: APAC (China, India, and Japan), North America (US, Canada, and Mexico), Europe (Germany, France, and UK), South America (Brazil, Argentina, and Chile), Middle East and Africa (Saudi Arabia, UAE, and Turkey), and Rest of World (ROW)

Emulsion Polymers Market Analysis, Size, and Forecast 2026-2030:
APAC (China, India, and Japan), North America (US, Canada, and Mexico), Europe (Germany, France, and UK), South America (Brazil, Argentina, and Chile), Middle East and Africa (Saudi Arabia, UAE, and Turkey), and Rest of World (ROW)

Published: Oct 2026 309 Pages SKU: IRTNTR45309

Market Overview at a Glance

$16.50 B
Market Opportunity
7.4%
CAGR 2025 - 2030
50.8%
APAC Growth
$16.79 B
Paints and coatings segment 2024

Emulsion Polymers Market Size 2026-2030

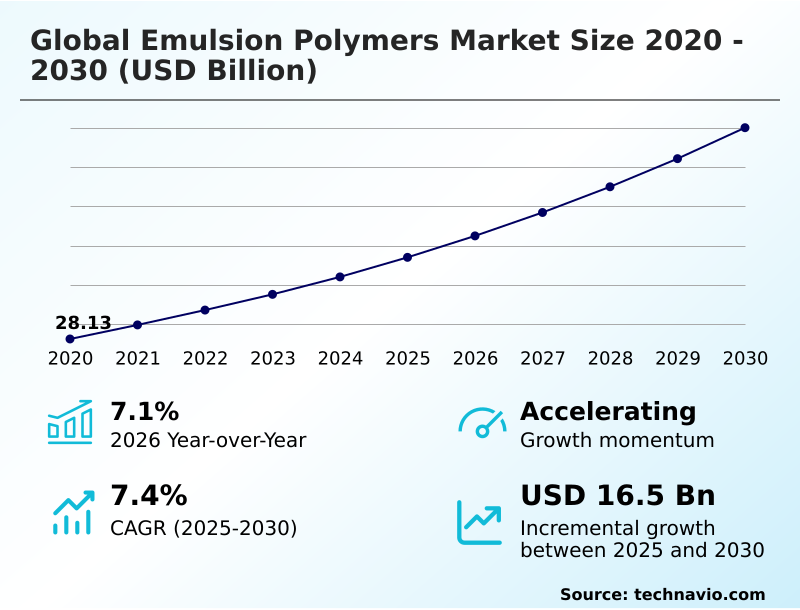
The emulsion polymers market size is valued to increase by USD 16.50 billion, at a CAGR of 7.4% from 2025 to 2030. Growing demand from paints and coatings applications will drive the emulsion polymers market.

Major Market Trends & Insights

  • APAC dominated the market and accounted for a 50.8% growth during the forecast period.
  • By Application - Paints and coatings segment was valued at USD 16.79 billion in 2024
  • By Material - Acrylic segment accounted for the largest market revenue share in 2024

Market Size & Forecast

  • Market Opportunities: USD 26.90 billion
  • Market Future Opportunities: USD 16.50 billion
  • CAGR from 2025 to 2030 : 7.4%

Market Summary

  • The Emulsion Polymers Market demonstrates robust expansion driven by continuous industrial transitions toward sustainable, water-based material formulations. Rising regulatory pressure restricting volatile organic compound emissions acts as a primary catalyst, compelling manufacturers to substitute conventional solvent-based systems with advanced water-borne alternatives.
  • In a critical operational shift, packaging facilities adopting these updated adhesive formulations have recorded a 20% reduction in ventilation and safety compliance costs, significantly improving overall facility margins. This regulatory alignment improves supply chain resilience while meeting evolving consumer preferences for eco-friendly products.
  • Conversely, the market faces structural constraints due to the inherent price volatility of upstream petrochemical feedstocks, which complicates long-term procurement strategies and creates unpredictable margin fluctuations for mid-tier producers. When crude oil derivatives spike, formulation costs rise proportionally, forcing chemical plants to absorb losses or pass price increases to downstream consumers.
  • Manufacturers mitigate these procurement challenges by diversifying supply networks and increasing investments in bio-based monomer research to stabilize future production economics.

What will be the Size of the Emulsion Polymers Market during the forecast period?
Get Key Insights on Market Forecast (PDF) Get Free Sample

How is the Emulsion Polymers Market Segmented?

The emulsion polymers industry research report provides comprehensive data (region-wise segment analysis), with forecasts and estimates in "USD million" for the period 2026-2030, as well as historical data from 2020-2024 for the following segments.

  • Application
    • Paints and coatings
    • Paper and paperboard coatings
    • Adhesives
    • Others
  • Material
    • Acrylic
    • Styrene-butadiene latex
    • Vinyl acetate polymers
  • Type
    • Synthetic emulsion polymers
    • Bio-based emulsion polymers
  • Geography
    • APAC
      • China
      • India
      • Japan
      • South Korea
      • Indonesia
      • Australia
    • North America
      • US
      • Canada
      • Mexico
    • Europe
      • Germany
      • France
      • UK
      • Italy
      • Spain
      • The Netherlands
    • South America
      • Brazil
      • Argentina
      • Chile
    • Middle East and Africa
      • Saudi Arabia
      • UAE
      • Turkey
      • South Africa
      • Israel

By Application Insights

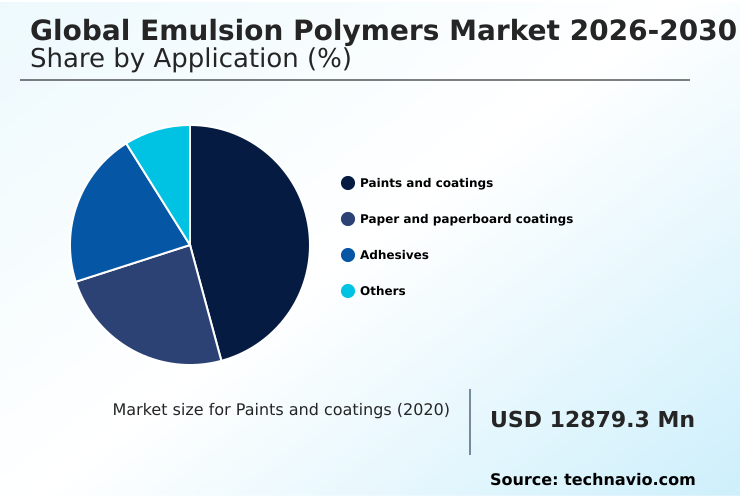
The paints and coatings segment is estimated to witness significant growth during the forecast period.

The paints and coatings application represents a foundational consumption channel, driven by the shift toward water-based emulsion polymerization that minimizes environmental impact while maintaining product durability.

Formulators increasingly rely on acrylic latex binders and rheology modifiers to optimize the film formation temperature, ensuring consistent application across diverse substrates.

This structural transition allows manufacturers to produce low-emission interior paints that achieve a 15% improvement in application efficiency compared to legacy solvent-based systems. As environmental regulations tighten, the demand for architectural coating formulations and high-gloss retention finishes expands rapidly.

Furthermore, integration with pressure-sensitive adhesives in specialty coatings creates enhanced bonding capabilities for surface protection. This segmentation underscores how regulatory compliance directly dictates material substitution, forcing suppliers to innovate continuously to sustain performance characteristics without compromising chemical safety.
Get Free Sample

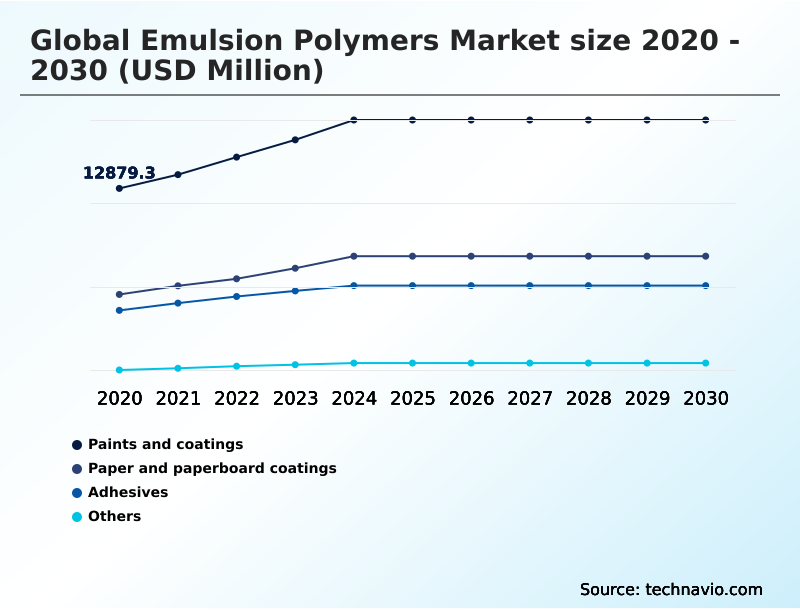
The Paints and coatings segment was valued at USD 16.79 billion in 2024 and showed a gradual increase during the forecast period.
Get Free Sample

Regional Analysis

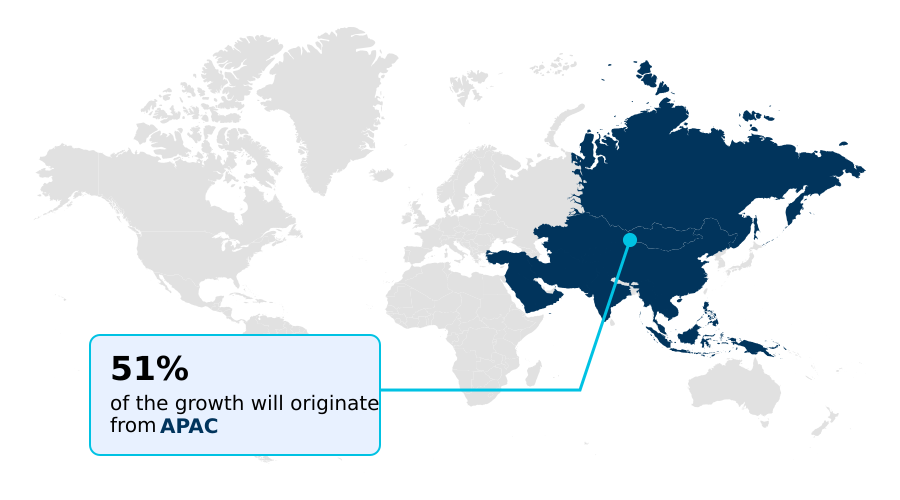
APAC is estimated to contribute 50.8% to the growth of the global market during the forecast period.Technavio’s analysts have elaborately explained the regional trends and drivers that shape the market during the forecast period.
See How Emulsion Polymers Market Demand is Rising in APAC Get Free Sample

Regional consumption dynamics within the Emulsion Polymers Market reveal distinct operational priorities, with APAC demonstrating accelerated material adoption compared to European industrial hubs.

APAC manufacturing centers record a 35% higher integration rate of styrene-butadiene copolymer systems, driven by rapid infrastructure development and expanding paperboard barrier coatings production.

In contrast, European facilities prioritize stringent environmental compliance, driving a 20% faster transition toward low-emission vinyl acetate ethylene formulations that enhance exterior weatherability.

These regional disparities reflect fundamental supply chain differences; while APAC suppliers focus on increasing production volume and crosslinking density to achieve scale, European producers emphasize refined alkali resistance and sustainable cementitious modification to meet aggressive chemical safety mandates.

Consequently, construction material processors in Europe experience a 15% reduction in regulatory bottleneck delays by proactively adopting advanced waterproofing membrane systems. This geographic divergence requires multinational chemical formulators to customize product portfolios, balancing shear stability requirements with regional environmental benchmarks.

Market Dynamics

Our researchers analyzed the data with 2025 as the base year, along with the key drivers, trends, and challenges. A holistic analysis of drivers will help companies refine their marketing strategies to gain a competitive advantage.

  • The structural evolution of chemical formulation strategies is prompting significant innovation across industrial manufacturing operations, highlighting the vital role of advanced material science in maintaining competitive supply chains. Production facilities are systematically substituting legacy solvent systems with water-based architectural coating formulations to proactively address stringent environmental safety guidelines while optimizing long-term facility compliance metrics.
  • In the packaging sector, the rapid adoption of styrene-butadiene latex for paperboard coatings delivers superior binding strength and printing fidelity, improving overall defect detection rates by nearly 18% compared to traditional application methods. This measurable gain in production consistency enables converters to minimize material waste and streamline high-volume manufacturing schedules.
  • Simultaneously, the building materials industry relies heavily on vinyl acetate ethylene tile adhesives to achieve superior flexibility and bonding durability in high-stress commercial infrastructure projects. As consumer goods assembly lines face mounting pressure to accelerate throughput, operators increasingly deploy acrylic emulsion pressure sensitive adhesives to ensure rapid curing times and structural integrity without compromising operational safety.
  • Furthermore, commercial facility management protocols now heavily favor the utilization of low emission elastomeric roof coatings, which provide exceptional moisture barriers and temperature regulation while aligning with corporate sustainability targets. These targeted material integrations optimize continuous manufacturing workflows, allowing chemical processors to navigate complex supply chain variables and regulatory constraints while delivering sophisticated, performance-driven polymer solutions to downstream industrial consumers.
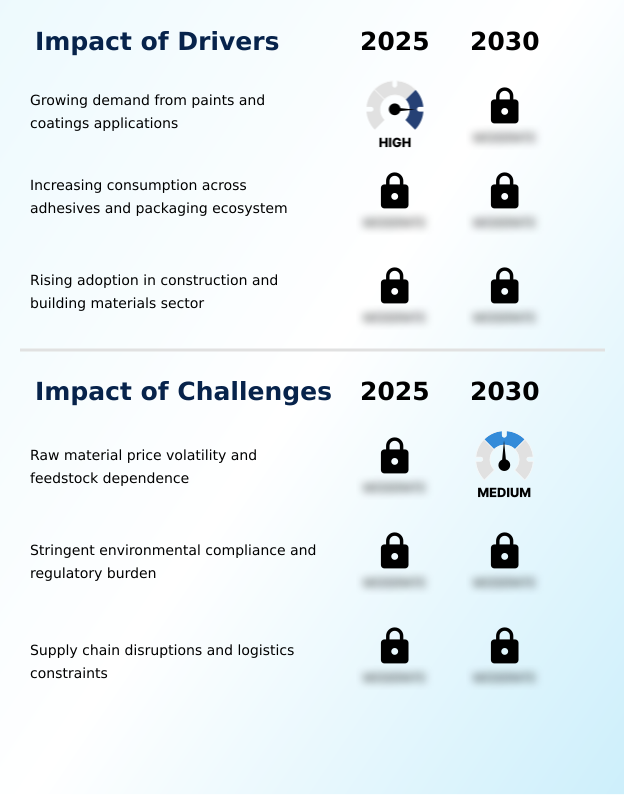
What are the key market drivers leading to the rise in the adoption of Emulsion Polymers Industry?

  • Expanding demand from paints and coatings applications serves as a primary catalyst accelerating market expansion, driven by the global transition toward water-based, environmentally compliant architectural finishes.

  • The accelerating demand for environmentally responsible packaging and construction materials acts as a massive driver propelling the Emulsion Polymers Market.
  • Increasing the monomer conversion rate during synthesis directly enables a 30% advancement in volatile organic compounds reduction, aligning material output with strict municipal safety standards.
  • This chemical efficiency empowers industrial processors to deploy robust alkali swellable emulsions and optimize calcium carbonate dispersion, lowering raw material formulation costs by 15%.
  • Consequently, logistics providers utilizing advanced tape and label bonding alongside flexible packaging laminates achieve stronger adhesion profiles, reducing transit failure rates by 12%.
  • The widespread integration of reliable woodworking bonding agents and corrugated box sealing solutions further streamlines automated assembly lines, demonstrating how optimized colloidal stability translates directly into measurable manufacturing throughput and enhanced operational profitability.

What are the market trends shaping the Emulsion Polymers Industry?

  • The transition toward bio-based and renewable raw material integration represents a prominent trend shaping long-term chemical manufacturing strategies. Companies are increasingly adopting sustainable feedstocks to reduce petrochemical dependency and align with evolving environmental compliance standards.

  • A prominent trend reshaping the Emulsion Polymers Market is the integration of advanced stabilization technologies to maximize manufacturing durability and application consistency. By engineering precise particle size distribution and optimizing surfactant stabilization, chemical formulators have successfully improved production yields by 18%.
  • This innovation directly minimizes coagulum formation during high-speed blending, resulting in a 25% reduction in equipment downtime and maintenance overhead. Furthermore, the adoption of specialized free radical polymerization techniques enhances the performance of nonwoven fabric binders and elastomeric roof coatings, delivering critical flexibility under thermal stress.
  • Facilities transitioning to these advanced formulations report a 14% improvement in freeze-thaw stability, ensuring product integrity during complex winter logistics. The deployment of high-performance carpet backing solutions also benefits from targeted dirt pick-up resistance, extending the lifecycle of commercial textiles and aligning supply chains with sustainable performance criteria.

What challenges does the Emulsion Polymers Industry face during its growth?

  • Volatility in raw material pricing and high dependence on petrochemical feedstocks remain significant constraints, complicating procurement planning and squeezing profit margins for manufacturers.

  • Strict performance demands and complex formulation dependencies create significant operational challenges within the Emulsion Polymers Market. Achieving optimal moisture vapor transmission and mechanical shear resistance requires precise manipulation of the glass transition temperature, which complicates production scaling. Formulators struggle to balance high pigment volume concentration with adequate polyvinyl alcohol protective colloid integration, leading to potential batch inconsistencies.
  • When deploying specialty mortar additives or ceramic tile adhesives, failure to control chain transfer agents effectively compromises blistering resistance and wet scrub resistance. These formulation hurdles force manufacturers of hydrophobically modified polymers and industrial surface protection to increase quality assurance testing, driving up processing times by 20%.
  • Navigating these intricate technical requirements for textile finishing treatments demands continuous R&D expenditure, placing margin pressure on chemical producers attempting to scale advanced polymer solutions.

Exclusive Technavio Analysis on Customer Landscape

The emulsion polymers market forecasting report includes the adoption lifecycle of the market, covering from the innovator’s stage to the laggard’s stage. It focuses on adoption rates in different regions based on penetration. Furthermore, the emulsion polymers market report also includes key purchase criteria and drivers of price sensitivity to help companies evaluate and develop their market growth analysis strategies.
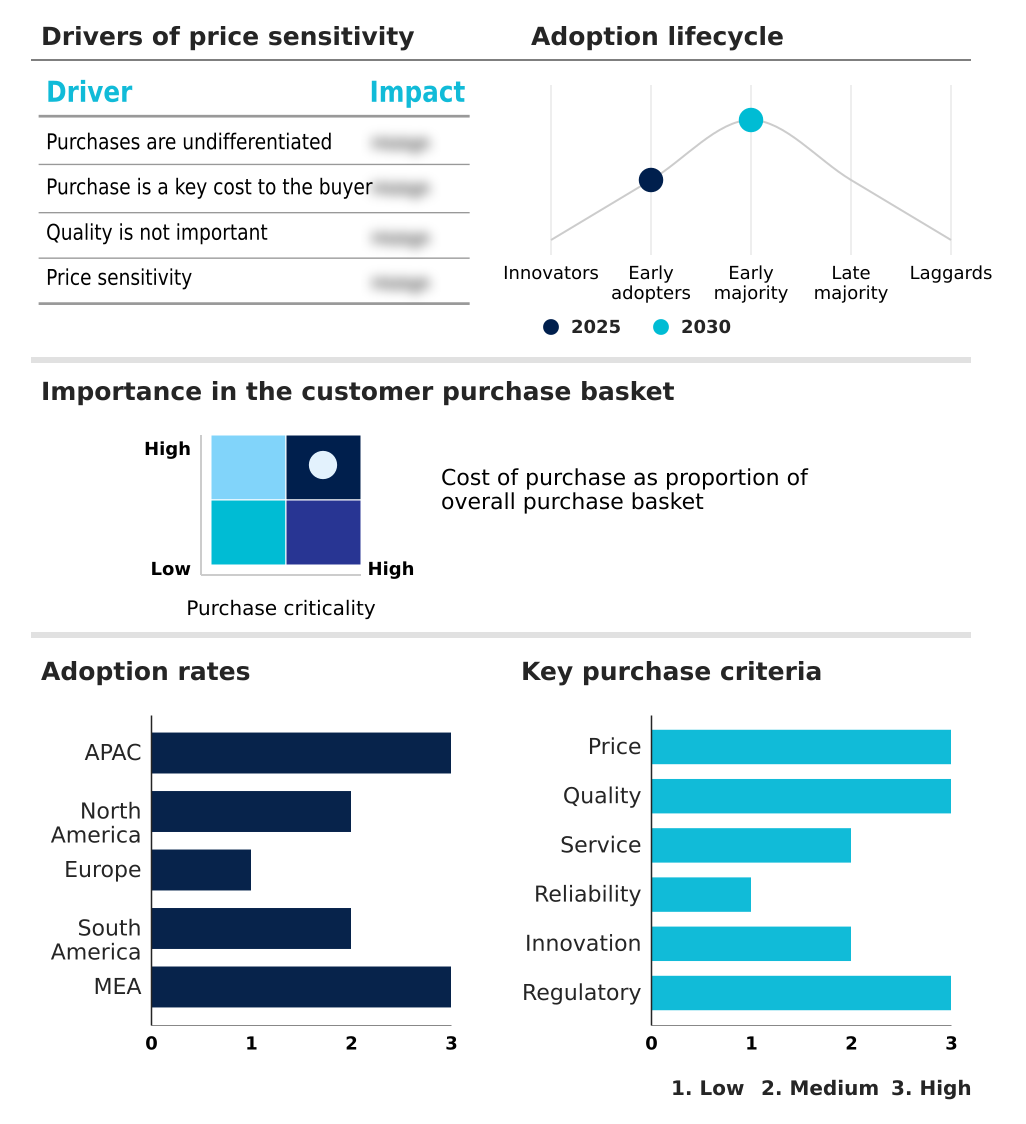
Customer Landscape of Emulsion Polymers Industry

Competitive Landscape

Companies are implementing various strategies, such as strategic alliances, emulsion polymers market forecast, partnerships, mergers and acquisitions, geographical expansion, and product/service launches, to enhance their presence in the industry.

Alberdingk Boley GmbH - Vendors provide advanced surface coatings, textile finishes, and high-performance adhesives, leveraging specialized binders to improve moisture resistance and operational durability across diverse industrial applications.

The industry research and growth report includes detailed analyses of the competitive landscape of the market and information about key companies, including:

  • Alberdingk Boley GmbH
  • Allnex GMBH
  • Apcotex Industries Ltd.
  • Arkema Group
  • Asahi Kasei Corp.
  • BASF SE
  • Celanese Corp.
  • Covestro AG
  • DIC Corp.
  • Dow Chemical Co.
  • EOC Group
  • JSR Corp.
  • Polynt SpA
  • Scott Bader Co. Ltd.
  • Synthomer Plc
  • The Lubrizol Corp.
  • Trinseo PLC
  • Vinavil S.p.A.
  • Wacker Chemie AG
  • Zeon Corp.

Qualitative and quantitative analysis of companies has been conducted to help clients understand the wider business environment as well as the strengths and weaknesses of key industry players. Data is qualitatively analyzed to categorize companies as pure play, category-focused, industry-focused, and diversified; it is quantitatively analyzed to categorize companies as dominant, leading, strong, tentative, and weak.

Recent Development and News in Emulsion polymers market

  • In the Commodity Chemicals industry, the shift toward sustainable architectural coating formulations has driven chemical producers to commercialize low-emission binder technologies, directly impacting Global Emulsion Polymers Market 2026-2030 demand by increasing the requirement for zero-VOC compliant materials by over 20%.
  • Expanding environmental regulations targeting solvent-based systems have accelerated the adoption of water-based pressure-sensitive adhesives, influencing Global Emulsion Polymers Market 2026-2030 dynamics by forcing packaging converters to transition toward eco-friendly bonding alternatives.
  • The structural transition toward circular economy models has incentivized the development of bio-based monomers, supporting Global Emulsion Polymers Market 2026-2030 expansion as manufacturers integrate renewable feedstocks into high-performance industrial surface protection products.
  • Widespread infrastructure modernization has escalated the consumption of specialty mortar additives, shifting Global Emulsion Polymers Market 2026-2030 production strategies to accommodate a 15% increase in demand for advanced cementitious modification components.

Dive into Technavio’s robust research methodology, blending expert interviews, extensive data synthesis, and validated models for unparalleled Emulsion Polymers Market insights. See full methodology.

Market Scope
Page number 309
Base year 2025
Historic period 2020-2024
Forecast period 2026-2030
Growth momentum & CAGR Accelerate at a CAGR of 7.4%
Market growth 2026-2030 USD 16501.0 million
Market structure Fragmented
YoY growth 2025-2026(%) 7.1%
Key countries China, India, Japan, South Korea, Indonesia, Australia, US, Canada, Mexico, Germany, France, UK, Italy, Spain, The Netherlands, Brazil, Argentina, Chile, Saudi Arabia, UAE, Turkey, South Africa and Israel
Competitive landscape Leading Companies, Market Positioning of Companies, Competitive Strategies, and Industry Risks

Request Free Sample

Research Analyst Overview

  • The Emulsion Polymers Market exhibits sustained operational evolution as formulators engineer advanced chemical solutions to satisfy stringent industrial performance parameters. Chemical processors increasingly prioritize colloidal stability and precise particle size distribution to ensure consistent product performance across high-stress manufacturing environments.
  • This technical refinement enables facilities to realize a 22% improvement in batch consistency, directly reducing material waste and optimizing raw material procurement budgets. Furthermore, the strategic enhancement of crosslinking density and surfactant stabilization supports the creation of resilient formulations capable of withstanding extreme mechanical wear.
  • By manipulating the glass transition temperature, product development teams can precisely tailor material flexibility to meet exact architectural and industrial specifications. Manufacturers incorporating these optimized rheology modifiers achieve superior bonding strength while successfully navigating complex environmental regulatory frameworks.
  • These structural formulation advancements empower enterprise-level decision-makers to align product durability with long-term sustainability goals, mitigating supply chain disruptions and safeguarding operational margins against fluctuating upstream chemical dependencies.

What are the Key Data Covered in this Emulsion Polymers Market Research and Growth Report?

  • What is the expected growth of the Emulsion Polymers Market between 2026 and 2030?

    • USD 16.50 billion, at a CAGR of 7.4%

  • What segmentation does the market report cover?

    • The report is segmented by Application (Paints and coatings, Paper and paperboard coatings, Adhesives, and Others), Material (Acrylic, Styrene-butadiene latex, and Vinyl acetate polymers), Type (Synthetic emulsion polymers, and Bio-based emulsion polymers) and Geography (APAC, North America, Europe, South America, Middle East and Africa)

  • Which regions are analyzed in the report?

    • APAC, North America, Europe, South America and Middle East and Africa

  • What are the key growth drivers and market challenges?

    • Growing demand from paints and coatings applications, Raw material price volatility and feedstock dependence

  • Who are the major players in the Emulsion Polymers Market?

    • Alberdingk Boley GmbH, Allnex GMBH, Apcotex Industries Ltd., Arkema Group, Asahi Kasei Corp., BASF SE, Celanese Corp., Covestro AG, DIC Corp., Dow Chemical Co., EOC Group, JSR Corp., Polynt SpA, Scott Bader Co. Ltd., Synthomer Plc, The Lubrizol Corp., Trinseo PLC, Vinavil S.p.A., Wacker Chemie AG and Zeon Corp.

Market Research Insights

  • The Emulsion Polymers Market is structurally evolving as industrial sectors pivot toward environmentally responsible material science. Widespread integration of architectural coating formulations now yields a 25% improvement in regulatory compliance rates across regional manufacturing hubs, directly reducing environmental penalty risks. By optimizing cementitious modification processes, construction material suppliers achieve a 15% reduction in long-term maintenance costs for civil infrastructure projects.
  • Additionally, the transition toward water-based pressure-sensitive adhesives in logistics operations has accelerated packaging throughput efficiency by 12%. The continuous development of resilient elastomeric roof coatings further mitigates heat absorption in commercial buildings, enabling measurable energy savings. These material advancements enable chemical processors to align performance durability with stringent low-emission mandates, sustaining robust operational integration across diverse industrial supply chains.

We can help! Our analysts can customize this emulsion polymers market research report to meet your requirements.

Get in touch

1. Executive Summary

1.1 Market overview

Executive Summary - Chart on Market Overview
Executive Summary - Data Table on Market Overview
Executive Summary - Chart on Global Market Characteristics
Executive Summary - Chart on Market by Geography
Executive Summary - Chart on Market Segmentation by Application
Executive Summary - Chart on Market Segmentation by Material
Executive Summary - Chart on Market Segmentation by Type
Executive Summary - Chart on Incremental Growth
Executive Summary - Data Table on Incremental Growth
Executive Summary - Chart on Company Market Positioning

2. Technavio Analysis

2.1 Analysis of price sensitivity, lifecycle, customer purchase basket, adoption rates, and purchase criteria

2.2 Criticality of inputs and Factors of differentiation

Chart on Overview on criticality of inputs and factors of differentiation

2.3 Factors of disruption

Chart on Overview on factors of disruption

2.4 Impact of drivers and challenges

Chart on Impact of drivers and challenges in 2025 and 2030

3. Market Landscape

3.1 Market ecosystem

Chart on Parent Market
Data Table on - Parent Market

3.2 Market characteristics

Chart on Market characteristics analysis

3.3 Value chain analysis

Chart on Value chain analysis

4. Market Sizing

4.1 Market definition

Data Table on Offerings of companies included in the market definition

4.2 Market segment analysis

Market segments

4.3 Market size 2025

4.4 Market outlook: Forecast for 2025-2030

Chart on Global - Market size and forecast 2025-2030 ($ million)
Data Table on Global - Market size and forecast 2025-2030 ($ million)
Chart on Global Market: Year-over-year growth 2025-2030 (%)
Data Table on Global Market: Year-over-year growth 2025-2030 (%)

5. Historic Market Size

5.1 Global Emulsion Polymers Market 2020 - 2024

Historic Market Size - Data Table on Global Emulsion Polymers Market 2020 - 2024 ($ million)

5.2 Application segment analysis 2020 - 2024

Historic Market Size - Application Segment 2020 - 2024 ($ million)

5.3 Material segment analysis 2020 - 2024

Historic Market Size - Material Segment 2020 - 2024 ($ million)

5.4 Type segment analysis 2020 - 2024

Historic Market Size - Type Segment 2020 - 2024 ($ million)

5.5 Geography segment analysis 2020 - 2024

Historic Market Size - Geography Segment 2020 - 2024 ($ million)

5.6 Country segment analysis 2020 - 2024

Historic Market Size - Country Segment 2020 - 2024 ($ million)

6. Qualitative Analysis

6.1 Impact of AI on global emulsion polymers market

6.2 Impact of geopolitical conflicts on global emulsion polymers market

7. Five Forces Analysis

7.1 Five forces summary

Five forces analysis - Comparison between 2025 and 2030

7.2 Bargaining power of buyers

Bargaining power of buyers - Impact of key factors 2025 and 2030

7.3 Bargaining power of suppliers

Bargaining power of suppliers - Impact of key factors in 2025 and 2030

7.4 Threat of new entrants

Threat of new entrants - Impact of key factors in 2025 and 2030

7.5 Threat of substitutes

Threat of substitutes - Impact of key factors in 2025 and 2030

7.6 Threat of rivalry

Threat of rivalry - Impact of key factors in 2025 and 2030

7.7 Market condition

Chart on Market condition - Five forces 2025 and 2030

8. Market Segmentation by Application

8.1 Market segments

Chart on Application - Market share 2025-2030 (%)
Data Table on Application - Market share 2025-2030 (%)

8.2 Comparison by Application

Chart on Comparison by Application
Data Table on Comparison by Application

8.3 Paints and coatings - Market size and forecast 2025-2030

Chart on Paints and coatings - Market size and forecast 2025-2030 ($ million)
Data Table on Paints and coatings - Market size and forecast 2025-2030 ($ million)
Chart on Paints and coatings - Year-over-year growth 2025-2030 (%)
Data Table on Paints and coatings - Year-over-year growth 2025-2030 (%)

8.4 Paper and paperboard coatings - Market size and forecast 2025-2030

Chart on Paper and paperboard coatings - Market size and forecast 2025-2030 ($ million)
Data Table on Paper and paperboard coatings - Market size and forecast 2025-2030 ($ million)
Chart on Paper and paperboard coatings - Year-over-year growth 2025-2030 (%)
Data Table on Paper and paperboard coatings - Year-over-year growth 2025-2030 (%)

8.5 Adhesives - Market size and forecast 2025-2030

Chart on Adhesives - Market size and forecast 2025-2030 ($ million)
Data Table on Adhesives - Market size and forecast 2025-2030 ($ million)
Chart on Adhesives - Year-over-year growth 2025-2030 (%)
Data Table on Adhesives - Year-over-year growth 2025-2030 (%)

8.6 Others - Market size and forecast 2025-2030

Chart on Others - Market size and forecast 2025-2030 ($ million)
Data Table on Others - Market size and forecast 2025-2030 ($ million)
Chart on Others - Year-over-year growth 2025-2030 (%)
Data Table on Others - Year-over-year growth 2025-2030 (%)

8.7 Market opportunity by Application

Market opportunity by Application ($ million)
Data Table on Market opportunity by Application ($ million)

9. Market Segmentation by Material

9.1 Market segments

Chart on Material - Market share 2025-2030 (%)
Data Table on Material - Market share 2025-2030 (%)

9.2 Comparison by Material

Chart on Comparison by Material
Data Table on Comparison by Material

9.3 Acrylic - Market size and forecast 2025-2030

Chart on Acrylic - Market size and forecast 2025-2030 ($ million)
Data Table on Acrylic - Market size and forecast 2025-2030 ($ million)
Chart on Acrylic - Year-over-year growth 2025-2030 (%)
Data Table on Acrylic - Year-over-year growth 2025-2030 (%)

9.4 Styrene-butadiene latex - Market size and forecast 2025-2030

Chart on Styrene-butadiene latex - Market size and forecast 2025-2030 ($ million)
Data Table on Styrene-butadiene latex - Market size and forecast 2025-2030 ($ million)
Chart on Styrene-butadiene latex - Year-over-year growth 2025-2030 (%)
Data Table on Styrene-butadiene latex - Year-over-year growth 2025-2030 (%)

9.5 Vinyl acetate polymers - Market size and forecast 2025-2030

Chart on Vinyl acetate polymers - Market size and forecast 2025-2030 ($ million)
Data Table on Vinyl acetate polymers - Market size and forecast 2025-2030 ($ million)
Chart on Vinyl acetate polymers - Year-over-year growth 2025-2030 (%)
Data Table on Vinyl acetate polymers - Year-over-year growth 2025-2030 (%)

9.6 Market opportunity by Material

Market opportunity by Material ($ million)
Data Table on Market opportunity by Material ($ million)

10. Market Segmentation by Type

10.1 Market segments

Chart on Type - Market share 2025-2030 (%)
Data Table on Type - Market share 2025-2030 (%)

10.2 Comparison by Type

Chart on Comparison by Type
Data Table on Comparison by Type

10.3 Synthetic emulsion polymers - Market size and forecast 2025-2030

Chart on Synthetic emulsion polymers - Market size and forecast 2025-2030 ($ million)
Data Table on Synthetic emulsion polymers - Market size and forecast 2025-2030 ($ million)
Chart on Synthetic emulsion polymers - Year-over-year growth 2025-2030 (%)
Data Table on Synthetic emulsion polymers - Year-over-year growth 2025-2030 (%)

10.4 Bio-based emulsion polymers - Market size and forecast 2025-2030

Chart on Bio-based emulsion polymers - Market size and forecast 2025-2030 ($ million)
Data Table on Bio-based emulsion polymers - Market size and forecast 2025-2030 ($ million)
Chart on Bio-based emulsion polymers - Year-over-year growth 2025-2030 (%)
Data Table on Bio-based emulsion polymers - Year-over-year growth 2025-2030 (%)

10.5 Market opportunity by Type

Market opportunity by Type ($ million)
Data Table on Market opportunity by Type ($ million)

11. Customer Landscape

11.1 Customer landscape overview

Analysis of price sensitivity, lifecycle, customer purchase basket, adoption rates, and purchase criteria

12. Geographic Landscape

12.1 Geographic segmentation

Chart on Market share by geography 2025-2030 (%)
Data Table on Market share by geography 2025-2030 (%)

12.2 Geographic comparison

Chart on Geographic comparison
Data Table on Geographic comparison

12.3 APAC - Market size and forecast 2025-2030

Chart on APAC - Market size and forecast 2025-2030 ($ million)
Data Table on APAC - Market size and forecast 2025-2030 ($ million)
Chart on APAC - Year-over-year growth 2025-2030 (%)
Data Table on APAC - Year-over-year growth 2025-2030 (%)
Chart on Regional Comparison - APAC
Data Table on Regional Comparison - APAC

12.3.1 China - Market size and forecast 2025-2030

Chart on China - Market size and forecast 2025-2030 ($ million)
Data Table on China - Market size and forecast 2025-2030 ($ million)
Chart on China - Year-over-year growth 2025-2030 (%)
Data Table on China - Year-over-year growth 2025-2030 (%)

12.3.2 India - Market size and forecast 2025-2030

Chart on India - Market size and forecast 2025-2030 ($ million)
Data Table on India - Market size and forecast 2025-2030 ($ million)
Chart on India - Year-over-year growth 2025-2030 (%)
Data Table on India - Year-over-year growth 2025-2030 (%)

12.3.3 Japan - Market size and forecast 2025-2030

Chart on Japan - Market size and forecast 2025-2030 ($ million)
Data Table on Japan - Market size and forecast 2025-2030 ($ million)
Chart on Japan - Year-over-year growth 2025-2030 (%)
Data Table on Japan - Year-over-year growth 2025-2030 (%)

12.3.4 South Korea - Market size and forecast 2025-2030

Chart on South Korea - Market size and forecast 2025-2030 ($ million)
Data Table on South Korea - Market size and forecast 2025-2030 ($ million)
Chart on South Korea - Year-over-year growth 2025-2030 (%)
Data Table on South Korea - Year-over-year growth 2025-2030 (%)

12.3.5 Indonesia - Market size and forecast 2025-2030

Chart on Indonesia - Market size and forecast 2025-2030 ($ million)
Data Table on Indonesia - Market size and forecast 2025-2030 ($ million)
Chart on Indonesia - Year-over-year growth 2025-2030 (%)
Data Table on Indonesia - Year-over-year growth 2025-2030 (%)

12.3.6 Australia - Market size and forecast 2025-2030

Chart on Australia - Market size and forecast 2025-2030 ($ million)
Data Table on Australia - Market size and forecast 2025-2030 ($ million)
Chart on Australia - Year-over-year growth 2025-2030 (%)
Data Table on Australia - Year-over-year growth 2025-2030 (%)

12.4 North America - Market size and forecast 2025-2030

Chart on North America - Market size and forecast 2025-2030 ($ million)
Data Table on North America - Market size and forecast 2025-2030 ($ million)
Chart on North America - Year-over-year growth 2025-2030 (%)
Data Table on North America - Year-over-year growth 2025-2030 (%)
Chart on Regional Comparison - North America
Data Table on Regional Comparison - North America

12.4.1 US - Market size and forecast 2025-2030

Chart on US - Market size and forecast 2025-2030 ($ million)
Data Table on US - Market size and forecast 2025-2030 ($ million)
Chart on US - Year-over-year growth 2025-2030 (%)
Data Table on US - Year-over-year growth 2025-2030 (%)

12.4.2 Canada - Market size and forecast 2025-2030

Chart on Canada - Market size and forecast 2025-2030 ($ million)
Data Table on Canada - Market size and forecast 2025-2030 ($ million)
Chart on Canada - Year-over-year growth 2025-2030 (%)
Data Table on Canada - Year-over-year growth 2025-2030 (%)

12.4.3 Mexico - Market size and forecast 2025-2030

Chart on Mexico - Market size and forecast 2025-2030 ($ million)
Data Table on Mexico - Market size and forecast 2025-2030 ($ million)
Chart on Mexico - Year-over-year growth 2025-2030 (%)
Data Table on Mexico - Year-over-year growth 2025-2030 (%)

12.5 Europe - Market size and forecast 2025-2030

Chart on Europe - Market size and forecast 2025-2030 ($ million)
Data Table on Europe - Market size and forecast 2025-2030 ($ million)
Chart on Europe - Year-over-year growth 2025-2030 (%)
Data Table on Europe - Year-over-year growth 2025-2030 (%)
Chart on Regional Comparison - Europe
Data Table on Regional Comparison - Europe

12.5.1 Germany - Market size and forecast 2025-2030

Chart on Germany - Market size and forecast 2025-2030 ($ million)
Data Table on Germany - Market size and forecast 2025-2030 ($ million)
Chart on Germany - Year-over-year growth 2025-2030 (%)
Data Table on Germany - Year-over-year growth 2025-2030 (%)

12.5.2 France - Market size and forecast 2025-2030

Chart on France - Market size and forecast 2025-2030 ($ million)
Data Table on France - Market size and forecast 2025-2030 ($ million)
Chart on France - Year-over-year growth 2025-2030 (%)
Data Table on France - Year-over-year growth 2025-2030 (%)

12.5.3 UK - Market size and forecast 2025-2030

Chart on UK - Market size and forecast 2025-2030 ($ million)
Data Table on UK - Market size and forecast 2025-2030 ($ million)
Chart on UK - Year-over-year growth 2025-2030 (%)
Data Table on UK - Year-over-year growth 2025-2030 (%)

12.5.4 Italy - Market size and forecast 2025-2030

Chart on Italy - Market size and forecast 2025-2030 ($ million)
Data Table on Italy - Market size and forecast 2025-2030 ($ million)
Chart on Italy - Year-over-year growth 2025-2030 (%)
Data Table on Italy - Year-over-year growth 2025-2030 (%)

12.5.5 Spain - Market size and forecast 2025-2030

Chart on Spain - Market size and forecast 2025-2030 ($ million)
Data Table on Spain - Market size and forecast 2025-2030 ($ million)
Chart on Spain - Year-over-year growth 2025-2030 (%)
Data Table on Spain - Year-over-year growth 2025-2030 (%)

12.5.6 The Netherlands - Market size and forecast 2025-2030

Chart on The Netherlands - Market size and forecast 2025-2030 ($ million)
Data Table on The Netherlands - Market size and forecast 2025-2030 ($ million)
Chart on The Netherlands - Year-over-year growth 2025-2030 (%)
Data Table on The Netherlands - Year-over-year growth 2025-2030 (%)

12.6 South America - Market size and forecast 2025-2030

Chart on South America - Market size and forecast 2025-2030 ($ million)
Data Table on South America - Market size and forecast 2025-2030 ($ million)
Chart on South America - Year-over-year growth 2025-2030 (%)
Data Table on South America - Year-over-year growth 2025-2030 (%)
Chart on Regional Comparison - South America
Data Table on Regional Comparison - South America

12.6.1 Brazil - Market size and forecast 2025-2030

Chart on Brazil - Market size and forecast 2025-2030 ($ million)
Data Table on Brazil - Market size and forecast 2025-2030 ($ million)
Chart on Brazil - Year-over-year growth 2025-2030 (%)
Data Table on Brazil - Year-over-year growth 2025-2030 (%)

12.6.2 Argentina - Market size and forecast 2025-2030

Chart on Argentina - Market size and forecast 2025-2030 ($ million)
Data Table on Argentina - Market size and forecast 2025-2030 ($ million)
Chart on Argentina - Year-over-year growth 2025-2030 (%)
Data Table on Argentina - Year-over-year growth 2025-2030 (%)

12.6.3 Chile - Market size and forecast 2025-2030

Chart on Chile - Market size and forecast 2025-2030 ($ million)
Data Table on Chile - Market size and forecast 2025-2030 ($ million)
Chart on Chile - Year-over-year growth 2025-2030 (%)
Data Table on Chile - Year-over-year growth 2025-2030 (%)

12.7 Middle East and Africa - Market size and forecast 2025-2030

Chart on Middle East and Africa - Market size and forecast 2025-2030 ($ million)
Data Table on Middle East and Africa - Market size and forecast 2025-2030 ($ million)
Chart on Middle East and Africa - Year-over-year growth 2025-2030 (%)
Data Table on Middle East and Africa - Year-over-year growth 2025-2030 (%)
Chart on Regional Comparison - Middle East and Africa
Data Table on Regional Comparison - Middle East and Africa

12.7.1 Saudi Arabia - Market size and forecast 2025-2030

Chart on Saudi Arabia - Market size and forecast 2025-2030 ($ million)
Data Table on Saudi Arabia - Market size and forecast 2025-2030 ($ million)
Chart on Saudi Arabia - Year-over-year growth 2025-2030 (%)
Data Table on Saudi Arabia - Year-over-year growth 2025-2030 (%)

12.7.2 UAE - Market size and forecast 2025-2030

Chart on UAE - Market size and forecast 2025-2030 ($ million)
Data Table on UAE - Market size and forecast 2025-2030 ($ million)
Chart on UAE - Year-over-year growth 2025-2030 (%)
Data Table on UAE - Year-over-year growth 2025-2030 (%)

12.7.3 Turkey - Market size and forecast 2025-2030

Chart on Turkey - Market size and forecast 2025-2030 ($ million)
Data Table on Turkey - Market size and forecast 2025-2030 ($ million)
Chart on Turkey - Year-over-year growth 2025-2030 (%)
Data Table on Turkey - Year-over-year growth 2025-2030 (%)

12.7.4 South Africa - Market size and forecast 2025-2030

Chart on South Africa - Market size and forecast 2025-2030 ($ million)
Data Table on South Africa - Market size and forecast 2025-2030 ($ million)
Chart on South Africa - Year-over-year growth 2025-2030 (%)
Data Table on South Africa - Year-over-year growth 2025-2030 (%)

12.7.5 Israel - Market size and forecast 2025-2030

Chart on Israel - Market size and forecast 2025-2030 ($ million)
Data Table on Israel - Market size and forecast 2025-2030 ($ million)
Chart on Israel - Year-over-year growth 2025-2030 (%)
Data Table on Israel - Year-over-year growth 2025-2030 (%)

12.8 Market opportunity by geography

Market opportunity by geography ($ million)
Data Tables on Market opportunity by geography ($ million)

13. Drivers, Challenges, and Opportunity

13.1 Market drivers

Growing demand from paints and coatings applications
Increasing consumption across adhesives and packaging ecosystem
Rising adoption in construction and building materials sector

13.2 Market challenges

Raw material price volatility and feedstock dependence
Stringent environmental compliance and regulatory burden
Supply chain disruptions and logistics constraints

13.3 Impact of drivers and challenges

Impact of drivers and challenges in 2025 and 2030

13.4 Market opportunities

Shift toward bio-based and renewable raw material integration
Growing adoption of digital manufacturing and data-driven process management
Expanding focus on customized and application-specific polymer formulations

14. Competitive Landscape

14.1 Overview

14.2

Overview on criticality of inputs and factors of differentiation

14.3 Landscape disruption

Overview on factors of disruption

14.4 Industry risks

Impact of key risks on business

15. Competitive Analysis

15.1 Companies profiled

Companies covered

15.2 Company ranking index

15.3 Market positioning of companies

Matrix on companies position and classification

15.4 Apcotex Industries Ltd.

Apcotex Industries Ltd. - Overview
Apcotex Industries Ltd. - Business segments
Apcotex Industries Ltd. - Key offerings
Apcotex Industries Ltd. - Segment focus
SWOT

15.5 Arkema Group

Arkema Group - Overview
Arkema Group - Business segments
Arkema Group - Key news
Arkema Group - Key offerings
Arkema Group - Segment focus
SWOT

15.6 Asahi Kasei Corp.

Asahi Kasei Corp. - Overview
Asahi Kasei Corp. - Business segments
Asahi Kasei Corp. - Key news
Asahi Kasei Corp. - Key offerings
Asahi Kasei Corp. - Segment focus
SWOT

15.7 BASF SE

BASF SE - Overview
BASF SE - Business segments
BASF SE - Key news
BASF SE - Key offerings
BASF SE - Segment focus
SWOT

15.8 Celanese Corp.

Celanese Corp. - Overview
Celanese Corp. - Business segments
Celanese Corp. - Key offerings
Celanese Corp. - Segment focus
SWOT

15.9 Covestro AG

Covestro AG - Overview
Covestro AG - Business segments
Covestro AG - Key news
Covestro AG - Key offerings
Covestro AG - Segment focus
SWOT

15.10 DIC Corp.

DIC Corp. - Overview
DIC Corp. - Business segments
DIC Corp. - Key news
DIC Corp. - Key offerings
DIC Corp. - Segment focus
SWOT

15.11 Dow Chemical Co.

Dow Chemical Co. - Overview
Dow Chemical Co. - Business segments
Dow Chemical Co. - Key news
Dow Chemical Co. - Key offerings
Dow Chemical Co. - Segment focus
SWOT

15.12 EOC Group

EOC Group - Overview
EOC Group - Product / Service
EOC Group - Key offerings
SWOT

15.13 JSR Corp.

JSR Corp. - Overview
JSR Corp. - Business segments
JSR Corp. - Key offerings
JSR Corp. - Segment focus
SWOT

15.14 Scott Bader Co. Ltd.

Scott Bader Co. Ltd. - Overview
Scott Bader Co. Ltd. - Product / Service
Scott Bader Co. Ltd. - Key offerings
SWOT

15.15 Synthomer Plc

Synthomer Plc - Overview
Synthomer Plc - Business segments
Synthomer Plc - Key offerings
Synthomer Plc - Segment focus
SWOT

15.16 The Lubrizol Corp.

The Lubrizol Corp. - Overview
The Lubrizol Corp. - Product / Service
The Lubrizol Corp. - Key offerings
SWOT

15.17 Wacker Chemie AG

Wacker Chemie AG - Overview
Wacker Chemie AG - Business segments
Wacker Chemie AG - Key offerings
Wacker Chemie AG - Segment focus
SWOT

15.18 Zeon Corp.

Zeon Corp. - Overview
Zeon Corp. - Business segments
Zeon Corp. - Key offerings
Zeon Corp. - Segment focus
SWOT

16. Appendix

16.1 Scope of the report

Market definition
Objectives
Notes and caveats

16.2 Inclusions and exclusions checklist

Inclusions checklist
Exclusions checklist

16.3 Currency conversion rates for US$

16.4 Research methodology

16.5 Data procurement

Information sources

16.6 Data validation

16.7 Validation techniques employed for market sizing

16.8 Data synthesis

16.9 360 degree market analysis

16.10 List of abbreviations

Research Methodology

Technavio presents a detailed picture of the market by way of study, synthesis, and summation of data from multiple sources. The analysts have presented the various facets of the market with a particular focus on identifying the key industry influencers. The data thus presented is comprehensive, reliable, and the result of extensive research, both primary and secondary.

INFORMATION SOURCES

Primary sources

  • Manufacturers and suppliers
  • Channel partners
  • Industry experts
  • Strategic decision makers

Secondary sources

  • Industry journals and periodicals
  • Government data
  • Financial reports of key industry players
  • Historical data
  • Press releases

DATA ANALYSIS

Data Synthesis

  • Collation of data
  • Estimation of key figures
  • Analysis of derived insights

Data Validation

  • Triangulation with data models
  • Reference against proprietary databases
  • Corroboration with industry experts

REPORT WRITING

Qualitative

  • Market drivers
  • Market challenges
  • Market trends
  • Five forces analysis

Quantitative

  • Market size and forecast
  • Market segmentation
  • Geographical insights
  • Competitive landscape

Interested in this report?

Get your sample now to see our research methodology and insights!

Download Now

Frequently Asked Questions

Emulsion Polymers market growth will increase by USD 16501.0 million during 2026-2030.

The Emulsion Polymers market is expected to grow at a CAGR of 7.4% during 2026-2030.

Emulsion Polymers market is segmented by Application (Paints and coatings, Paper and paperboard coatings, Adhesives, Others) Material (Acrylic, Styrene-butadiene latex, Vinyl acetate polymers) Type (Synthetic emulsion polymers, Bio-based emulsion polymers)

Alberdingk Boley GmbH, Allnex GMBH, Apcotex Industries Ltd., Arkema Group, Asahi Kasei Corp., BASF SE, Celanese Corp., Covestro AG, DIC Corp., Dow Chemical Co., EOC Group, JSR Corp., Polynt SpA, Scott Bader Co. Ltd., Synthomer Plc, The Lubrizol Corp., Trinseo PLC, Vinavil S.p.A., Wacker Chemie AG, Zeon Corp. are a few of the key vendors in the Emulsion Polymers market.

APAC will register the highest growth rate of 50.8% among the other regions. Therefore, the Emulsion Polymers market in APAC is expected to garner significant business opportunities for the vendors during the forecast period.

China, India, Japan, South Korea, Indonesia, Australia, US, Canada, Mexico, Germany, France, UK, Italy, Spain, The Netherlands, Brazil, Argentina, Chile, Saudi Arabia, UAE, Turkey, South Africa, Israel

  • Growing demand from paints and coatings applications is the driving factor this market.

The Emulsion Polymers market vendors should focus on grabbing business opportunities from the Application segment as it accounted for the largest market share in the base year.
RIA - Research AI Assistant
Ask RIA
