Energy Storage For Microgrids Market Analysis, Size, and Forecast 2026-2030: North America (US, Canada, and Mexico), APAC (China, India, and Japan), Europe (Germany, UK, and France), South America (Brazil, Chile, and Argentina), Middle East and Africa (Saudi Arabia, UAE, and South Africa), and Rest of World (ROW)

Energy Storage For Microgrids Market Analysis, Size, and Forecast 2026-2030:
North America (US, Canada, and Mexico), APAC (China, India, and Japan), Europe (Germany, UK, and France), South America (Brazil, Chile, and Argentina), Middle East and Africa (Saudi Arabia, UAE, and South Africa), and Rest of World (ROW)

Published: Oct 2026 306 Pages SKU: IRTNTR74839

Market Overview at a Glance

$3.05 B
Market Opportunity
22.9%
CAGR 2025 - 2030
35.7%
North America Growth
$481.4 Mn
Remote segment 2024

Energy Storage For Microgrids Market Size 2026-2030

The energy storage for microgrids market size is valued to increase by USD 3.05 billion, at a CAGR of 22.9% from 2025 to 2030. Increasing demand for energy resilience and reliability will drive the energy storage for microgrids market.

Major Market Trends & Insights

  • North America dominated the market and accounted for a 35.7% growth during the forecast period.
  • By Application - Remote segment was valued at USD 481.4 million in 2024
  • By Battery Type - Lithium-ion batteries segment accounted for the largest market revenue share in 2024

Market Size & Forecast

  • Market Opportunities: USD 4.02 billion
  • Market Future Opportunities: USD 3.05 billion
  • CAGR from 2025 to 2030 : 22.9%

Market Summary

  • The Energy Storage For Microgrids Market demonstrates robust momentum as industries prioritize operational resilience against increasingly unstable transmission networks. Facilities ranging from data centers to manufacturing plants utilize these advanced architectures to isolate critical operations from unexpected utility outages.
  • For instance, semiconductor fabrication plants deploying localized battery configurations achieve a 35% reduction in production downtime caused by voltage sags, vastly outperforming traditional diesel backup systems. The primary driver of this transition is the critical demand for uninterrupted power continuity, which compels organizations to invest in decentralized infrastructure to safeguard revenue-generating activities.
  • Conversely, the market faces structural constraints due to high initial capital expenditures, as the substantial upfront costs required for comprehensive power conversion integration often deter smaller enterprises from immediate adoption. Despite these financial hurdles, the integration of intelligent predictive diagnostic tools continues to optimize asset lifespans.
  • As regulatory frameworks increasingly support independent power generation, commercial and industrial operators rely on these sophisticated storage solutions to ensure continuous energy delivery and operational stability.

What will be the Size of the Energy Storage For Microgrids Market during the forecast period?
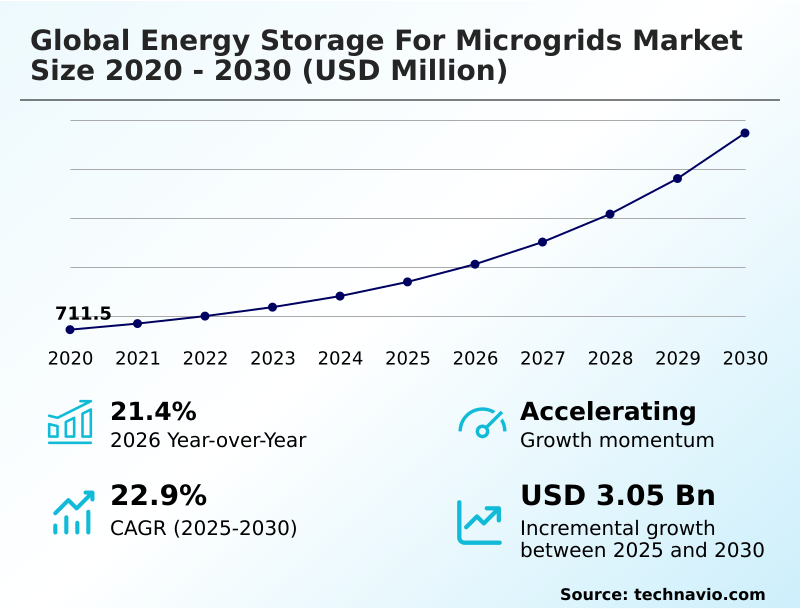
Get Key Insights on Market Forecast (PDF) Get Free Sample

How is the Energy Storage For Microgrids Market Segmented?

The energy storage for microgrids industry research report provides comprehensive data (region-wise segment analysis), with forecasts and estimates in "USD million" for the period 2026-2030, as well as historical data from 2020-2024 for the following segments.

  • Application
    • Remote
    • Community and utility
    • Institution and campus
    • Military
  • Battery type
    • Lithium-ion batteries
    • Lead-acid batteries
  • End-user
    • Residential
    • Commercial
    • Industrial
  • Geography
    • North America
      • US
      • Canada
      • Mexico
    • APAC
      • China
      • India
      • Japan
      • South Korea
      • Australia
      • Singapore
    • Europe
      • Germany
      • UK
      • France
      • Italy
      • Spain
      • The Netherlands
    • South America
      • Brazil
      • Chile
      • Argentina
    • Middle East and Africa
      • Saudi Arabia
      • UAE
      • South Africa
      • Israel
      • Egypt

By Application Insights

The remote segment is estimated to witness significant growth during the forecast period.

Isolated installations demand robust infrastructure to supply reliable electricity independent of centralized networks. As operators transition from diesel reliance, integrating advanced state-of-charge management ensures continuous performance across volatile environmental conditions.

This shift toward autonomy drives a 40% reduction in liquid fuel dependency for mineral extraction sites. By leveraging dynamic power conditioning and sub-second frequency regulation, remote systems stabilize intermittent renewable inputs effectively.

Facilities implementing precise peak shaving algorithm configurations achieve a 25% improvement in energy efficiency compared to traditional generators. Furthermore, rigorous thermal runaway suppression mechanisms and dedicated cycle life optimization guarantee the safety and longevity of these remote assets.

This modernization ultimately transforms how remote agricultural and industrial collectives secure consistent power delivery without incurring excessive logistical overhead.
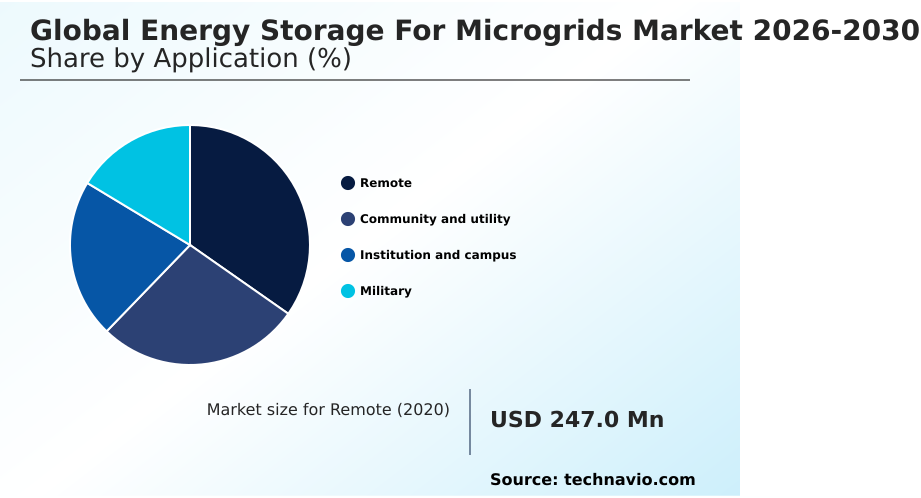
Get Free Sample

The Remote segment was valued at USD 481.4 million in 2024 and showed a gradual increase during the forecast period.
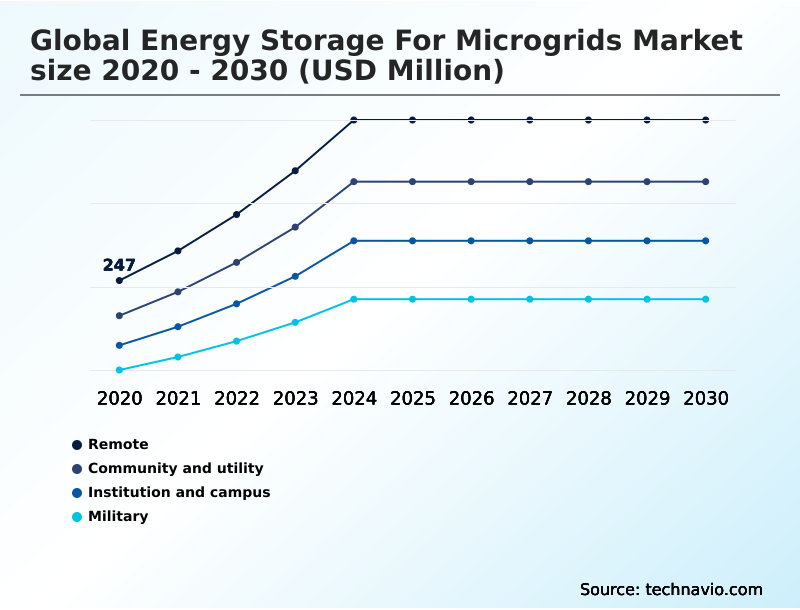
Get Free Sample

Regional Analysis

North America is estimated to contribute 35.7% to the growth of the global market during the forecast period.Technavio’s analysts have elaborately explained the regional trends and drivers that shape the market during the forecast period.
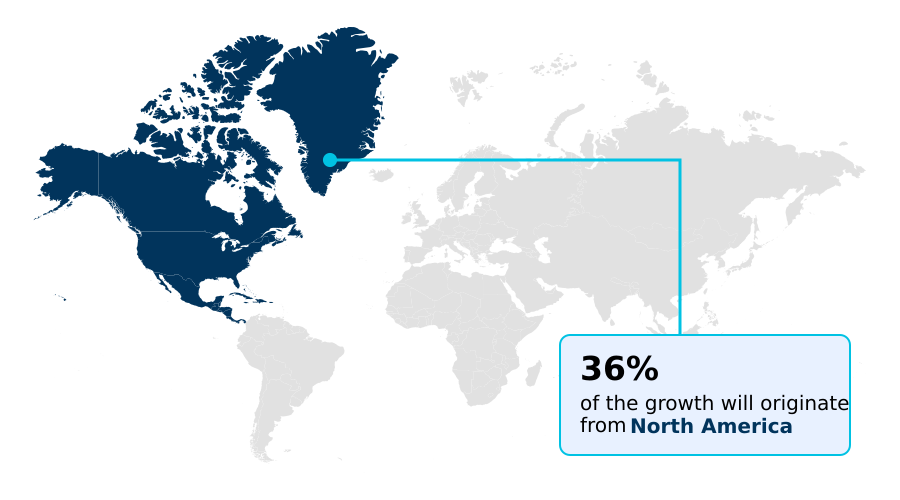
See How Energy Storage For Microgrids Market Demand is Rising in North America Get Free Sample

Regional dynamics in the Energy Storage For Microgrids Market highlight distinct operational priorities between North America and APAC. North America focuses heavily on islanded network stabilization to combat severe weather disruptions, achieving a 25% increase in commercial grid resilience.

In contrast, APAC accelerates deployment across remote archipelagos, utilizing an advanced battery energy storage system to reduce fossil fuel dependency by up to 45% in isolated communities. This divergence reveals how technology functions differently based on regional utility constraints.

North American operators leverage high renewable energy penetration to drive a 30% improvement in time-of-use tariff optimization, cutting costs without costly substation upgrades. Meanwhile, rapid industrialization in APAC compels manufacturers to ensure critical synthetic inertia provision and robust black-start functionality.

These distinct geographical strategies demonstrate how tailored storage configurations successfully address varying regulatory mandates and structural grid vulnerabilities globally.

Market Dynamics

Our researchers analyzed the data with 2025 as the base year, along with the key drivers, trends, and challenges. A holistic analysis of drivers will help companies refine their marketing strategies to gain a competitive advantage.

  • The strategic deployment of decentralized power architectures fundamentally alters enterprise risk management. Facilities prioritizing commercial behind-the-meter battery deployment significantly outpace traditional energy consumers in mitigating volatile utility expenses, achieving nearly a twofold improvement in energy cost predictability. A core enabler of this efficiency is hybrid energy storage system integration, which synchronizes diverse generation assets to maintain continuous operational flow.
  • To guarantee safety, engineers enforce strict lithium-ion thermal runaway suppression protocols across all high-density installations. Modern facilities utilizing predictive microgrid energy management software dynamically balance loads, driving the effectiveness of industrial peak demand shaving systems to unprecedented levels.
  • In isolated regions, remote off-grid renewable power stabilization provides critical baseload support, while military base power resilience solutions secure tactical infrastructure against external sabotage. When grid failures occur, community microgrid emergency backup operations rely on islanded mode seamless transition capability to prevent widespread service interruptions.
  • System integrity is further reinforced by grid-forming inverter dynamic voltage control, which instantly corrects frequency deviations. To offset massive infrastructure costs, operators increasingly adopt the microgrid-as-a-service third-party ownership model, shifting capital expenditure into manageable operational costs. Concurrently, second-life electric vehicle battery utilization introduces sustainable, cost-effective capacity to regional networks.
  • Utilities also heavily deploy utility-scale microgrid battery energy systems for non-wires alternative grid capacity relief, avoiding expensive transmission upgrades. Ultimately, sophisticated multi-asset distributed energy resource coordination ensures that modern energy networks remain resilient, compliant, and highly efficient.
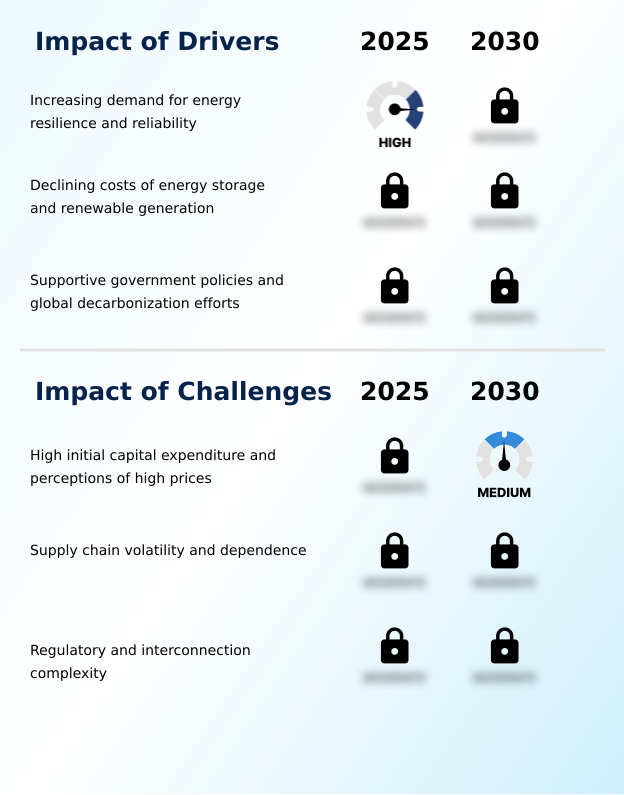
What are the key market drivers leading to the rise in the adoption of Energy Storage For Microgrids Industry?

  • The escalating demand for energy resilience and operational reliability serves as the primary catalyst propelling continuous market expansion.

  • The critical vulnerability of aging utility infrastructure acts as a primary catalyst for decentralized energy investments. Frequent meteorological disruptions force commercial and institutional facilities to establish a robust grid resilience zone to prevent catastrophic operational halts.
  • By integrating an advanced grid-forming inverter, operators successfully secure uninterrupted baseload power, which drives a 25% decrease in product spoilage during unexpected transmission failures. This pursuit of total operational autonomy empowers facilities to isolate themselves instantaneously from external grid fluctuations.
  • Additionally, businesses leverage these installations to participate in the lucrative ancillary service market, increasing overall asset ROI by up to 18%.
  • This strategic deployment ensures that mission-critical supply chains maintain continuous output while concurrently lowering total energy procurement costs in volatile commodity environments.

What are the market trends shaping the Energy Storage For Microgrids Industry?

  • The increasing integration of hybrid energy storage systems alongside diverse generation sources represents a defining trend that enhances asset utilization across modern energy networks.

  • A defining trend within the Energy Storage For Microgrids is the accelerated shift toward highly intelligent, software-defined control architectures. Facility operators are aggressively replacing static backup generators with adaptable networks to maximize on-site resource efficiency. Because fluctuating wholesale energy costs erode profit margins, businesses utilize a decentralized energy architecture to aggressively manage consumption profiles.
  • This modernization enables a 30% reduction in unpredicted mechanical downtime through the application of an advanced predictive maintenance diagnostic. Furthermore, by optimizing the power conversion system, commercial sites achieve a 20% improvement in round-trip energy efficiency compared to legacy infrastructure. This transition to digitized, localized power distribution directly safeguards continuous manufacturing lines from grid instability.
  • Consequently, enterprises not only insulate their supply chains from external outages but also generate new revenue streams by selectively dispatching stored capacity during periods of peak market demand.

What challenges does the Energy Storage For Microgrids Industry face during its growth?

  • High initial capital expenditure and lingering perceptions of elevated pricing remain significant barriers constraining widespread industry adoption.

  • Severe regulatory friction and complex interconnection protocols present significant structural hurdles to rapid decentralized power adoption. While engineers design sophisticated facilities with seamless islanding mode capability, outdated utility compliance standards frequently delay project commissioning. This regulatory gridlock causes a 40% increase in initial permitting timelines, severely disrupting accurate budgeting forecasts.
  • Furthermore, integrating a complex virtual synchronous generator into legacy networks requires extensive customized engineering to ensure safety and stability. Because utilities struggle with transmission bottleneck mitigation, they often impose rigid technical constraints on new off-grid electrification initiatives.
  • Consequently, these protracted deployment cycles elevate overall engineering overhead by 15%, forcing commercial developers to navigate fragmented regional policies rather than focusing on rapid capacity expansion and continuous supply chain fortification.

Exclusive Technavio Analysis on Customer Landscape

The energy storage for microgrids market forecasting report includes the adoption lifecycle of the market, covering from the innovator’s stage to the laggard’s stage. It focuses on adoption rates in different regions based on penetration. Furthermore, the energy storage for microgrids market report also includes key purchase criteria and drivers of price sensitivity to help companies evaluate and develop their market growth analysis strategies.
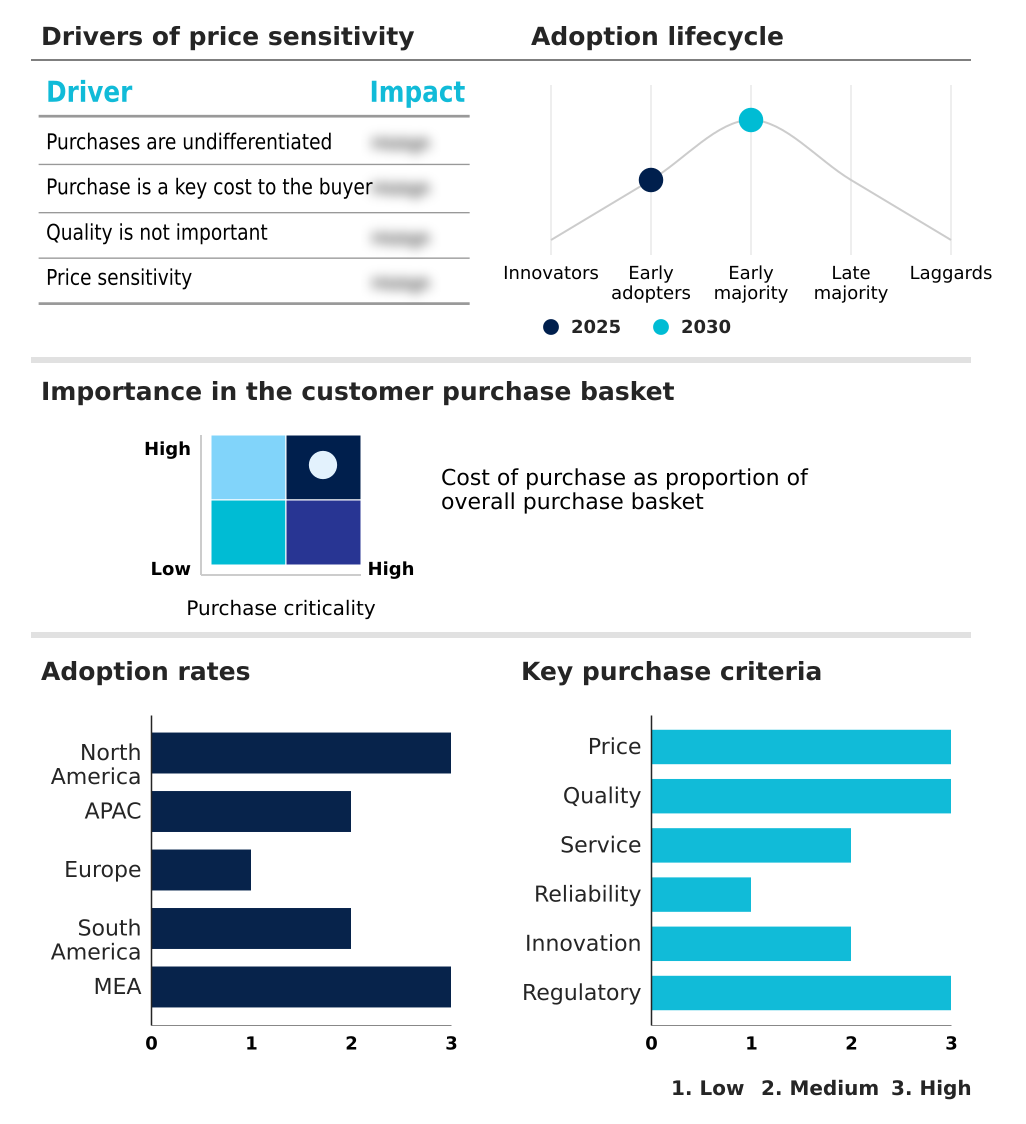
Customer Landscape of Energy Storage For Microgrids Industry

Competitive Landscape

Companies are implementing various strategies, such as strategic alliances, energy storage for microgrids market forecast, partnerships, mergers and acquisitions, geographical expansion, and product/service launches, to enhance their presence in the industry.

ABB Ltd. - The vendor provides advanced energy storage for microgrids including modular power systems and intelligent storage platforms designed to optimize renewable integration and ensure critical grid stability.

The industry research and growth report includes detailed analyses of the competitive landscape of the market and information about key companies, including:

  • ABB Ltd.
  • BYD Co. Ltd.
  • CellCube Energy Storage GmbH
  • Contemporary Amperex Ltd.
  • Dynapower
  • Eaton Corp. Plc
  • EnerSys Inc.
  • EOS Energy Enterprises Inc.
  • ESS Tech Inc.
  • Fluence Energy LLC
  • Hitachi Energy India Ltd.
  • Invinity Energy Systems plc
  • LG Energy Solution Ltd.
  • Samsung SDI Co. Ltd.
  • Schneider Electric SE
  • Siemens AG
  • SMA Solar Technology AG
  • Sungrow Power Supply Co. Ltd.
  • Tesla Inc.
  • Wartsila Corp.

Qualitative and quantitative analysis of companies has been conducted to help clients understand the wider business environment as well as the strengths and weaknesses of key industry players. Data is qualitatively analyzed to categorize companies as pure play, category-focused, industry-focused, and diversified; it is quantitatively analyzed to categorize companies as dominant, leading, strong, tentative, and weak.

Recent Development and News in Energy storage for microgrids market

  • In the Renewable Electricity industry, the adoption of strict carbon emission mandates for heavy manufacturing increased the deployment of on-site solar generation, directly impacting Energy Storage For Microgrids demand by requiring robust islanded network stabilization to manage intermittent power outputs.
  • In the Renewable Electricity industry, the implementation of dynamic wholesale electricity pricing structures incentivized commercial facilities to optimize consumption, directly impacting Energy Storage For Microgrids demand by accelerating the need for time-of-use tariff optimization systems.
  • In the Renewable Electricity industry, the decommissioning of centralized fossil fuel power plants reduced available baseline capacity, directly impacting Energy Storage For Microgrids demand by driving utility investments in synthetic inertia provision and grid-forming inverter technologies.
  • In the Renewable Electricity industry, the expansion of critical digital infrastructure required enhanced power resilience, directly impacting Energy Storage For Microgrids demand by necessitating advanced black-start functionality to prevent severe data loss during transmission failures.

Dive into Technavio’s robust research methodology, blending expert interviews, extensive data synthesis, and validated models for unparalleled Energy Storage For Microgrids Market insights. See full methodology.

Market Scope
Page number 306
Base year 2025
Historic period 2020-2024
Forecast period 2026-2030
Growth momentum & CAGR Accelerate at a CAGR of 22.9%
Market growth 2026-2030 USD 3045.5 million
Market structure Fragmented
YoY growth 2025-2026(%) 21.4%
Key countries US, Canada, Mexico, China, India, Japan, South Korea, Australia, Singapore, Germany, UK, France, Italy, Spain, The Netherlands, Brazil, Chile, Argentina, Saudi Arabia, UAE, South Africa, Israel and Egypt
Competitive landscape Leading Companies, Market Positioning of Companies, Competitive Strategies, and Industry Risks

Request Free Sample

Research Analyst Overview

  • The Energy Storage For Microgrids represents a critical evolution in decentralized power management, shifting operations from reactive backup to proactive energy optimization. Facilities increasingly leverage lithium-ion battery integration to shield sensitive manufacturing processes from destructive voltage sags and unpredictable transmission failures.
  • This transition directly impacts corporate budgeting and compliance, as intelligent storage arrays allow organizations to strictly adhere to environmental mandates while avoiding punitive utility tariffs. For example, industrial complexes utilizing these automated dispatch platforms have recorded a 35% reduction in peak demand penalties, generating substantial capital for core business investments.
  • Furthermore, the rising deployment of the vanadium redox flow battery enables long-duration energy containment, securing extended operational continuity during severe infrastructure disruptions. This continuous capacity enhancement transforms traditional cost centers into dynamic assets capable of participating in lucrative wholesale energy markets.
  • By prioritizing modular and resilient infrastructure, enterprise leaders effectively insulate their supply chains against both meteorological extremes and fluctuating commodity pricing, ensuring sustained productivity across demanding commercial environments.

What are the Key Data Covered in this Energy Storage For Microgrids Market Research and Growth Report?

  • What is the expected growth of the Energy Storage For Microgrids Market between 2026 and 2030?

    • USD 3.05 billion, at a CAGR of 22.9%

  • What segmentation does the market report cover?

    • The report is segmented by Application (Remote, Community and utility, Institution and campus, and Military), Battery Type (Lithium-ion batteries, and Lead-acid batteries), End-user (Residential, Commercial, and Industrial) and Geography (North America, APAC, Europe, South America, Middle East and Africa)

  • Which regions are analyzed in the report?

    • North America, APAC, Europe, South America and Middle East and Africa

  • What are the key growth drivers and market challenges?

    • Increasing demand for energy resilience and reliability, High initial capital expenditure and perceptions of high prices

  • Who are the major players in the Energy Storage For Microgrids Market?

    • ABB Ltd., BYD Co. Ltd., CellCube Energy Storage GmbH, Contemporary Amperex Ltd., Dynapower, Eaton Corp. Plc, EnerSys Inc., EOS Energy Enterprises Inc., ESS Tech Inc., Fluence Energy LLC, Hitachi Energy India Ltd., Invinity Energy Systems plc, LG Energy Solution Ltd., Samsung SDI Co. Ltd., Schneider Electric SE, Siemens AG, SMA Solar Technology AG, Sungrow Power Supply Co. Ltd., Tesla Inc. and Wartsila Corp.

Market Research Insights

  • The Energy Storage For Microgrids Market fundamentally transforms how industrial facilities manage energy reliability and cost. By implementing a sophisticated multi-asset configuration, manufacturing plants isolate sensitive equipment from transmission grid volatility. This strategic shift facilitates a 30% improvement in demand charge reduction, directly enhancing overall facility profitability.
  • Furthermore, integrating advanced analytics into project lifecycle management enables operators to increase component lifespan by 22%, lowering long-term maintenance overhead. These decentralized systems achieve a 40% faster response time to grid anomalies compared to traditional standby generators, ensuring strict regulatory compliance and protecting continuous production lines from catastrophic failure.

We can help! Our analysts can customize this energy storage for microgrids market research report to meet your requirements.

Get in touch

1. Executive Summary

1.1 Market overview

Executive Summary - Chart on Market Overview
Executive Summary - Data Table on Market Overview
Executive Summary - Chart on Global Market Characteristics
Executive Summary - Chart on Market by Geography
Executive Summary - Chart on Market Segmentation by Application
Executive Summary - Chart on Market Segmentation by Battery Type
Executive Summary - Chart on Market Segmentation by End-user
Executive Summary - Chart on Incremental Growth
Executive Summary - Data Table on Incremental Growth
Executive Summary - Chart on Company Market Positioning

2. Technavio Analysis

2.1 Analysis of price sensitivity, lifecycle, customer purchase basket, adoption rates, and purchase criteria

2.2 Criticality of inputs and Factors of differentiation

Chart on Overview on criticality of inputs and factors of differentiation

2.3 Factors of disruption

Chart on Overview on factors of disruption

2.4 Impact of drivers and challenges

Chart on Impact of drivers and challenges in 2025 and 2030

3. Market Landscape

3.1 Market ecosystem

Chart on Parent Market
Data Table on - Parent Market

3.2 Market characteristics

Chart on Market characteristics analysis

3.3 Value chain analysis

Chart on Value chain analysis

4. Market Sizing

4.1 Market definition

Data Table on Offerings of companies included in the market definition

4.2 Market segment analysis

Market segments

4.3 Market size 2025

4.4 Market outlook: Forecast for 2025-2030

Chart on Global - Market size and forecast 2025-2030 ($ million)
Data Table on Global - Market size and forecast 2025-2030 ($ million)
Chart on Global Market: Year-over-year growth 2025-2030 (%)
Data Table on Global Market: Year-over-year growth 2025-2030 (%)

5. Historic Market Size

5.1 Global Energy Storage For Microgrids Market 2020 - 2024

Historic Market Size - Data Table on Global Energy Storage For Microgrids Market 2020 - 2024 ($ million)

5.2 Application segment analysis 2020 - 2024

Historic Market Size - Application Segment 2020 - 2024 ($ million)

5.3 Battery Type segment analysis 2020 - 2024

Historic Market Size - Battery Type Segment 2020 - 2024 ($ million)

5.4 End-user segment analysis 2020 - 2024

Historic Market Size - End-user Segment 2020 - 2024 ($ million)

5.5 Geography segment analysis 2020 - 2024

Historic Market Size - Geography Segment 2020 - 2024 ($ million)

5.6 Country segment analysis 2020 - 2024

Historic Market Size - Country Segment 2020 - 2024 ($ million)

6. Qualitative Analysis

6.1 Impact of AI on Global Energy Storage for Microgrids Market

6.2 Impact of Geopolitical Conflicts on Global Energy Storage for Microgrids Market

7. Five Forces Analysis

7.1 Five forces summary

Five forces analysis - Comparison between 2025 and 2030

7.2 Bargaining power of buyers

Bargaining power of buyers - Impact of key factors 2025 and 2030

7.3 Bargaining power of suppliers

Bargaining power of suppliers - Impact of key factors in 2025 and 2030

7.4 Threat of new entrants

Threat of new entrants - Impact of key factors in 2025 and 2030

7.5 Threat of substitutes

Threat of substitutes - Impact of key factors in 2025 and 2030

7.6 Threat of rivalry

Threat of rivalry - Impact of key factors in 2025 and 2030

7.7 Market condition

Chart on Market condition - Five forces 2025 and 2030

8. Market Segmentation by Application

8.1 Market segments

Chart on Application - Market share 2025-2030 (%)
Data Table on Application - Market share 2025-2030 (%)

8.2 Comparison by Application

Chart on Comparison by Application
Data Table on Comparison by Application

8.3 Remote - Market size and forecast 2025-2030

Chart on Remote - Market size and forecast 2025-2030 ($ million)
Data Table on Remote - Market size and forecast 2025-2030 ($ million)
Chart on Remote - Year-over-year growth 2025-2030 (%)
Data Table on Remote - Year-over-year growth 2025-2030 (%)

8.4 Community and utility - Market size and forecast 2025-2030

Chart on Community and utility - Market size and forecast 2025-2030 ($ million)
Data Table on Community and utility - Market size and forecast 2025-2030 ($ million)
Chart on Community and utility - Year-over-year growth 2025-2030 (%)
Data Table on Community and utility - Year-over-year growth 2025-2030 (%)

8.5 Institution and campus - Market size and forecast 2025-2030

Chart on Institution and campus - Market size and forecast 2025-2030 ($ million)
Data Table on Institution and campus - Market size and forecast 2025-2030 ($ million)
Chart on Institution and campus - Year-over-year growth 2025-2030 (%)
Data Table on Institution and campus - Year-over-year growth 2025-2030 (%)

8.6 Military - Market size and forecast 2025-2030

Chart on Military - Market size and forecast 2025-2030 ($ million)
Data Table on Military - Market size and forecast 2025-2030 ($ million)
Chart on Military - Year-over-year growth 2025-2030 (%)
Data Table on Military - Year-over-year growth 2025-2030 (%)

8.7 Market opportunity by Application

Market opportunity by Application ($ million)
Data Table on Market opportunity by Application ($ million)

9. Market Segmentation by Battery Type

9.1 Market segments

Chart on Battery Type - Market share 2025-2030 (%)
Data Table on Battery Type - Market share 2025-2030 (%)

9.2 Comparison by Battery Type

Chart on Comparison by Battery Type
Data Table on Comparison by Battery Type

9.3 Lithium-ion batteries - Market size and forecast 2025-2030

Chart on Lithium-ion batteries - Market size and forecast 2025-2030 ($ million)
Data Table on Lithium-ion batteries - Market size and forecast 2025-2030 ($ million)
Chart on Lithium-ion batteries - Year-over-year growth 2025-2030 (%)
Data Table on Lithium-ion batteries - Year-over-year growth 2025-2030 (%)

9.4 Lead-acid batteries - Market size and forecast 2025-2030

Chart on Lead-acid batteries - Market size and forecast 2025-2030 ($ million)
Data Table on Lead-acid batteries - Market size and forecast 2025-2030 ($ million)
Chart on Lead-acid batteries - Year-over-year growth 2025-2030 (%)
Data Table on Lead-acid batteries - Year-over-year growth 2025-2030 (%)

9.5 Market opportunity by Battery Type

Market opportunity by Battery Type ($ million)
Data Table on Market opportunity by Battery Type ($ million)

10. Market Segmentation by End-user

10.1 Market segments

Chart on End-user - Market share 2025-2030 (%)
Data Table on End-user - Market share 2025-2030 (%)

10.2 Comparison by End-user

Chart on Comparison by End-user
Data Table on Comparison by End-user

10.3 Residential - Market size and forecast 2025-2030

Chart on Residential - Market size and forecast 2025-2030 ($ million)
Data Table on Residential - Market size and forecast 2025-2030 ($ million)
Chart on Residential - Year-over-year growth 2025-2030 (%)
Data Table on Residential - Year-over-year growth 2025-2030 (%)

10.4 Commercial - Market size and forecast 2025-2030

Chart on Commercial - Market size and forecast 2025-2030 ($ million)
Data Table on Commercial - Market size and forecast 2025-2030 ($ million)
Chart on Commercial - Year-over-year growth 2025-2030 (%)
Data Table on Commercial - Year-over-year growth 2025-2030 (%)

10.5 Industrial - Market size and forecast 2025-2030

Chart on Industrial - Market size and forecast 2025-2030 ($ million)
Data Table on Industrial - Market size and forecast 2025-2030 ($ million)
Chart on Industrial - Year-over-year growth 2025-2030 (%)
Data Table on Industrial - Year-over-year growth 2025-2030 (%)

10.6 Market opportunity by End-user

Market opportunity by End-user ($ million)
Data Table on Market opportunity by End-user ($ million)

11. Customer Landscape

11.1 Customer landscape overview

Analysis of price sensitivity, lifecycle, customer purchase basket, adoption rates, and purchase criteria

12. Geographic Landscape

12.1 Geographic segmentation

Chart on Market share by geography 2025-2030 (%)
Data Table on Market share by geography 2025-2030 (%)

12.2 Geographic comparison

Chart on Geographic comparison
Data Table on Geographic comparison

12.3 North America - Market size and forecast 2025-2030

Chart on North America - Market size and forecast 2025-2030 ($ million)
Data Table on North America - Market size and forecast 2025-2030 ($ million)
Chart on North America - Year-over-year growth 2025-2030 (%)
Data Table on North America - Year-over-year growth 2025-2030 (%)
Chart on Regional Comparison - North America
Data Table on Regional Comparison - North America

12.3.1 US - Market size and forecast 2025-2030

Chart on US - Market size and forecast 2025-2030 ($ million)
Data Table on US - Market size and forecast 2025-2030 ($ million)
Chart on US - Year-over-year growth 2025-2030 (%)
Data Table on US - Year-over-year growth 2025-2030 (%)

12.3.2 Canada - Market size and forecast 2025-2030

Chart on Canada - Market size and forecast 2025-2030 ($ million)
Data Table on Canada - Market size and forecast 2025-2030 ($ million)
Chart on Canada - Year-over-year growth 2025-2030 (%)
Data Table on Canada - Year-over-year growth 2025-2030 (%)

12.3.3 Mexico - Market size and forecast 2025-2030

Chart on Mexico - Market size and forecast 2025-2030 ($ million)
Data Table on Mexico - Market size and forecast 2025-2030 ($ million)
Chart on Mexico - Year-over-year growth 2025-2030 (%)
Data Table on Mexico - Year-over-year growth 2025-2030 (%)

12.4 APAC - Market size and forecast 2025-2030

Chart on APAC - Market size and forecast 2025-2030 ($ million)
Data Table on APAC - Market size and forecast 2025-2030 ($ million)
Chart on APAC - Year-over-year growth 2025-2030 (%)
Data Table on APAC - Year-over-year growth 2025-2030 (%)
Chart on Regional Comparison - APAC
Data Table on Regional Comparison - APAC

12.4.1 China - Market size and forecast 2025-2030

Chart on China - Market size and forecast 2025-2030 ($ million)
Data Table on China - Market size and forecast 2025-2030 ($ million)
Chart on China - Year-over-year growth 2025-2030 (%)
Data Table on China - Year-over-year growth 2025-2030 (%)

12.4.2 India - Market size and forecast 2025-2030

Chart on India - Market size and forecast 2025-2030 ($ million)
Data Table on India - Market size and forecast 2025-2030 ($ million)
Chart on India - Year-over-year growth 2025-2030 (%)
Data Table on India - Year-over-year growth 2025-2030 (%)

12.4.3 Japan - Market size and forecast 2025-2030

Chart on Japan - Market size and forecast 2025-2030 ($ million)
Data Table on Japan - Market size and forecast 2025-2030 ($ million)
Chart on Japan - Year-over-year growth 2025-2030 (%)
Data Table on Japan - Year-over-year growth 2025-2030 (%)

12.4.4 South Korea - Market size and forecast 2025-2030

Chart on South Korea - Market size and forecast 2025-2030 ($ million)
Data Table on South Korea - Market size and forecast 2025-2030 ($ million)
Chart on South Korea - Year-over-year growth 2025-2030 (%)
Data Table on South Korea - Year-over-year growth 2025-2030 (%)

12.4.5 Australia - Market size and forecast 2025-2030

Chart on Australia - Market size and forecast 2025-2030 ($ million)
Data Table on Australia - Market size and forecast 2025-2030 ($ million)
Chart on Australia - Year-over-year growth 2025-2030 (%)
Data Table on Australia - Year-over-year growth 2025-2030 (%)

12.4.6 Singapore - Market size and forecast 2025-2030

Chart on Singapore - Market size and forecast 2025-2030 ($ million)
Data Table on Singapore - Market size and forecast 2025-2030 ($ million)
Chart on Singapore - Year-over-year growth 2025-2030 (%)
Data Table on Singapore - Year-over-year growth 2025-2030 (%)

12.5 Europe - Market size and forecast 2025-2030

Chart on Europe - Market size and forecast 2025-2030 ($ million)
Data Table on Europe - Market size and forecast 2025-2030 ($ million)
Chart on Europe - Year-over-year growth 2025-2030 (%)
Data Table on Europe - Year-over-year growth 2025-2030 (%)
Chart on Regional Comparison - Europe
Data Table on Regional Comparison - Europe

12.5.1 Germany - Market size and forecast 2025-2030

Chart on Germany - Market size and forecast 2025-2030 ($ million)
Data Table on Germany - Market size and forecast 2025-2030 ($ million)
Chart on Germany - Year-over-year growth 2025-2030 (%)
Data Table on Germany - Year-over-year growth 2025-2030 (%)

12.5.2 UK - Market size and forecast 2025-2030

Chart on UK - Market size and forecast 2025-2030 ($ million)
Data Table on UK - Market size and forecast 2025-2030 ($ million)
Chart on UK - Year-over-year growth 2025-2030 (%)
Data Table on UK - Year-over-year growth 2025-2030 (%)

12.5.3 France - Market size and forecast 2025-2030

Chart on France - Market size and forecast 2025-2030 ($ million)
Data Table on France - Market size and forecast 2025-2030 ($ million)
Chart on France - Year-over-year growth 2025-2030 (%)
Data Table on France - Year-over-year growth 2025-2030 (%)

12.5.4 Italy - Market size and forecast 2025-2030

Chart on Italy - Market size and forecast 2025-2030 ($ million)
Data Table on Italy - Market size and forecast 2025-2030 ($ million)
Chart on Italy - Year-over-year growth 2025-2030 (%)
Data Table on Italy - Year-over-year growth 2025-2030 (%)

12.5.5 Spain - Market size and forecast 2025-2030

Chart on Spain - Market size and forecast 2025-2030 ($ million)
Data Table on Spain - Market size and forecast 2025-2030 ($ million)
Chart on Spain - Year-over-year growth 2025-2030 (%)
Data Table on Spain - Year-over-year growth 2025-2030 (%)

12.5.6 The Netherlands - Market size and forecast 2025-2030

Chart on The Netherlands - Market size and forecast 2025-2030 ($ million)
Data Table on The Netherlands - Market size and forecast 2025-2030 ($ million)
Chart on The Netherlands - Year-over-year growth 2025-2030 (%)
Data Table on The Netherlands - Year-over-year growth 2025-2030 (%)

12.6 South America - Market size and forecast 2025-2030

Chart on South America - Market size and forecast 2025-2030 ($ million)
Data Table on South America - Market size and forecast 2025-2030 ($ million)
Chart on South America - Year-over-year growth 2025-2030 (%)
Data Table on South America - Year-over-year growth 2025-2030 (%)
Chart on Regional Comparison - South America
Data Table on Regional Comparison - South America

12.6.1 Brazil - Market size and forecast 2025-2030

Chart on Brazil - Market size and forecast 2025-2030 ($ million)
Data Table on Brazil - Market size and forecast 2025-2030 ($ million)
Chart on Brazil - Year-over-year growth 2025-2030 (%)
Data Table on Brazil - Year-over-year growth 2025-2030 (%)

12.6.2 Chile - Market size and forecast 2025-2030

Chart on Chile - Market size and forecast 2025-2030 ($ million)
Data Table on Chile - Market size and forecast 2025-2030 ($ million)
Chart on Chile - Year-over-year growth 2025-2030 (%)
Data Table on Chile - Year-over-year growth 2025-2030 (%)

12.6.3 Argentina - Market size and forecast 2025-2030

Chart on Argentina - Market size and forecast 2025-2030 ($ million)
Data Table on Argentina - Market size and forecast 2025-2030 ($ million)
Chart on Argentina - Year-over-year growth 2025-2030 (%)
Data Table on Argentina - Year-over-year growth 2025-2030 (%)

12.7 Middle East and Africa - Market size and forecast 2025-2030

Chart on Middle East and Africa - Market size and forecast 2025-2030 ($ million)
Data Table on Middle East and Africa - Market size and forecast 2025-2030 ($ million)
Chart on Middle East and Africa - Year-over-year growth 2025-2030 (%)
Data Table on Middle East and Africa - Year-over-year growth 2025-2030 (%)
Chart on Regional Comparison - Middle East and Africa
Data Table on Regional Comparison - Middle East and Africa

12.7.1 Saudi Arabia - Market size and forecast 2025-2030

Chart on Saudi Arabia - Market size and forecast 2025-2030 ($ million)
Data Table on Saudi Arabia - Market size and forecast 2025-2030 ($ million)
Chart on Saudi Arabia - Year-over-year growth 2025-2030 (%)
Data Table on Saudi Arabia - Year-over-year growth 2025-2030 (%)

12.7.2 UAE - Market size and forecast 2025-2030

Chart on UAE - Market size and forecast 2025-2030 ($ million)
Data Table on UAE - Market size and forecast 2025-2030 ($ million)
Chart on UAE - Year-over-year growth 2025-2030 (%)
Data Table on UAE - Year-over-year growth 2025-2030 (%)

12.7.3 South Africa - Market size and forecast 2025-2030

Chart on South Africa - Market size and forecast 2025-2030 ($ million)
Data Table on South Africa - Market size and forecast 2025-2030 ($ million)
Chart on South Africa - Year-over-year growth 2025-2030 (%)
Data Table on South Africa - Year-over-year growth 2025-2030 (%)

12.7.4 Israel - Market size and forecast 2025-2030

Chart on Israel - Market size and forecast 2025-2030 ($ million)
Data Table on Israel - Market size and forecast 2025-2030 ($ million)
Chart on Israel - Year-over-year growth 2025-2030 (%)
Data Table on Israel - Year-over-year growth 2025-2030 (%)

12.7.5 Egypt - Market size and forecast 2025-2030

Chart on Egypt - Market size and forecast 2025-2030 ($ million)
Data Table on Egypt - Market size and forecast 2025-2030 ($ million)
Chart on Egypt - Year-over-year growth 2025-2030 (%)
Data Table on Egypt - Year-over-year growth 2025-2030 (%)

12.8 Market opportunity by geography

Market opportunity by geography ($ million)
Data Tables on Market opportunity by geography ($ million)

13. Drivers, Challenges, and Opportunity

13.1 Market drivers

Increasing demand for energy resilience and reliability
Declining costs of energy storage and renewable generation
Supportive government policies and global decarbonization efforts

13.2 Market challenges

High initial capital expenditure and perceptions of high prices
Supply chain volatility and dependence
Regulatory and interconnection complexity

13.3 Impact of drivers and challenges

Impact of drivers and challenges in 2025 and 2030

13.4 Market opportunities

Increasing integration of hybrid energy storage systems and diverse generation sources
Adoption of advanced software, AI, and digitalization
Emergence and expansion of microgrid as service business model

14. Competitive Landscape

14.1 Overview

14.2

Overview on criticality of inputs and factors of differentiation

14.3 Landscape disruption

Overview on factors of disruption

14.4 Industry risks

Impact of key risks on business

15. Competitive Analysis

15.1 Companies profiled

Companies covered

15.2 Company ranking index

15.3 Market positioning of companies

Matrix on companies position and classification

15.4 ABB Ltd.

ABB Ltd. - Overview
ABB Ltd. - Business segments
ABB Ltd. - Key news
ABB Ltd. - Key offerings
ABB Ltd. - Segment focus
SWOT

15.5 BYD Co. Ltd.

BYD Co. Ltd. - Overview
BYD Co. Ltd. - Business segments
BYD Co. Ltd. - Key news
BYD Co. Ltd. - Key offerings
BYD Co. Ltd. - Segment focus
SWOT

15.6 Contemporary Amperex Ltd.

Contemporary Amperex Ltd. - Overview
Contemporary Amperex Ltd. - Business segments
Contemporary Amperex Ltd. - Key offerings
Contemporary Amperex Ltd. - Segment focus
SWOT

15.7 Eaton Corp. Plc

Eaton Corp. Plc - Overview
Eaton Corp. Plc - Business segments
Eaton Corp. Plc - Key news
Eaton Corp. Plc - Key offerings
Eaton Corp. Plc - Segment focus
SWOT

15.8 EnerSys Inc.

EnerSys Inc. - Overview
EnerSys Inc. - Business segments
EnerSys Inc. - Key news
EnerSys Inc. - Key offerings
EnerSys Inc. - Segment focus
SWOT

15.9 Fluence Energy LLC

Fluence Energy LLC - Overview
Fluence Energy LLC - Product / Service
Fluence Energy LLC - Key offerings
SWOT

15.10 Hitachi Energy India Ltd.

Hitachi Energy India Ltd. - Overview
Hitachi Energy India Ltd. - Product / Service
Hitachi Energy India Ltd. - Key offerings
SWOT

15.11 LG Energy Solution Ltd.

LG Energy Solution Ltd. - Overview
LG Energy Solution Ltd. - Product / Service
LG Energy Solution Ltd. - Key news
LG Energy Solution Ltd. - Key offerings
SWOT

15.12 Samsung SDI Co. Ltd.

Samsung SDI Co. Ltd. - Overview
Samsung SDI Co. Ltd. - Business segments
Samsung SDI Co. Ltd. - Key offerings
Samsung SDI Co. Ltd. - Segment focus
SWOT

15.13 Schneider Electric SE

Schneider Electric SE - Overview
Schneider Electric SE - Business segments
Schneider Electric SE - Key news
Schneider Electric SE - Key offerings
Schneider Electric SE - Segment focus
SWOT

15.14 Siemens AG

Siemens AG - Overview
Siemens AG - Business segments
Siemens AG - Key news
Siemens AG - Key offerings
Siemens AG - Segment focus
SWOT

15.15 SMA Solar Technology AG

SMA Solar Technology AG - Overview
SMA Solar Technology AG - Business segments
SMA Solar Technology AG - Key offerings
SMA Solar Technology AG - Segment focus
SWOT

15.16 Sungrow Power Supply Co. Ltd.

Sungrow Power Supply Co. Ltd. - Overview
Sungrow Power Supply Co. Ltd. - Product / Service
Sungrow Power Supply Co. Ltd. - Key offerings
SWOT

15.17 Tesla Inc.

Tesla Inc. - Overview
Tesla Inc. - Business segments
Tesla Inc. - Key offerings
Tesla Inc. - Segment focus
SWOT

15.18 Wartsila Corp.

Wartsila Corp. - Overview
Wartsila Corp. - Business segments
Wartsila Corp. - Key news
Wartsila Corp. - Key offerings
Wartsila Corp. - Segment focus
SWOT

16. Appendix

16.1 Scope of the report

Market definition
Objectives
Notes and caveats

16.2 Inclusions and exclusions checklist

Inclusions checklist
Exclusions checklist

16.3 Currency conversion rates for US$

16.4 Research methodology

16.5 Data procurement

Information sources

16.6 Data validation

16.7 Validation techniques employed for market sizing

16.8 Data synthesis

16.9 360 degree market analysis

16.10 List of abbreviations

Research Methodology

Technavio presents a detailed picture of the market by way of study, synthesis, and summation of data from multiple sources. The analysts have presented the various facets of the market with a particular focus on identifying the key industry influencers. The data thus presented is comprehensive, reliable, and the result of extensive research, both primary and secondary.

INFORMATION SOURCES

Primary sources

  • Manufacturers and suppliers
  • Channel partners
  • Industry experts
  • Strategic decision makers

Secondary sources

  • Industry journals and periodicals
  • Government data
  • Financial reports of key industry players
  • Historical data
  • Press releases

DATA ANALYSIS

Data Synthesis

  • Collation of data
  • Estimation of key figures
  • Analysis of derived insights

Data Validation

  • Triangulation with data models
  • Reference against proprietary databases
  • Corroboration with industry experts

REPORT WRITING

Qualitative

  • Market drivers
  • Market challenges
  • Market trends
  • Five forces analysis

Quantitative

  • Market size and forecast
  • Market segmentation
  • Geographical insights
  • Competitive landscape

Interested in this report?

Get your sample now to see our research methodology and insights!

Download Now

Frequently Asked Questions

Energy Storage For Microgrids market growth will increase by USD 3045.5 million during 2026-2030.

The Energy Storage For Microgrids market is expected to grow at a CAGR of 22.9% during 2026-2030.

Energy Storage For Microgrids market is segmented by Application (Remote, Community and utility, Institution and campus, Military) Battery type (Lithium-ion batteries, Lead-acid batteries) End-user (Residential, Commercial, Industrial)

ABB Ltd., BYD Co. Ltd., CellCube Energy Storage GmbH, Contemporary Amperex Ltd., Dynapower, Eaton Corp. Plc, EnerSys Inc., EOS Energy Enterprises Inc., ESS Tech Inc., Fluence Energy LLC, Hitachi Energy India Ltd., Invinity Energy Systems plc, LG Energy Solution Ltd., Samsung SDI Co. Ltd., Schneider Electric SE, Siemens AG, SMA Solar Technology AG, Sungrow Power Supply Co. Ltd., Tesla Inc., Wartsila Corp. are a few of the key vendors in the Energy Storage For Microgrids market.

North America will register the highest growth rate of 35.7% among the other regions. Therefore, the Energy Storage For Microgrids market in North America is expected to garner significant business opportunities for the vendors during the forecast period.

US, Canada, Mexico, China, India, Japan, South Korea, Australia, Singapore, Germany, UK, France, Italy, Spain, The Netherlands, Brazil, Chile, Argentina, Saudi Arabia, UAE, South Africa, Israel, Egypt

  • Increasing demand for energy resilience and reliability is the driving factor this market.

The Energy Storage For Microgrids market vendors should focus on grabbing business opportunities from the Application segment as it accounted for the largest market share in the base year.
RIA - Research AI Assistant
Ask RIA
