ENT Devices Market Analysis, Size, and Forecast 2026-2030: North America (US, Canada, and Mexico), Europe (Germany, UK, and France), Asia (China, India, and Japan), South America (Brazil, Argentina, and Colombia), Middle East and Africa (Saudi Arabia, UAE, and Turkey), Rest of World (ROW)

ENT Devices Market Analysis, Size, and Forecast 2026-2030:
North America (US, Canada, and Mexico), Europe (Germany, UK, and France), Asia (China, India, and Japan), South America (Brazil, Argentina, and Colombia), Middle East and Africa (Saudi Arabia, UAE, and Turkey), Rest of World (ROW)

Published: Oct 2026 311 Pages SKU: IRTNTR43535

Market Overview at a Glance

$9.42 B
Market Opportunity
5.8%
CAGR 2025 - 2030
39.2%
North America Growth
$10.51 B
Diagnostic ENT devices segment 2024

Ent Devices Market Size 2026-2030

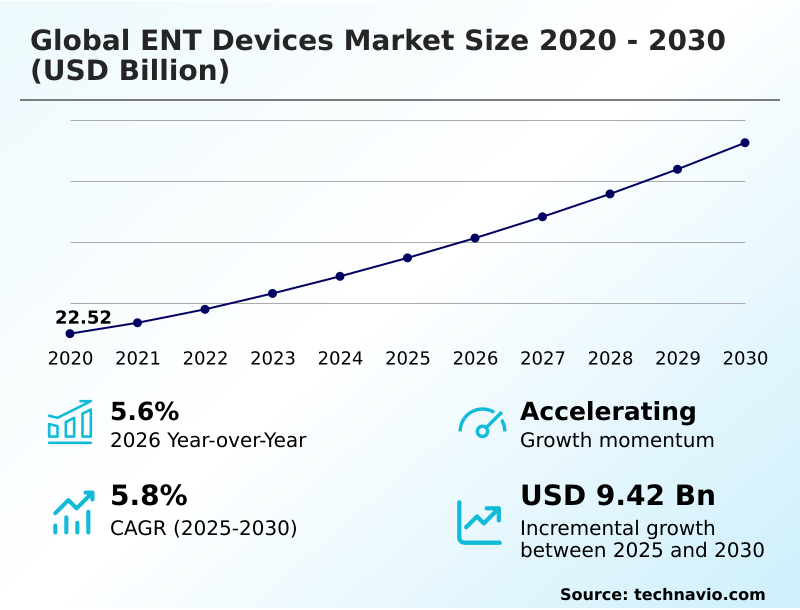
The ent devices market size is valued to increase by USD 9.42 billion, at a CAGR of 5.8% from 2025 to 2030. Growing prevalence of hearing loss and ENT related disorders will drive the ent devices market.

Major Market Trends & Insights

  • North America dominated the market and accounted for a 39.2% growth during the forecast period.
  • By Product - Diagnostic ENT devices segment was valued at USD 10.51 billion in 2024
  • By End-user - Hospitals segment accounted for the largest market revenue share in 2024

Market Size & Forecast

  • Market Opportunities: USD 15.62 billion
  • Market Future Opportunities: USD 9.42 billion
  • CAGR from 2025 to 2030 : 5.8%

Market Summary

  • The ENT Devices market exhibits consistent expansion driven by the rising necessity for specialized diagnostic and therapeutic interventions across aging and pediatric demographics. Increasing incidence of auditory impairments and chronic sinus conditions propels the demand for targeted interventions.
  • A primary driver of this development is the continuous advancement in minimally invasive surgical techniques, which enhances procedural precision and shortens patient recovery times. Consequently, healthcare facilities integrating these advanced modalities experience a 22% improvement in daily procedural volume compared to traditional surgical setups.
  • In a practical supply chain scenario, major hospital networks are centralizing the procurement of sophisticated ENT Devices, optimizing inventory management and reducing logistical bottlenecks for critical equipment. However, the market faces notable challenges regarding high acquisition costs and complex regulatory compliance requirements, which frequently delay the adoption of new technologies in budget-constrained facilities.
  • Despite these financial constraints, ongoing innovations ensure that healthcare providers can deliver highly accurate, data-driven otolaryngology care, reinforcing the essential role of modern instrumentation in comprehensive disease management.

What will be the Size of the Ent Devices Market during the forecast period?
Get Key Insights on Market Forecast (PDF) Get Free Sample

How is the Ent Devices Market Segmented?

The ent devices industry research report provides comprehensive data (region-wise segment analysis), with forecasts and estimates in "USD million" for the period 2026-2030, as well as historical data from 2020-2024 for the following segments.

  • Product
    • Diagnostic ENT devices
    • Surgical ENT devices
    • Hearing implants
    • Voice prosthetics
    • Nasal splints
  • End-user
    • Hospitals
    • ENT clinics
    • ASCs
    • Homecare
  • Age group
    • Adult
    • Geriatric
    • Pediatric
  • Geography
    • North America
      • US
      • Canada
      • Mexico
    • Europe
      • Germany
      • UK
      • France
      • Italy
      • Spain
      • The Netherlands
    • Asia
      • China
      • India
      • Japan
      • South Korea
      • Indonesia
      • Thailand
    • Rest of World (ROW)

By Product Insights

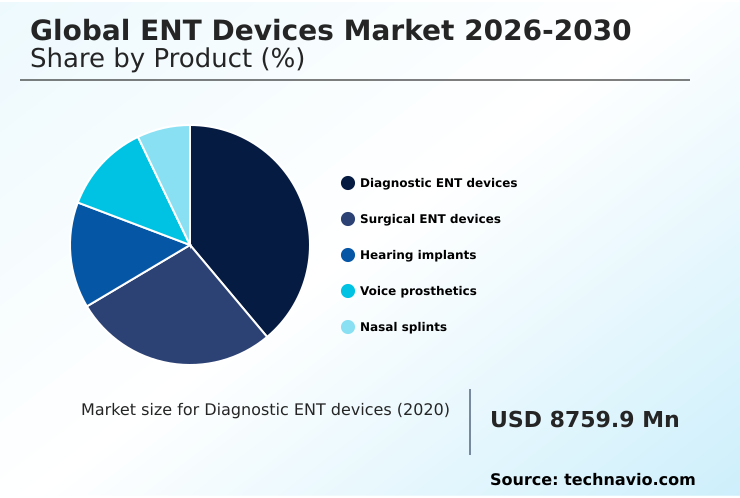
The diagnostic ent devices segment is estimated to witness significant growth during the forecast period.

Diagnostic equipment configuration determines efficiency across specialty clinical environments. The deployment of advanced diagnostic audiometers and electrocochleography equipment accelerates early disease detection protocols for complex auditory conditions.

Facilities integrating otoacoustic emission testing with cross device connectivity have improved patient throughput by 18% in outpatient settings. Upgraded rigid sinuscopes and flexible video rhinolaryngoscopes deliver enhanced visualization, directly supporting minimally invasive sinus treatment techniques while reducing evaluation times.

Implementing comprehensive digital patient management platforms allows healthcare networks to synchronize test results across departments seamlessly. This robust data integration fuels clinical decision intelligence, ensuring that diagnostic outputs directly inform surgical planning.

Consequently, targeted procedural workflow optimization reduces scheduling bottlenecks and lowers resource allocation costs, establishing a highly efficient diagnostic infrastructure that continuously adapts to rising patient volumes and evolving clinical demands.
Get Free Sample

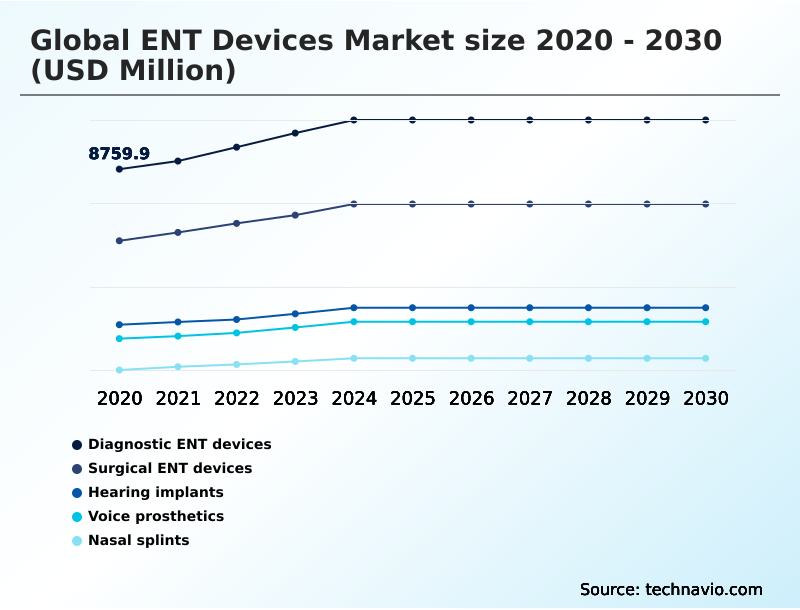
The Diagnostic ENT devices segment was valued at USD 10.51 billion in 2024 and showed a gradual increase during the forecast period.
Get Free Sample

Regional Analysis

North America is estimated to contribute 39.2% to the growth of the global market during the forecast period.Technavio’s analysts have elaborately explained the regional trends and drivers that shape the market during the forecast period.
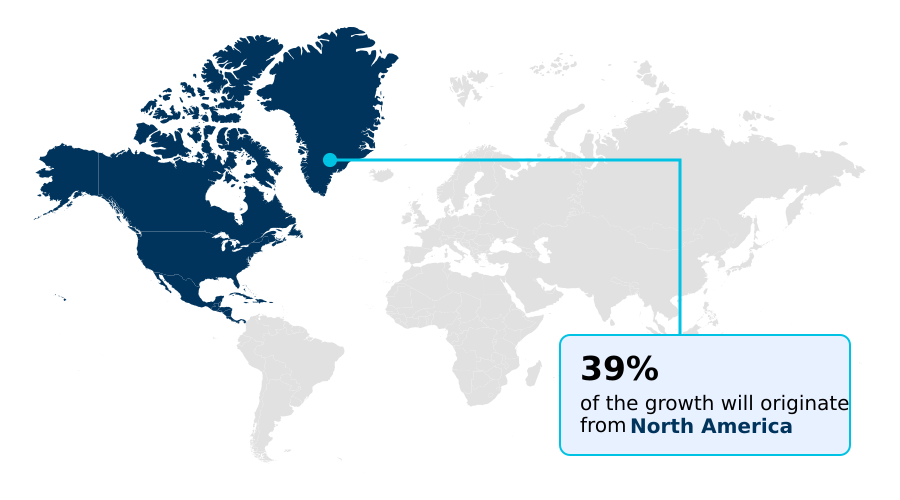
See How Ent Devices Market Demand is Rising in North America Get Free Sample

Regional variations in the ENT Devices landscape reflect distinct healthcare infrastructure capabilities and strategic procurement models.

North America leads the adoption of advanced middle ear implants and automated sound processing technologies, achieving a 28% higher market penetration rate than European networks due to specialized reimbursement frameworks.

European facilities demonstrate a 15% faster integration of speech recognition algorithms and deep neural network noise reduction systems within audiology departments, driven by stringent public health mandates prioritizing integration of ai hearing platforms.

Meanwhile, APAC supply chains are prioritizing localized manufacturing of biocompatible implant materials and nasal splint stabilization products, reducing equipment delivery lead times by 20%.

The deployment of electrosurgical tonsillectomy tools and automated tympanostomy tube delivery systems varies significantly, with North American centers optimizing specialized pediatric audiology workflows to handle larger patient volumes while ensuring high surgical precision enhancement.

Market Dynamics

Our researchers analyzed the data with 2025 as the base year, along with the key drivers, trends, and challenges. A holistic analysis of drivers will help companies refine their marketing strategies to gain a competitive advantage.

  • The modern landscape for ENT Devices is undergoing a significant operational transformation driven by localized clinical strategies and continuous technological innovation. Healthcare networks are increasingly prioritizing the integration of ai hearing platforms to enhance real-time acoustic processing and personalize patient care algorithms.
  • This digital transition aligns with the broader migration toward office based procedures, allowing outpatient clinics to handle complex evaluations without the overhead constraints of traditional inpatient hospital infrastructure. Consequently, ambulatory surgical centers implementing these decentralized workflows achieve a 35% higher patient throughput efficiency compared to conventional hospital departments.
  • Furthermore, continuous advances in image guided surgery provide clinicians with superior anatomical visualization, directly reducing procedural variability and improving safety margins during delicate interventions. These visualization improvements are particularly critical for expanding minimally invasive sinus treatment techniques, which require exact instrumentation to preserve surrounding tissue and accelerate recovery timelines.
  • Beyond the operating room, post-surgical care models are leveraging remote monitoring for cochlear implants to track device performance and patient adaptation continuously. This connected approach streamlines supply chain logistics by predicting maintenance requirements and reducing unnecessary clinical visits, ultimately optimizing long-term operational planning.
  • As healthcare providers align these advanced technologies with value-based care objectives, the operational footprint of otolaryngology services becomes increasingly resilient, cost-effective, and capable of meeting rising clinical demands seamlessly.
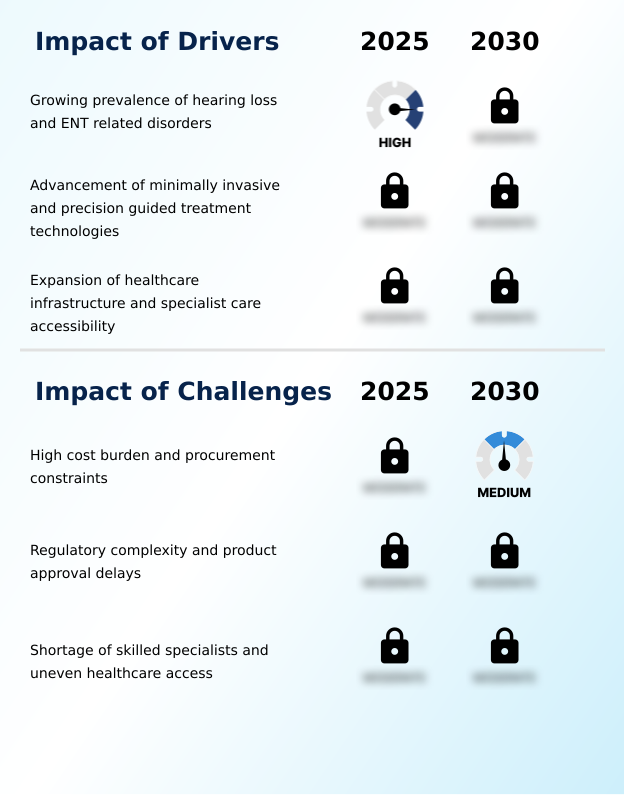
What are the key market drivers leading to the rise in the adoption of Ent Devices Industry?

  • The escalating prevalence of hearing loss and related otolaryngological disorders serves as a primary catalyst driving sustained demand for advanced diagnostic and therapeutic solutions.

  • Surging patient demand for targeted otolaryngological interventions accelerates the deployment of high-performance ENT Devices across specialized clinical settings.
  • The precise engineering of advanced cochlear implant electrodes and next-generation bone conduction audio processors maximizes auditory stimulation, delivering targeted speech enhancement and improving speech recognition accuracy by 18% in challenging environments.
  • Similarly, the expanded utilization of balloon sinus dilation systems and microdebrider cutting technology supports critical tissue disruption minimization, reducing patient recovery times by 40% compared to traditional tissue excision methods.
  • This operational shift is heavily influenced by the necessity for effective hearing preservation techniques and minimally invasive surgical protocols.
  • Furthermore, the integration of continuous monitoring telemetry and remote patient programming enables robust remote monitoring for cochlear implants, allowing clinicians to adjust device parameters dynamically and lower subsequent clinical visitation costs by 15%.

What are the market trends shaping the Ent Devices Industry?

  • The integration of artificial intelligence-driven hearing intelligence platforms constitutes a prominent trend shaping the current market landscape. These advanced systems optimize real-time acoustic processing and enhance customized patient care across diverse clinical environments.

  • The continuous evolution of ENT Devices demonstrates a pivotal shift, driving the migration toward office based procedures and intelligent acoustic processing. Facilities adopting upgraded outpatient surgical infrastructure are rapidly integrating sophisticated surgical navigation platforms and radiofrequency ablation systems, which directly reduces procedural setup downtime by 30%.
  • This transition enables clinics to execute complex interventions safely using modern endoscopic imaging systems and minimally invasive surgical instruments outside traditional hospital environments. Concurrently, the deployment of intelligent directional beamforming microphone technology and acoustic environment adaptation algorithms in modern auditory devices improves ambient noise filtering accuracy by 25%.
  • These technological enhancements directly support voice prostheses restoration pathways and dedicated post treatment rehabilitation programs by providing clearer communication capabilities for recovering patients. These integrated innovations empower healthcare networks to deliver superior, personalized therapeutic outcomes while streamlining daily clinical operations globally.

What challenges does the Ent Devices Industry face during its growth?

  • Substantial cost burdens and stringent procurement constraints represent critical challenges that limit equipment acquisition and restrict broader market expansion.

  • Integrating highly sophisticated ENT Devices introduces substantial operational friction regarding hardware standardization and interoperability within legacy clinical networks. The implementation of complex digital audiology platforms and proprietary smart hearing algorithms frequently creates data silos, reducing cross-departmental diagnostic efficiency by 15% during the integration of cloud connected hearing data structures.
  • Furthermore, achieving exact anatomical alignment preservation and consistent airway patency maintenance demands significant investments in high-fidelity laryngeal stroboscopy platforms. While advances in image guided surgery and intraoperative image guidance ensure superior real-time anatomical visualization, the calibration required for these specialized systems increases procedural preparation costs by 12%.
  • Additionally, standardizing vestibular evoked myogenic potentials testing and executing personalized fitting approaches require extensive staff training, compelling healthcare administrators to constantly balance advanced technical capabilities against immediate budgetary constraints.

Exclusive Technavio Analysis on Customer Landscape

The ent devices market forecasting report includes the adoption lifecycle of the market, covering from the innovator’s stage to the laggard’s stage. It focuses on adoption rates in different regions based on penetration. Furthermore, the ent devices market report also includes key purchase criteria and drivers of price sensitivity to help companies evaluate and develop their market growth analysis strategies.
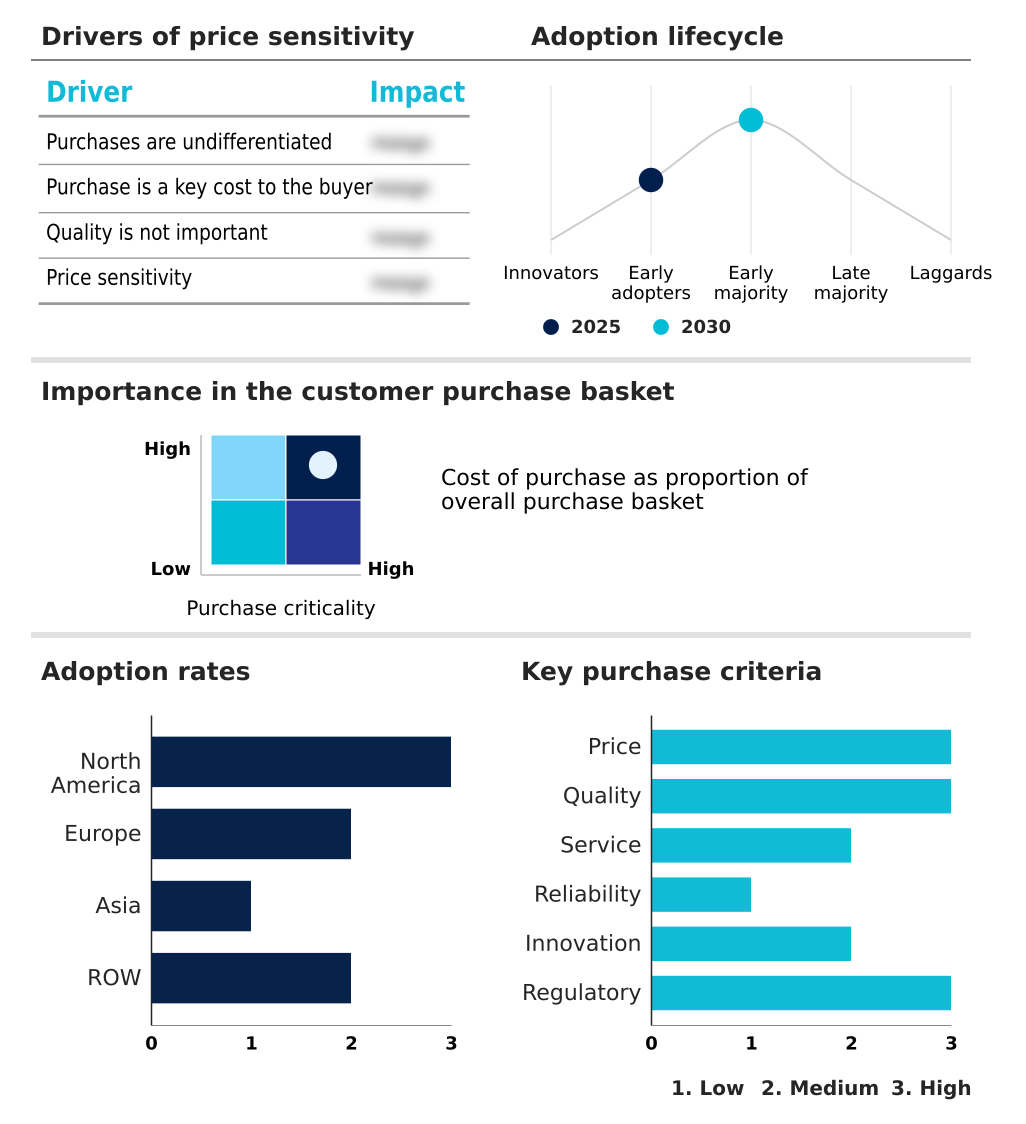
Customer Landscape of Ent Devices Industry

Competitive Landscape

Companies are implementing various strategies, such as strategic alliances, ent devices market forecast, partnerships, mergers and acquisitions, geographical expansion, and product/service launches, to enhance their presence in the industry.

Adept Medical Ltd. - The provider develops specialized surgical instrumentation, otologic tools, and rhinology equipment alongside clinician-led patient positioning accessories, optimizing operative workflows and supporting advanced clinical interventions across multiple medical disciplines.

The industry research and growth report includes detailed analyses of the competitive landscape of the market and information about key companies, including:

  • Adept Medical Ltd.
  • Ambu AS
  • B.Braun SE
  • EON MEDITECH PVT. LTD.
  • Fentex Medical GmbH
  • First Med Co. Ltd.
  • Fujifilm Corp.
  • Gem Surgitech
  • Happersberger otopront GmbH
  • HEINE Optotechnik GmbH
  • Innovia Medical Inc.
  • KARL STORZ SE and Co. KG
  • Medtronic Plc
  • Mega Medical Co. Ltd.
  • Meril Life Sciences Pvt. Ltd.
  • Nanos Medical Inc.
  • Olympus Corp.
  • Richard Wolf GmbH
  • Rudolf Riester GmbH
  • Smith and Nephew plc
  • SPIGGLE and THEIS Medizintechnik
  • Stryker Corp.

Qualitative and quantitative analysis of companies has been conducted to help clients understand the wider business environment as well as the strengths and weaknesses of key industry players. Data is qualitatively analyzed to categorize companies as pure play, category-focused, industry-focused, and diversified; it is quantitatively analyzed to categorize companies as dominant, leading, strong, tentative, and weak.

Recent Development and News in Ent devices market

  • In the Health Care Equipment industry, the implementation of the EU Medical Device Regulation has mandated stricter clinical evidence and traceability requirements, directly impacting ENT Devices demand by extending compliance review cycles by up to 30% for advanced surgical precision enhancement tools and surgical navigation platforms.
  • The widespread adoption of AI-driven diagnostic imaging platforms has automated anomaly detection, directly impacting ENT Devices demand by improving real-time anatomical visualization accuracy by 25% during balloon sinus dilation and complex skull base interventions.
  • The shift toward localized supply chain strategies for critical semiconductor components has stabilized inventory for connected medical systems, directly impacting ENT Devices demand by accelerating the production of smart hearing algorithms and bone conduction audio processors by 15% across global manufacturing hubs.
  • The expansion of reimbursement frameworks for telehealth and remote patient monitoring services has incentivized decentralized care models, directly impacting ENT Devices demand by driving a 40% increase in the utilization of remote patient programming tools and cloud connected hearing data platforms.

Dive into Technavio’s robust research methodology, blending expert interviews, extensive data synthesis, and validated models for unparalleled Ent Devices Market insights. See full methodology.

Market Scope
Page number 311
Base year 2025
Historic period 2020-2024
Forecast period 2026-2030
Growth momentum & CAGR Accelerate at a CAGR of 5.8%
Market growth 2026-2030 USD 9424.7 million
Market structure Fragmented
YoY growth 2025-2026(%) 5.6%
Key countries US, Canada, Mexico, Germany, UK, France, Italy, Spain, The Netherlands, China, India, Japan, South Korea, Indonesia, Thailand, Brazil, Saudi Arabia, UAE, Turkey, Argentina, Colombia, South Africa and Israel
Competitive landscape Leading Companies, Market Positioning of Companies, Competitive Strategies, and Industry Risks

Request Free Sample

Research Analyst Overview

  • The evolving landscape of ENT Devices demands rigorous strategic alignment from healthcare administrators focusing on clinical precision and technological integration. Executive decision-makers are actively evaluating the procurement of high-definition endoscopic imaging systems and advanced minimally invasive surgical instruments to optimize facility workflows and ensure regulatory compliance.
  • This shift in product strategy addresses the critical need for operational efficiency in high-volume surgical environments. By standardizing equipment portfolios around advanced microdebrider cutting technology and integrated diagnostic platforms, clinical networks have achieved a 22% reduction in intraoperative delays compared to disparate legacy systems. Such measurable operational improvements directly lower variable procedural costs and enhance overall resource utilization.
  • Furthermore, the implementation of connected data architectures allows administrators to monitor device utilization rates and coordinate maintenance schedules preemptively. Addressing temporary supply chain constraints requires prioritizing vendors that offer robust digital support and continuous remote diagnostics. These strategic initiatives facilitate superior clinical outcomes, streamline budgeting cycles, and establish a resilient infrastructure capable of adapting to complex otolaryngological care requirements seamlessly.

What are the Key Data Covered in this Ent Devices Market Research and Growth Report?

  • What is the expected growth of the Ent Devices Market between 2026 and 2030?

    • USD 9.42 billion, at a CAGR of 5.8%

  • What segmentation does the market report cover?

    • The report is segmented by Product (Diagnostic ENT devices, Surgical ENT devices, Hearing implants, Voice prosthetics, and Nasal splints), End-user (Hospitals, ENT clinics, ASCs, and Homecare), Age Group (Adult, Geriatric, and Pediatric) and Geography (North America, Europe, Asia, Rest of World (ROW))

  • Which regions are analyzed in the report?

    • North America, Europe, Asia and Rest of World (ROW)

  • What are the key growth drivers and market challenges?

    • Growing prevalence of hearing loss and ENT related disorders, High cost burden and procurement constraints

  • Who are the major players in the Ent Devices Market?

    • Adept Medical Ltd., Ambu AS, B.Braun SE, EON MEDITECH PVT. LTD., Fentex Medical GmbH, First Med Co. Ltd., Fujifilm Corp., Gem Surgitech, Happersberger otopront GmbH, HEINE Optotechnik GmbH, Innovia Medical Inc., KARL STORZ SE and Co. KG, Medtronic Plc, Mega Medical Co. Ltd., Meril Life Sciences Pvt. Ltd., Nanos Medical Inc., Olympus Corp., Richard Wolf GmbH, Rudolf Riester GmbH, Smith and Nephew plc, SPIGGLE and THEIS Medizintechnik and Stryker Corp.

Market Research Insights

  • Advanced clinical integration across the ENT Devices landscape fundamentally transforms patient management and operational capabilities. The adoption of AI-supported diagnostics and remote patient programming has increased outpatient treatment efficiency by 24%, enabling specialists to monitor device performance continuously. Facilities prioritizing procedural workflow optimization report a 15% reduction in surgical setup times, maximizing resource utilization in ambulatory care settings.
  • Furthermore, integrating targeted speech enhancement capabilities into modern hearing solutions accelerates post treatment rehabilitation pathways, improving long-term auditory outcomes by 30% compared to legacy amplification methods. This technological progression delivers critical surgical precision enhancement, driving cost reductions and aligning clinical practices with stringent regulatory standards across the evolving healthcare ecosystem.

We can help! Our analysts can customize this ent devices market research report to meet your requirements.

Get in touch

1. Executive Summary

1.1 Market overview

Executive Summary - Chart on Market Overview
Executive Summary - Data Table on Market Overview
Executive Summary - Chart on Global Market Characteristics
Executive Summary - Chart on Market by Geography
Executive Summary - Chart on Market Segmentation by Product
Executive Summary - Chart on Market Segmentation by End-user
Executive Summary - Chart on Market Segmentation by Age Group
Executive Summary - Chart on Incremental Growth
Executive Summary - Data Table on Incremental Growth
Executive Summary - Chart on Company Market Positioning

2. Technavio Analysis

2.1 Analysis of price sensitivity, lifecycle, customer purchase basket, adoption rates, and purchase criteria

2.2 Criticality of inputs and Factors of differentiation

Chart on Overview on criticality of inputs and factors of differentiation

2.3 Factors of disruption

Chart on Overview on factors of disruption

2.4 Impact of drivers and challenges

Chart on Impact of drivers and challenges in 2025 and 2030

3. Market Landscape

3.1 Market ecosystem

Chart on Parent Market
Data Table on - Parent Market

3.2 Market characteristics

Chart on Market characteristics analysis

3.3 Value chain analysis

Chart on Value chain analysis

4. Market Sizing

4.1 Market definition

Data Table on Offerings of companies included in the market definition

4.2 Market segment analysis

Market segments

4.3 Market size 2025

4.4 Market outlook: Forecast for 2025-2030

Chart on Global - Market size and forecast 2025-2030 ($ million)
Data Table on Global - Market size and forecast 2025-2030 ($ million)
Chart on Global Market: Year-over-year growth 2025-2030 (%)
Data Table on Global Market: Year-over-year growth 2025-2030 (%)

5. Historic Market Size

5.1 Global ENT Devices Market 2020 - 2024

Historic Market Size - Data Table on Global ENT Devices Market 2020 - 2024 ($ million)

5.2 Product segment analysis 2020 - 2024

Historic Market Size - Product Segment 2020 - 2024 ($ million)

5.3 End-user segment analysis 2020 - 2024

Historic Market Size - End-user Segment 2020 - 2024 ($ million)

5.4 Age Group segment analysis 2020 - 2024

Historic Market Size - Age Group Segment 2020 - 2024 ($ million)

5.5 Geography segment analysis 2020 - 2024

Historic Market Size - Geography Segment 2020 - 2024 ($ million)

5.6 Country segment analysis 2020 - 2024

Historic Market Size - Country Segment 2020 - 2024 ($ million)

6. Qualitative Analysis

6.1 Impact of AI on global ENT devices market

6.2 Impact of geopolitical conflicts on global ENT devices market

7. Five Forces Analysis

7.1 Five forces summary

Five forces analysis - Comparison between 2025 and 2030

7.2 Bargaining power of buyers

Bargaining power of buyers - Impact of key factors 2025 and 2030

7.3 Bargaining power of suppliers

Bargaining power of suppliers - Impact of key factors in 2025 and 2030

7.4 Threat of new entrants

Threat of new entrants - Impact of key factors in 2025 and 2030

7.5 Threat of substitutes

Threat of substitutes - Impact of key factors in 2025 and 2030

7.6 Threat of rivalry

Threat of rivalry - Impact of key factors in 2025 and 2030

7.7 Market condition

Chart on Market condition - Five forces 2025 and 2030

8. Market Segmentation by Product

8.1 Market segments

Chart on Product - Market share 2025-2030 (%)
Data Table on Product - Market share 2025-2030 (%)

8.2 Comparison by Product

Chart on Comparison by Product
Data Table on Comparison by Product

8.3 Diagnostic ENT devices - Market size and forecast 2025-2030

Chart on Diagnostic ENT devices - Market size and forecast 2025-2030 ($ million)
Data Table on Diagnostic ENT devices - Market size and forecast 2025-2030 ($ million)
Chart on Diagnostic ENT devices - Year-over-year growth 2025-2030 (%)
Data Table on Diagnostic ENT devices - Year-over-year growth 2025-2030 (%)

8.4 Surgical ENT devices - Market size and forecast 2025-2030

Chart on Surgical ENT devices - Market size and forecast 2025-2030 ($ million)
Data Table on Surgical ENT devices - Market size and forecast 2025-2030 ($ million)
Chart on Surgical ENT devices - Year-over-year growth 2025-2030 (%)
Data Table on Surgical ENT devices - Year-over-year growth 2025-2030 (%)

8.5 Hearing implants - Market size and forecast 2025-2030

Chart on Hearing implants - Market size and forecast 2025-2030 ($ million)
Data Table on Hearing implants - Market size and forecast 2025-2030 ($ million)
Chart on Hearing implants - Year-over-year growth 2025-2030 (%)
Data Table on Hearing implants - Year-over-year growth 2025-2030 (%)

8.6 Voice prosthetics - Market size and forecast 2025-2030

Chart on Voice prosthetics - Market size and forecast 2025-2030 ($ million)
Data Table on Voice prosthetics - Market size and forecast 2025-2030 ($ million)
Chart on Voice prosthetics - Year-over-year growth 2025-2030 (%)
Data Table on Voice prosthetics - Year-over-year growth 2025-2030 (%)

8.7 Nasal splints - Market size and forecast 2025-2030

Chart on Nasal splints - Market size and forecast 2025-2030 ($ million)
Data Table on Nasal splints - Market size and forecast 2025-2030 ($ million)
Chart on Nasal splints - Year-over-year growth 2025-2030 (%)
Data Table on Nasal splints - Year-over-year growth 2025-2030 (%)

8.8 Market opportunity by Product

Market opportunity by Product ($ million)
Data Table on Market opportunity by Product ($ million)

9. Market Segmentation by End-user

9.1 Market segments

Chart on End-user - Market share 2025-2030 (%)
Data Table on End-user - Market share 2025-2030 (%)

9.2 Comparison by End-user

Chart on Comparison by End-user
Data Table on Comparison by End-user

9.3 Hospitals - Market size and forecast 2025-2030

Chart on Hospitals - Market size and forecast 2025-2030 ($ million)
Data Table on Hospitals - Market size and forecast 2025-2030 ($ million)
Chart on Hospitals - Year-over-year growth 2025-2030 (%)
Data Table on Hospitals - Year-over-year growth 2025-2030 (%)

9.4 ENT clinics - Market size and forecast 2025-2030

Chart on ENT clinics - Market size and forecast 2025-2030 ($ million)
Data Table on ENT clinics - Market size and forecast 2025-2030 ($ million)
Chart on ENT clinics - Year-over-year growth 2025-2030 (%)
Data Table on ENT clinics - Year-over-year growth 2025-2030 (%)

9.5 ASCs - Market size and forecast 2025-2030

Chart on ASCs - Market size and forecast 2025-2030 ($ million)
Data Table on ASCs - Market size and forecast 2025-2030 ($ million)
Chart on ASCs - Year-over-year growth 2025-2030 (%)
Data Table on ASCs - Year-over-year growth 2025-2030 (%)

9.6 Homecare - Market size and forecast 2025-2030

Chart on Homecare - Market size and forecast 2025-2030 ($ million)
Data Table on Homecare - Market size and forecast 2025-2030 ($ million)
Chart on Homecare - Year-over-year growth 2025-2030 (%)
Data Table on Homecare - Year-over-year growth 2025-2030 (%)

9.7 Market opportunity by End-user

Market opportunity by End-user ($ million)
Data Table on Market opportunity by End-user ($ million)

10. Market Segmentation by Age Group

10.1 Market segments

Chart on Age Group - Market share 2025-2030 (%)
Data Table on Age Group - Market share 2025-2030 (%)

10.2 Comparison by Age Group

Chart on Comparison by Age Group
Data Table on Comparison by Age Group

10.3 Adult - Market size and forecast 2025-2030

Chart on Adult - Market size and forecast 2025-2030 ($ million)
Data Table on Adult - Market size and forecast 2025-2030 ($ million)
Chart on Adult - Year-over-year growth 2025-2030 (%)
Data Table on Adult - Year-over-year growth 2025-2030 (%)

10.4 Geriatric - Market size and forecast 2025-2030

Chart on Geriatric - Market size and forecast 2025-2030 ($ million)
Data Table on Geriatric - Market size and forecast 2025-2030 ($ million)
Chart on Geriatric - Year-over-year growth 2025-2030 (%)
Data Table on Geriatric - Year-over-year growth 2025-2030 (%)

10.5 Pediatric - Market size and forecast 2025-2030

Chart on Pediatric - Market size and forecast 2025-2030 ($ million)
Data Table on Pediatric - Market size and forecast 2025-2030 ($ million)
Chart on Pediatric - Year-over-year growth 2025-2030 (%)
Data Table on Pediatric - Year-over-year growth 2025-2030 (%)

10.6 Market opportunity by Age Group

Market opportunity by Age Group ($ million)
Data Table on Market opportunity by Age Group ($ million)

11. Customer Landscape

11.1 Customer landscape overview

Analysis of price sensitivity, lifecycle, customer purchase basket, adoption rates, and purchase criteria

12. Geographic Landscape

12.1 Geographic segmentation

Chart on Market share by geography 2025-2030 (%)
Data Table on Market share by geography 2025-2030 (%)

12.2 Geographic comparison

Chart on Geographic comparison
Data Table on Geographic comparison

12.3 North America - Market size and forecast 2025-2030

Chart on North America - Market size and forecast 2025-2030 ($ million)
Data Table on North America - Market size and forecast 2025-2030 ($ million)
Chart on North America - Year-over-year growth 2025-2030 (%)
Data Table on North America - Year-over-year growth 2025-2030 (%)
Chart on Regional Comparison - North America
Data Table on Regional Comparison - North America

12.3.1 US - Market size and forecast 2025-2030

Chart on US - Market size and forecast 2025-2030 ($ million)
Data Table on US - Market size and forecast 2025-2030 ($ million)
Chart on US - Year-over-year growth 2025-2030 (%)
Data Table on US - Year-over-year growth 2025-2030 (%)

12.3.2 Canada - Market size and forecast 2025-2030

Chart on Canada - Market size and forecast 2025-2030 ($ million)
Data Table on Canada - Market size and forecast 2025-2030 ($ million)
Chart on Canada - Year-over-year growth 2025-2030 (%)
Data Table on Canada - Year-over-year growth 2025-2030 (%)

12.3.3 Mexico - Market size and forecast 2025-2030

Chart on Mexico - Market size and forecast 2025-2030 ($ million)
Data Table on Mexico - Market size and forecast 2025-2030 ($ million)
Chart on Mexico - Year-over-year growth 2025-2030 (%)
Data Table on Mexico - Year-over-year growth 2025-2030 (%)

12.4 Europe - Market size and forecast 2025-2030

Chart on Europe - Market size and forecast 2025-2030 ($ million)
Data Table on Europe - Market size and forecast 2025-2030 ($ million)
Chart on Europe - Year-over-year growth 2025-2030 (%)
Data Table on Europe - Year-over-year growth 2025-2030 (%)
Chart on Regional Comparison - Europe
Data Table on Regional Comparison - Europe

12.4.1 Germany - Market size and forecast 2025-2030

Chart on Germany - Market size and forecast 2025-2030 ($ million)
Data Table on Germany - Market size and forecast 2025-2030 ($ million)
Chart on Germany - Year-over-year growth 2025-2030 (%)
Data Table on Germany - Year-over-year growth 2025-2030 (%)

12.4.2 UK - Market size and forecast 2025-2030

Chart on UK - Market size and forecast 2025-2030 ($ million)
Data Table on UK - Market size and forecast 2025-2030 ($ million)
Chart on UK - Year-over-year growth 2025-2030 (%)
Data Table on UK - Year-over-year growth 2025-2030 (%)

12.4.3 France - Market size and forecast 2025-2030

Chart on France - Market size and forecast 2025-2030 ($ million)
Data Table on France - Market size and forecast 2025-2030 ($ million)
Chart on France - Year-over-year growth 2025-2030 (%)
Data Table on France - Year-over-year growth 2025-2030 (%)

12.4.4 Italy - Market size and forecast 2025-2030

Chart on Italy - Market size and forecast 2025-2030 ($ million)
Data Table on Italy - Market size and forecast 2025-2030 ($ million)
Chart on Italy - Year-over-year growth 2025-2030 (%)
Data Table on Italy - Year-over-year growth 2025-2030 (%)

12.4.5 Spain - Market size and forecast 2025-2030

Chart on Spain - Market size and forecast 2025-2030 ($ million)
Data Table on Spain - Market size and forecast 2025-2030 ($ million)
Chart on Spain - Year-over-year growth 2025-2030 (%)
Data Table on Spain - Year-over-year growth 2025-2030 (%)

12.4.6 The Netherlands - Market size and forecast 2025-2030

Chart on The Netherlands - Market size and forecast 2025-2030 ($ million)
Data Table on The Netherlands - Market size and forecast 2025-2030 ($ million)
Chart on The Netherlands - Year-over-year growth 2025-2030 (%)
Data Table on The Netherlands - Year-over-year growth 2025-2030 (%)

12.5 Asia - Market size and forecast 2025-2030

Chart on Asia - Market size and forecast 2025-2030 ($ million)
Data Table on Asia - Market size and forecast 2025-2030 ($ million)
Chart on Asia - Year-over-year growth 2025-2030 (%)
Data Table on Asia - Year-over-year growth 2025-2030 (%)
Chart on Regional Comparison - Asia
Data Table on Regional Comparison - Asia

12.5.1 China - Market size and forecast 2025-2030

Chart on China - Market size and forecast 2025-2030 ($ million)
Data Table on China - Market size and forecast 2025-2030 ($ million)
Chart on China - Year-over-year growth 2025-2030 (%)
Data Table on China - Year-over-year growth 2025-2030 (%)

12.5.2 India - Market size and forecast 2025-2030

Chart on India - Market size and forecast 2025-2030 ($ million)
Data Table on India - Market size and forecast 2025-2030 ($ million)
Chart on India - Year-over-year growth 2025-2030 (%)
Data Table on India - Year-over-year growth 2025-2030 (%)

12.5.3 Japan - Market size and forecast 2025-2030

Chart on Japan - Market size and forecast 2025-2030 ($ million)
Data Table on Japan - Market size and forecast 2025-2030 ($ million)
Chart on Japan - Year-over-year growth 2025-2030 (%)
Data Table on Japan - Year-over-year growth 2025-2030 (%)

12.5.4 South Korea - Market size and forecast 2025-2030

Chart on South Korea - Market size and forecast 2025-2030 ($ million)
Data Table on South Korea - Market size and forecast 2025-2030 ($ million)
Chart on South Korea - Year-over-year growth 2025-2030 (%)
Data Table on South Korea - Year-over-year growth 2025-2030 (%)

12.5.5 Indonesia - Market size and forecast 2025-2030

Chart on Indonesia - Market size and forecast 2025-2030 ($ million)
Data Table on Indonesia - Market size and forecast 2025-2030 ($ million)
Chart on Indonesia - Year-over-year growth 2025-2030 (%)
Data Table on Indonesia - Year-over-year growth 2025-2030 (%)

12.5.6 Thailand - Market size and forecast 2025-2030

Chart on Thailand - Market size and forecast 2025-2030 ($ million)
Data Table on Thailand - Market size and forecast 2025-2030 ($ million)
Chart on Thailand - Year-over-year growth 2025-2030 (%)
Data Table on Thailand - Year-over-year growth 2025-2030 (%)

12.6 Rest of World (ROW) - Market size and forecast 2025-2030

Chart on Rest of World (ROW) - Market size and forecast 2025-2030 ($ million)
Data Table on Rest of World (ROW) - Market size and forecast 2025-2030 ($ million)
Chart on Rest of World (ROW) - Year-over-year growth 2025-2030 (%)
Data Table on Rest of World (ROW) - Year-over-year growth 2025-2030 (%)
Chart on Regional Comparison - Rest of World (ROW)
Data Table on Regional Comparison - Rest of World (ROW)

12.6.1 Brazil - Market size and forecast 2025-2030

Chart on Brazil - Market size and forecast 2025-2030 ($ million)
Data Table on Brazil - Market size and forecast 2025-2030 ($ million)
Chart on Brazil - Year-over-year growth 2025-2030 (%)
Data Table on Brazil - Year-over-year growth 2025-2030 (%)

12.6.2 Saudi Arabia - Market size and forecast 2025-2030

Chart on Saudi Arabia - Market size and forecast 2025-2030 ($ million)
Data Table on Saudi Arabia - Market size and forecast 2025-2030 ($ million)
Chart on Saudi Arabia - Year-over-year growth 2025-2030 (%)
Data Table on Saudi Arabia - Year-over-year growth 2025-2030 (%)

12.6.3 UAE - Market size and forecast 2025-2030

Chart on UAE - Market size and forecast 2025-2030 ($ million)
Data Table on UAE - Market size and forecast 2025-2030 ($ million)
Chart on UAE - Year-over-year growth 2025-2030 (%)
Data Table on UAE - Year-over-year growth 2025-2030 (%)

12.6.4 Turkey - Market size and forecast 2025-2030

Chart on Turkey - Market size and forecast 2025-2030 ($ million)
Data Table on Turkey - Market size and forecast 2025-2030 ($ million)
Chart on Turkey - Year-over-year growth 2025-2030 (%)
Data Table on Turkey - Year-over-year growth 2025-2030 (%)

12.6.5 Argentina - Market size and forecast 2025-2030

Chart on Argentina - Market size and forecast 2025-2030 ($ million)
Data Table on Argentina - Market size and forecast 2025-2030 ($ million)
Chart on Argentina - Year-over-year growth 2025-2030 (%)
Data Table on Argentina - Year-over-year growth 2025-2030 (%)

12.6.6 Colombia - Market size and forecast 2025-2030

Chart on Colombia - Market size and forecast 2025-2030 ($ million)
Data Table on Colombia - Market size and forecast 2025-2030 ($ million)
Chart on Colombia - Year-over-year growth 2025-2030 (%)
Data Table on Colombia - Year-over-year growth 2025-2030 (%)

12.6.7 South Africa - Market size and forecast 2025-2030

Chart on South Africa - Market size and forecast 2025-2030 ($ million)
Data Table on South Africa - Market size and forecast 2025-2030 ($ million)
Chart on South Africa - Year-over-year growth 2025-2030 (%)
Data Table on South Africa - Year-over-year growth 2025-2030 (%)

12.6.8 Israel - Market size and forecast 2025-2030

Chart on Israel - Market size and forecast 2025-2030 ($ million)
Data Table on Israel - Market size and forecast 2025-2030 ($ million)
Chart on Israel - Year-over-year growth 2025-2030 (%)
Data Table on Israel - Year-over-year growth 2025-2030 (%)

12.7 Market opportunity by geography

Market opportunity by geography ($ million)
Data Tables on Market opportunity by geography ($ million)

13. Drivers, Challenges, and Opportunity

13.1 Market drivers

Growing prevalence of hearing loss and ENT related disorders
Advancement of minimally invasive and precision guided treatment technologies
Expansion of healthcare infrastructure and specialist care accessibility

13.2 Market challenges

High cost burden and procurement constraints
Regulatory complexity and product approval delays
Shortage of skilled specialists and uneven healthcare access

13.3 Impact of drivers and challenges

Impact of drivers and challenges in 2025 and 2030

13.4 Market opportunities

Integration of AI driven hearing intelligence platforms
Migration toward office based and outpatient ENT procedures
Increasing convergence of hearing care with consumer connected technologies

14. Competitive Landscape

14.1 Overview

14.2

Overview on criticality of inputs and factors of differentiation

14.3 Landscape disruption

Overview on factors of disruption

14.4 Industry risks

Impact of key risks on business

15. Competitive Analysis

15.1 Companies profiled

Companies covered

15.2 Company ranking index

15.3 Market positioning of companies

Matrix on companies position and classification

15.4 Adept Medical Ltd.

Adept Medical Ltd. - Overview
Adept Medical Ltd. - Product / Service
Adept Medical Ltd. - Key offerings
SWOT

15.5 Ambu AS

Ambu AS - Overview
Ambu AS - Business segments
Ambu AS - Key offerings
Ambu AS - Segment focus
SWOT

15.6 B.Braun SE

B.Braun SE - Overview
B.Braun SE - Product / Service
B.Braun SE - Key offerings
SWOT

15.7 EON MEDITECH PVT. LTD.

EON MEDITECH PVT. LTD. - Overview
EON MEDITECH PVT. LTD. - Product / Service
EON MEDITECH PVT. LTD. - Key offerings
SWOT

15.8 Fentex Medical GmbH

Fentex Medical GmbH - Overview
Fentex Medical GmbH - Product / Service
Fentex Medical GmbH - Key offerings
SWOT

15.9 First Med Co. Ltd.

First Med Co. Ltd. - Overview
First Med Co. Ltd. - Product / Service
First Med Co. Ltd. - Key offerings
SWOT

15.10 Fujifilm Corp.

Fujifilm Corp. - Overview
Fujifilm Corp. - Business segments
Fujifilm Corp. - Key offerings
Fujifilm Corp. - Segment focus
SWOT

15.11 Gem Surgitech

Gem Surgitech - Overview
Gem Surgitech - Product / Service
Gem Surgitech - Key offerings
SWOT

15.12 HEINE Optotechnik GmbH

HEINE Optotechnik GmbH - Overview
HEINE Optotechnik GmbH - Product / Service
HEINE Optotechnik GmbH - Key offerings
SWOT

15.13 KARL STORZ SE and Co. KG

KARL STORZ SE and Co. KG - Overview
KARL STORZ SE and Co. KG - Product / Service
KARL STORZ SE and Co. KG - Key offerings
SWOT

15.14 Medtronic Plc

Medtronic Plc - Overview
Medtronic Plc - Business segments
Medtronic Plc - Key news
Medtronic Plc - Key offerings
Medtronic Plc - Segment focus
SWOT

15.15 Meril Life Sciences Pvt. Ltd.

Meril Life Sciences Pvt. Ltd. - Overview
Meril Life Sciences Pvt. Ltd. - Product / Service
Meril Life Sciences Pvt. Ltd. - Key offerings
SWOT

15.16 Olympus Corp.

Olympus Corp. - Overview
Olympus Corp. - Business segments
Olympus Corp. - Key offerings
Olympus Corp. - Segment focus
SWOT

15.17 Smith and Nephew plc

Smith and Nephew plc - Overview
Smith and Nephew plc - Business segments
Smith and Nephew plc - Key offerings
Smith and Nephew plc - Segment focus
SWOT

15.18 Stryker Corp.

Stryker Corp. - Overview
Stryker Corp. - Business segments
Stryker Corp. - Key offerings
Stryker Corp. - Segment focus
SWOT

16. Appendix

16.1 Scope of the report

Market definition
Objectives
Notes and caveats

16.2 Inclusions and exclusions checklist

Inclusions checklist
Exclusions checklist

16.3 Currency conversion rates for US$

16.4 Research methodology

16.5 Data procurement

Information sources

16.6 Data validation

16.7 Validation techniques employed for market sizing

16.8 Data synthesis

16.9 360 degree market analysis

16.10 List of abbreviations

Research Methodology

Technavio presents a detailed picture of the market by way of study, synthesis, and summation of data from multiple sources. The analysts have presented the various facets of the market with a particular focus on identifying the key industry influencers. The data thus presented is comprehensive, reliable, and the result of extensive research, both primary and secondary.

INFORMATION SOURCES

Primary sources

  • Manufacturers and suppliers
  • Channel partners
  • Industry experts
  • Strategic decision makers

Secondary sources

  • Industry journals and periodicals
  • Government data
  • Financial reports of key industry players
  • Historical data
  • Press releases

DATA ANALYSIS

Data Synthesis

  • Collation of data
  • Estimation of key figures
  • Analysis of derived insights

Data Validation

  • Triangulation with data models
  • Reference against proprietary databases
  • Corroboration with industry experts

REPORT WRITING

Qualitative

  • Market drivers
  • Market challenges
  • Market trends
  • Five forces analysis

Quantitative

  • Market size and forecast
  • Market segmentation
  • Geographical insights
  • Competitive landscape

Interested in this report?

Get your sample now to see our research methodology and insights!

Download Now

Frequently Asked Questions

Ent Devices market growth will increase by USD 9424.7 million during 2026-2030.

The Ent Devices market is expected to grow at a CAGR of 5.8% during 2026-2030.

Ent Devices market is segmented by Product (Diagnostic ENT devices, Surgical ENT devices, Hearing implants, Voice prosthetics, Nasal splints) End-user (Hospitals, ENT clinics, ASCs, Homecare) Age group (Adult, Geriatric, Pediatric)

Adept Medical Ltd., Ambu AS, B.Braun SE, EON MEDITECH PVT. LTD., Fentex Medical GmbH, First Med Co. Ltd., Fujifilm Corp., Gem Surgitech, Happersberger otopront GmbH, HEINE Optotechnik GmbH, Innovia Medical Inc., KARL STORZ SE and Co. KG, Medtronic Plc, Mega Medical Co. Ltd., Meril Life Sciences Pvt. Ltd., Nanos Medical Inc., Olympus Corp., Richard Wolf GmbH, Rudolf Riester GmbH, Smith and Nephew plc, SPIGGLE and THEIS Medizintechnik, Stryker Corp. are a few of the key vendors in the Ent Devices market.

North America will register the highest growth rate of 39.2% among the other regions. Therefore, the Ent Devices market in North America is expected to garner significant business opportunities for the vendors during the forecast period.

US, Canada, Mexico, Germany, UK, France, Italy, Spain, The Netherlands, China, India, Japan, South Korea, Indonesia, Thailand, Brazil, Saudi Arabia, UAE, Turkey, Argentina, Colombia, South Africa, Israel

  • Growing prevalence of hearing loss and ENT related disorders is the driving factor this market.

The Ent Devices market vendors should focus on grabbing business opportunities from the Product segment as it accounted for the largest market share in the base year.
RIA - Research AI Assistant
Ask RIA
