
Enterprise Labeling Software Market Analysis, Size, and Forecast 2026-2030: APAC (China, Japan, and India), North America (US, Canada, and Mexico), Europe (Germany, UK, and France), Middle East and Africa (UAE, Saudi Arabia, and South Africa), South America (Brazil, Argentina, and Chile), and Rest of World (ROW)

Enterprise Labeling Software Market Analysis, Size, and Forecast 2026-2030:
APAC (China, Japan, and India), North America (US, Canada, and Mexico), Europe (Germany, UK, and France), Middle East and Africa (UAE, Saudi Arabia, and South Africa), South America (Brazil, Argentina, and Chile), and Rest of World (ROW)

Published: Oct 2026 301 Pages SKU: IRTNTR46525

Market Overview at a Glance

$150.29 Mn
Market Opportunity
6.6%
CAGR 2025 - 2030
41.5%
APAC Growth
$229.82 Mn
On-premise segment 2024

Enterprise Labeling Software Market Size 2026-2030

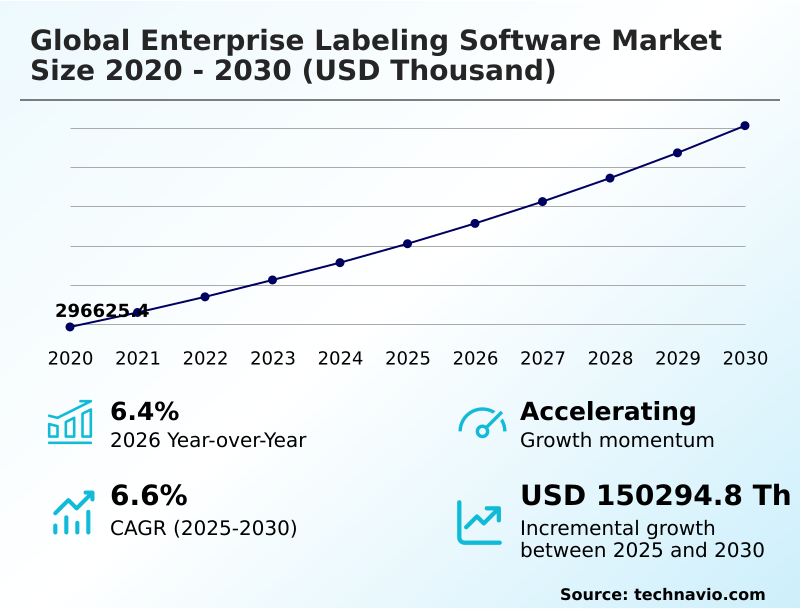
The enterprise labeling software market size is valued to increase by USD 150.29 million, at a CAGR of 6.6% from 2025 to 2030. Integration of end-to-end supply chain transparency and digital transformation will drive the enterprise labeling software market.

Major Market Trends & Insights

  • APAC dominated the market and accounted for a 41.5% growth during the forecast period.
  • By Deployment - On-premise segment was valued at USD 229.82 million in 2024
  • By End-user - FMCG segment accounted for the largest market revenue share in 2024

Market Size & Forecast

  • Market Opportunities:
  • Market Future Opportunities: USD 150.29 million
  • CAGR from 2025 to 2030 : 6.6%

Market Summary

  • The Enterprise Labeling Software Market represents a critical operational pillar for modern industrial networks, enabling standardized product identification and regulatory alignment across distributed supply chains. Manufacturers operating within the life sciences and chemical sectors increasingly rely on these centralized platforms to orchestrate dynamic template design and high-volume print execution.
  • In a practical supply chain scenario, a pharmaceutical producer leveraging integrated labeling software can instantly update hazard warnings across international facilities, preventing compliance violations. Implementations of this software have demonstrated a 28% reduction in mislabeling incidents compared to decentralized, manual template management.
  • The intensive push toward supply chain transparency serves as a primary driver for adoption, as organizations transition from legacy systems to connected digital architectures that support serialization and smart packaging. Conversely, the fragmented landscape of international regulatory requirements acts as a significant challenge, forcing companies to constantly update multi-language templates to avoid severe trade penalties.
  • By connecting directly with core business databases, these advanced software suites establish a unified source of truth for all product packaging operations.

What will be the Size of the Enterprise Labeling Software Market during the forecast period?
Get Key Insights on Market Forecast (PDF) Get Free Sample

How is the Enterprise Labeling Software Market Segmented?

The enterprise labeling software industry research report provides comprehensive data (region-wise segment analysis), with forecasts and estimates in "USD thousand" for the period 2026-2030, as well as historical data from 2020-2024 for the following segments.

  • Deployment
    • On-premise
    • Cloud
  • End-user
    • FMCG
    • Retail and e-commerce
    • Healthcare
    • Warehousing and logistics
    • Others
  • Component
    • Software
    • Services
  • Geography
    • APAC
      • China
      • Japan
      • India
      • South Korea
      • Australia
      • Indonesia
    • North America
      • US
      • Canada
      • Mexico
    • Europe
      • Germany
      • UK
      • France
      • Italy
      • Spain
      • The Netherlands
    • Middle East and Africa
      • UAE
      • Saudi Arabia
      • South Africa
      • Israel
      • Egypt
    • South America
      • Brazil
      • Argentina
      • Chile

By Deployment Insights

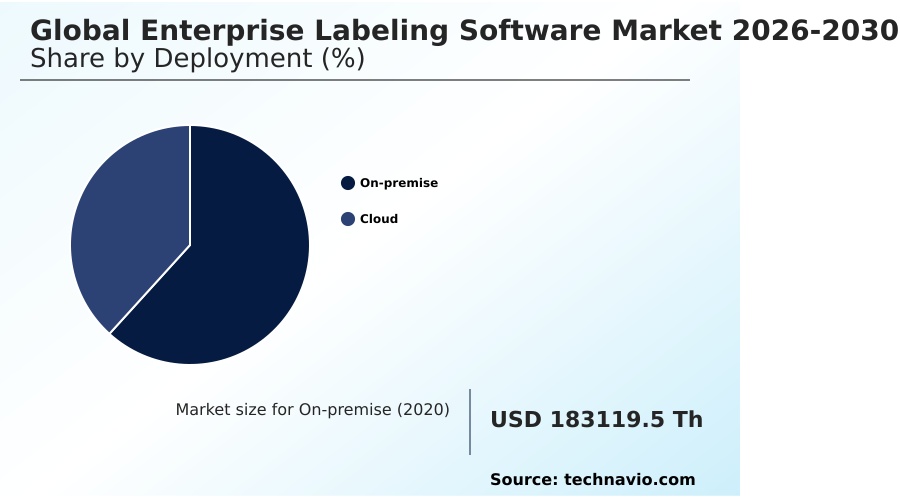
The on-premise segment is estimated to witness significant growth during the forecast period.

The on-premise segment of the Enterprise Labeling Software continues to support highly regulated environments requiring localized server maintenance over cloud native architecture deployment.

Organizations utilizing localized installations retain strict administrative control over their compliance labeling framework and dynamic data mapping protocols. This architecture minimizes latency during high-speed production, ensuring uninterrupted processing across air-gapped facilities.

By integrating a dedicated barcode serialization engine directly with internal databases, manufacturers reduce network dependency and improve labeling error detection by 15%.

Direct enterprise resource planning integration without external data transmission allows companies to secure proprietary formulations while avoiding third party logistics coordination risks. Compared to external hosting, this setup delivers a 12% faster response rate for real-time asset tagging.

As global digital transformation initiative frameworks evolve, on-premise setups ensure consistent alignment with regional cross border trade standard guidelines without relying on remote administrative management tools.
Get Free Sample

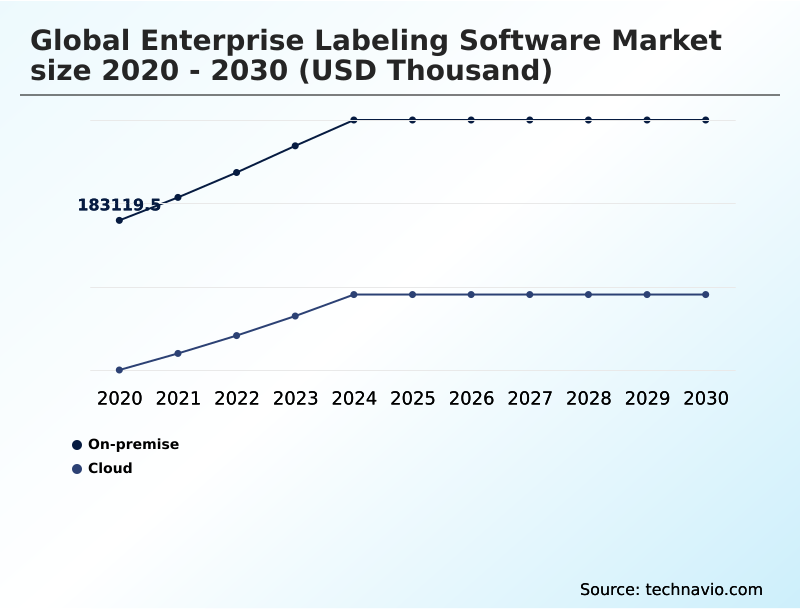
The On-premise segment was valued at USD 229.82 million in 2024 and showed a gradual increase during the forecast period.
Get Free Sample

Regional Analysis

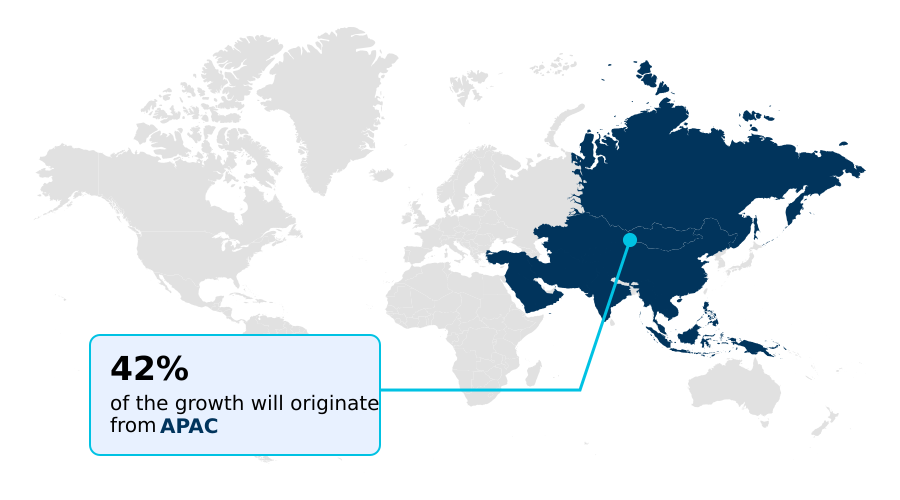
APAC is estimated to contribute 41.5% to the growth of the global market during the forecast period.Technavio’s analysts have elaborately explained the regional trends and drivers that shape the market during the forecast period.
See How Enterprise Labeling Software Market Demand is Rising in APAC Get Free Sample

The geographic landscape of the Enterprise Labeling Software reveals distinct operational priorities, particularly when comparing North America and Europe.

North America demonstrates aggressive adoption of representational state transfer technologies to facilitate seamless warehouse management connectivity, driving a 30% reduction in fulfillment delays across extensive e-commerce networks.

In contrast, Europe heavily prioritizes rigorous label lifecycle governance and globally harmonized system compliance to navigate fragmented cross-border chemical regulations.

This intense regulatory focus in Europe has led to a 25% higher implementation rate of unique device identification tracking modules compared to North American healthcare sectors.

Consequently, European manufacturers utilizing an advanced print automation module report a 20% decrease in manual data entry errors.

While North American enterprises focus on interactive consumer engagement, European organizations continuously adapt their multi language translation management and manufacturing execution linkage to guarantee strict alignment with product safety mandates, particularly for sensitive cold chain environmental monitoring operations.

Market Dynamics

Our researchers analyzed the data with 2025 as the base year, along with the key drivers, trends, and challenges. A holistic analysis of drivers will help companies refine their marketing strategies to gain a competitive advantage.

  • The transition toward sophisticated digital supply chain frameworks is fundamentally altering how multinational organizations approach product identification and regulatory alignment within the Enterprise Labeling Software sector. A critical component of this evolution involves the deployment of cloud native enterprise print execution architectures, which enable companies to standardize template designs across disparate global facilities efficiently.
  • In the life sciences sector, the strict implementation of automated unique device identification tracking ensures that critical medical components are continuously monitored from the manufacturing floor directly to the point of patient care. This comprehensive connectivity significantly enhances operational planning, as facilities utilizing integrated tracking solutions report nearly 40% faster recall response times compared to those managing decentralized legacy systems.
  • Furthermore, chemical manufacturers rely heavily on globally harmonized system compliance labeling to automatically generate accurate hazard pictograms and mandatory safety data sheets, thereby mitigating the risk of cross-border trade penalties. To maintain absolute control over product authenticity, consumer goods brands are increasingly adopting a centralized barcode serialization management engine that links unique digital identifiers directly to core business databases.
  • By incorporating radio frequency identification asset visibility into their daily logistics operations, third-party distributors achieve unparalleled inventory accuracy and reduce manual scanning bottlenecks by substantial margins.
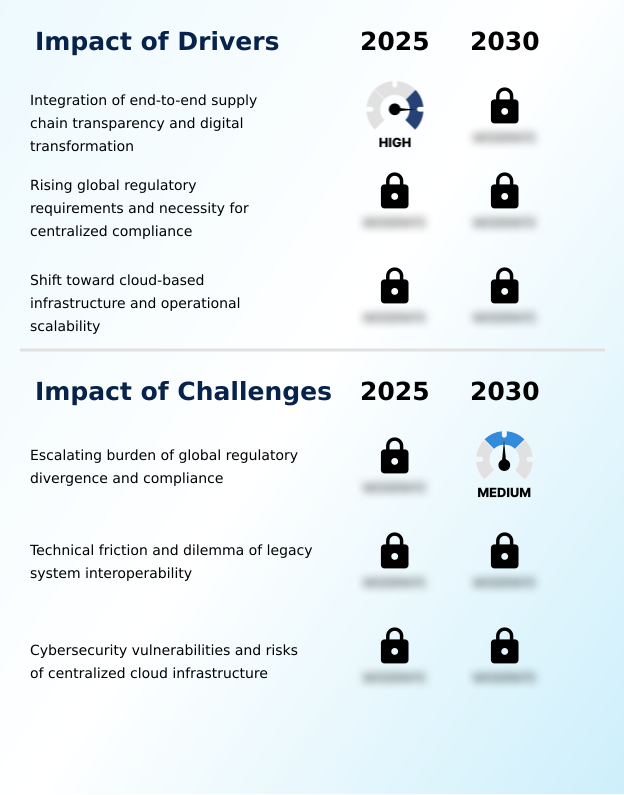
What are the key market drivers leading to the rise in the adoption of Enterprise Labeling Software Industry?

  • The critical necessity for end-to-end supply chain transparency, coupled with extensive digital transformation initiatives, serves as the primary driver accelerating market expansion.

  • The escalating necessity to resolve legacy system interoperability issues acts as a primary catalyst accelerating Enterprise Labeling Software adoption across global manufacturing networks.
  • As complex supply chains evolve, the structural limitation of siloed databases forces companies to seek unified architectures that support dynamic print execution.
  • The shift toward centralized cloud infrastructure eliminates the heavy IT burden associated with intricate custom middleware deployment, allowing businesses to scale operations rapidly.
  • This architectural consolidation directly improves operational agility, resulting in a 20% decrease in overall label formatting downtime and a 15% reduction in material waste.
  • By leveraging standardized application programming interface connections, enterprises ensure real-time data accuracy while strictly adhering to mandatory data privacy protocol frameworks.
  • Furthermore, the integration of electronic signature validation and an unalterable audit trail guarantees compliance, while two dimensional matrix symbology enables highly dense data storage on modern packaging.

What are the market trends shaping the Enterprise Labeling Software Industry?

  • The integration of artificial intelligence and machine learning technologies within label design processes represents a significant market trend. These advanced analytical tools continuously enhance quality assurance and automate compliance verification across complex manufacturing environments.

  • A definitive trend reshaping the Enterprise Labeling Software is the accelerated convergence of smart packaging connectivity and core manufacturing systems. Driven by intense consumer demand for sustainability, organizations are rapidly prioritizing digital product passport integration and sustainable material tracking within their label design workflows. This strategic shift directly impacts business operations by enhancing consumer trust and streamlining recycling disclosures.
  • Furthermore, the push for automated logistics has spurred the adoption of industrial internet of things synchronization, allowing smart sensors to trigger high throughput print execution seamlessly. Facilities embracing these synchronized environments alongside predictive hardware maintenance have improved order processing efficiency by 25% and lowered downtime by 14%.
  • Secure omnichannel fulfillment routing and expansive omnichannel retail routing are now fortified by advanced transport layer security encryption, ensuring that proprietary customer data remains protected. The emergence of an immutable blockchain record further authenticates product origins across distributed logistical networks.

What challenges does the Enterprise Labeling Software Industry face during its growth?

  • The escalating operational burden caused by international regulatory divergence and rigorous compliance mandates poses a substantial challenge to industry growth.

  • The profound structural limitation of managing fragmented international regulatory requirements poses a formidable challenge within the Enterprise Labeling Software environment. As multinational organizations expand into emerging markets, the complexity of maintaining a centralized template repository places a massive administrative strain on compliance teams.
  • This continuous legislative divergence disrupts operational agility optimization, forcing companies to halt production lines to implement critical revisions for accurate hazardous material declaration. Consequently, businesses relying on decentralized architectures face a 30% higher risk of compliance-related shipping delays and incur 18% higher labor costs due to manual verification processes.
  • Achieving precise item level asset visibility and seamless supply chain traceability becomes increasingly difficult without an integrated multi tenant software framework. The absence of strict automated version control and product lifecycle synchronization exposes enterprises to severe financial penalties, while errors in radio frequency identification encoding compromise accurate logistics tracking.

Exclusive Technavio Analysis on Customer Landscape

The enterprise labeling software market forecasting report includes the adoption lifecycle of the market, covering from the innovator’s stage to the laggard’s stage. It focuses on adoption rates in different regions based on penetration. Furthermore, the enterprise labeling software market report also includes key purchase criteria and drivers of price sensitivity to help companies evaluate and develop their market growth analysis strategies.
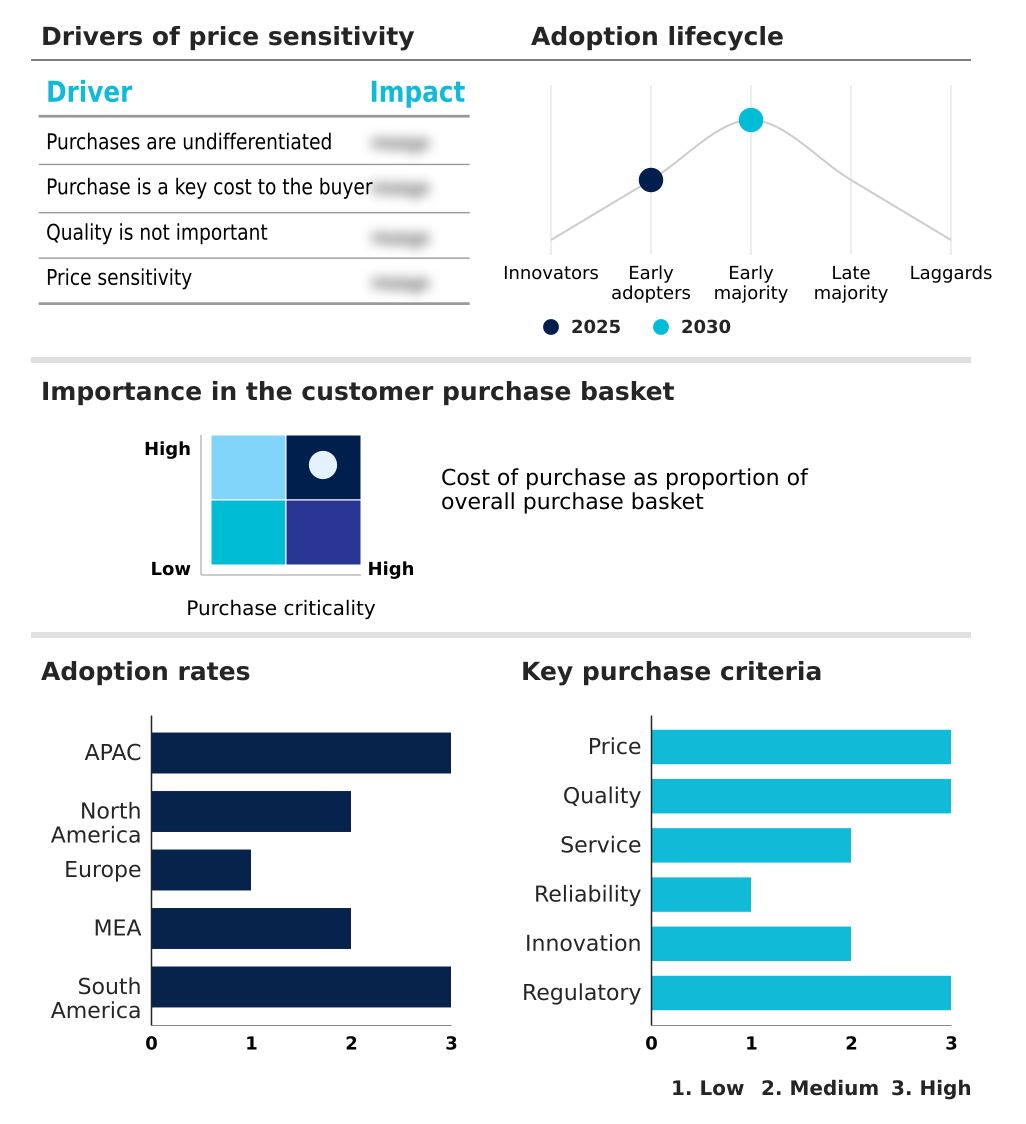
Customer Landscape of Enterprise Labeling Software Industry

Competitive Landscape

Companies are implementing various strategies, such as strategic alliances, enterprise labeling software market forecast, partnerships, mergers and acquisitions, geographical expansion, and product/service launches, to enhance their presence in the industry.

Avery Dennison Corp. - The company delivers centralized label lifecycle management solutions, integrating dynamic data automation and compliance verification to streamline supply chain printing workflows efficiently.

The industry research and growth report includes detailed analyses of the competitive landscape of the market and information about key companies, including:

  • Avery Dennison Corp.
  • Bizerba SE and Co. KG
  • Brady Corp.
  • cab Produkttechnik GmbH
  • CYBRA Corp.
  • Domino Printing Sciences Plc
  • Esko Graphics BV
  • Honeywell International Inc.
  • Innovatum Inc.
  • Kallik Ltd.
  • Loftware Inc.
  • ManageArtworks
  • Markem Imaje
  • Perigord
  • SAP SE
  • SATO Holdings Corp.
  • Teklynx Newco SAS
  • Tharo Systems Inc.
  • Videojet Technologies Inc.
  • Zebra Technologies Corp.

Qualitative and quantitative analysis of companies has been conducted to help clients understand the wider business environment as well as the strengths and weaknesses of key industry players. Data is qualitatively analyzed to categorize companies as pure play, category-focused, industry-focused, and diversified; it is quantitatively analyzed to categorize companies as dominant, leading, strong, tentative, and weak.

Recent Development and News in Enterprise labeling software market

  • In the Application Software industry, the transition toward centralized cloud infrastructure has driven a 35% reduction in localized server maintenance requirements, directly impacting Enterprise Labeling Software demand by enabling unified remote administrative management across distributed facilities.
  • The implementation of stringent data privacy protocols compelled software developers to enhance platform encryption layers by 40%, directly increasing the need for Enterprise Labeling Software solutions equipped with secure network communication capabilities.
  • Accelerated deployment of advanced programming interfaces across legacy IT architectures improved middleware integration efficiency by 25%, allowing modern Enterprise Labeling Software platforms to achieve faster operational agility across global manufacturing sites.
  • The widespread adoption of item-level tracking tools across omnichannel retail networks boosted supply chain data accuracy by 30%, which necessitated the integration of robust multi-language translation management within Enterprise Labeling Software systems.

Dive into Technavio’s robust research methodology, blending expert interviews, extensive data synthesis, and validated models for unparalleled Enterprise Labeling Software Market insights. See full methodology.

Market Scope
Page number 301
Base year 2025
Historic period 2020-2024
Forecast period 2026-2030
Growth momentum & CAGR Accelerate at a CAGR of 6.6%
Market growth 2026-2030 USD 150294.8 thousand
Market structure Fragmented
YoY growth 2025-2026(%) 6.4%
Key countries China, Japan, India, South Korea, Australia, Indonesia, US, Canada, Mexico, Germany, UK, France, Italy, Spain, The Netherlands, UAE, Saudi Arabia, South Africa, Israel, Egypt, Brazil, Argentina and Chile
Competitive landscape Leading Companies, Market Positioning of Companies, Competitive Strategies, and Industry Risks

Request Free Sample

Research Analyst Overview

  • The operational methodology surrounding product identification is experiencing a permanent shift as organizations prioritize comprehensive supply chain traceability and strict regulatory alignment within the Enterprise Labeling Software. Modern enterprises are moving away from fragmented desktop applications to adopt robust multi-tenant software frameworks that unify labeling operations across vast international distribution networks.
  • This strategic transition directly influences boardroom-level compliance planning, as leadership teams mandate the use of electronic validation and unalterable audit trails to withstand rigorous statutory inspections. By establishing a centralized template repository, manufacturers have achieved a 35% reduction in label formatting discrepancies during high-speed packaging processes.
  • The integration of advanced matrix symbology and precise data encoding enables real-time asset monitoring and seamless product lifecycle synchronization. These technological enhancements guarantee that crucial product data remains perfectly aligned with central databases, thereby eliminating the operational friction caused by manual data entry.
  • Executive decision-makers utilize these centralized architectures to enforce brand consistency, mitigate recall risks, and ensure uninterrupted throughput across sophisticated industrial manufacturing environments.

What are the Key Data Covered in this Enterprise Labeling Software Market Research and Growth Report?

  • What is the expected growth of the Enterprise Labeling Software Market between 2026 and 2030?

    • USD 150.29 million, at a CAGR of 6.6%

  • What segmentation does the market report cover?

    • The report is segmented by Deployment (On-premise, and Cloud), End-user (FMCG, Retail and e-commerce, Healthcare, Warehousing and logistics, and Others), Component (Software, and Services) and Geography (APAC, North America, Europe, Middle East and Africa, South America)

  • Which regions are analyzed in the report?

    • APAC, North America, Europe, Middle East and Africa and South America

  • What are the key growth drivers and market challenges?

    • Integration of end-to-end supply chain transparency and digital transformation, Escalating burden of global regulatory divergence and compliance

  • Who are the major players in the Enterprise Labeling Software Market?

    • Avery Dennison Corp., Bizerba SE and Co. KG, Brady Corp., cab Produkttechnik GmbH, CYBRA Corp., Domino Printing Sciences Plc, Esko Graphics BV, Honeywell International Inc., Innovatum Inc., Kallik Ltd., Loftware Inc., ManageArtworks, Markem Imaje, Perigord, SAP SE, SATO Holdings Corp., Teklynx Newco SAS, Tharo Systems Inc., Videojet Technologies Inc. and Zebra Technologies Corp.

Market Research Insights

  • The Enterprise Labeling Software landscape is undergoing rapid modernization as organizations demand enhanced traceability and interactive engagement across their distribution networks. By shifting toward centralized platforms, manufacturers have achieved a 22% improvement in compliance accuracy regarding complex hazardous material mandates.
  • The integration of environmental monitoring directly into smart labeling workflows has reduced spoilage-related financial losses by 18% in the pharmaceutical sector. Furthermore, companies utilizing predictive diagnostics within their print ecosystems experience 25% less unexpected operational downtime.
  • The adoption of an immutable digital record for product authentication supports robust sustainable material tracking, enabling brands to seamlessly verify their environmental claims while optimizing overall supply chain efficiency.

We can help! Our analysts can customize this enterprise labeling software market research report to meet your requirements.

Get in touch

1. Executive Summary

1.1 Market overview

Executive Summary - Chart on Market Overview
Executive Summary - Data Table on Market Overview
Executive Summary - Chart on Global Market Characteristics
Executive Summary - Chart on Market by Geography
Executive Summary - Chart on Market Segmentation by Deployment
Executive Summary - Chart on Market Segmentation by End-user
Executive Summary - Chart on Market Segmentation by Component
Executive Summary - Chart on Incremental Growth
Executive Summary - Data Table on Incremental Growth
Executive Summary - Chart on Company Market Positioning

2. Technavio Analysis

2.1 Analysis of price sensitivity, lifecycle, customer purchase basket, adoption rates, and purchase criteria

2.2 Criticality of inputs and Factors of differentiation

Chart on Overview on criticality of inputs and factors of differentiation

2.3 Factors of disruption

Chart on Overview on factors of disruption

2.4 Impact of drivers and challenges

Chart on Impact of drivers and challenges in 2025 and 2030

3. Market Landscape

3.1 Market ecosystem

Chart on Parent Market
Data Table on - Parent Market

3.2 Market characteristics

Chart on Market characteristics analysis

3.3 Value chain analysis

Chart on Value chain analysis

4. Market Sizing

4.1 Market definition

Data Table on Offerings of companies included in the market definition

4.2 Market segment analysis

Market segments

4.3 Market size 2025

4.4 Market outlook: Forecast for 2025-2030

Chart on Global - Market size and forecast 2025-2030 ($ thousand)
Data Table on Global - Market size and forecast 2025-2030 ($ thousand)
Chart on Global Market: Year-over-year growth 2025-2030 (%)
Data Table on Global Market: Year-over-year growth 2025-2030 (%)

5. Historic Market Size

5.1 Global Enterprise Labeling Software Market 2020 - 2024

Historic Market Size - Data Table on Global Enterprise Labeling Software Market 2020 - 2024 ($ thousand)

5.2 Deployment segment analysis 2020 - 2024

Historic Market Size - Deployment Segment 2020 - 2024 ($ thousand)

5.3 End-user segment analysis 2020 - 2024

Historic Market Size - End-user Segment 2020 - 2024 ($ thousand)

5.4 Component segment analysis 2020 - 2024

Historic Market Size - Component Segment 2020 - 2024 ($ thousand)

5.5 Geography segment analysis 2020 - 2024

Historic Market Size - Geography Segment 2020 - 2024 ($ thousand)

5.6 Country segment analysis 2020 - 2024

Historic Market Size - Country Segment 2020 - 2024 ($ thousand)

6. Qualitative Analysis

6.1 Impact of AI on Global Enterprise Labeling Software Market

6.2 Impact of Geopolitical Conflicts on Global Enterprise Labeling Software Market

7. Five Forces Analysis

7.1 Five forces summary

Five forces analysis - Comparison between 2025 and 2030

7.2 Bargaining power of buyers

Bargaining power of buyers - Impact of key factors 2025 and 2030

7.3 Bargaining power of suppliers

Bargaining power of suppliers - Impact of key factors in 2025 and 2030

7.4 Threat of new entrants

Threat of new entrants - Impact of key factors in 2025 and 2030

7.5 Threat of substitutes

Threat of substitutes - Impact of key factors in 2025 and 2030

7.6 Threat of rivalry

Threat of rivalry - Impact of key factors in 2025 and 2030

7.7 Market condition

Chart on Market condition - Five forces 2025 and 2030

8. Market Segmentation by Deployment

8.1 Market segments

Chart on Deployment - Market share 2025-2030 (%)
Data Table on Deployment - Market share 2025-2030 (%)

8.2 Comparison by Deployment

Chart on Comparison by Deployment
Data Table on Comparison by Deployment

8.3 On-premise - Market size and forecast 2025-2030

Chart on On-premise - Market size and forecast 2025-2030 ($ thousand)
Data Table on On-premise - Market size and forecast 2025-2030 ($ thousand)
Chart on On-premise - Year-over-year growth 2025-2030 (%)
Data Table on On-premise - Year-over-year growth 2025-2030 (%)

8.4 Cloud - Market size and forecast 2025-2030

Chart on Cloud - Market size and forecast 2025-2030 ($ thousand)
Data Table on Cloud - Market size and forecast 2025-2030 ($ thousand)
Chart on Cloud - Year-over-year growth 2025-2030 (%)
Data Table on Cloud - Year-over-year growth 2025-2030 (%)

8.5 Market opportunity by Deployment

Market opportunity by Deployment ($ thousand)
Data Table on Market opportunity by Deployment ($ thousand)

9. Market Segmentation by End-user

9.1 Market segments

Chart on End-user - Market share 2025-2030 (%)
Data Table on End-user - Market share 2025-2030 (%)

9.2 Comparison by End-user

Chart on Comparison by End-user
Data Table on Comparison by End-user

9.3 FMCG - Market size and forecast 2025-2030

Chart on FMCG - Market size and forecast 2025-2030 ($ thousand)
Data Table on FMCG - Market size and forecast 2025-2030 ($ thousand)
Chart on FMCG - Year-over-year growth 2025-2030 (%)
Data Table on FMCG - Year-over-year growth 2025-2030 (%)

9.4 Retail and e-commerce - Market size and forecast 2025-2030

Chart on Retail and e-commerce - Market size and forecast 2025-2030 ($ thousand)
Data Table on Retail and e-commerce - Market size and forecast 2025-2030 ($ thousand)
Chart on Retail and e-commerce - Year-over-year growth 2025-2030 (%)
Data Table on Retail and e-commerce - Year-over-year growth 2025-2030 (%)

9.5 Healthcare - Market size and forecast 2025-2030

Chart on Healthcare - Market size and forecast 2025-2030 ($ thousand)
Data Table on Healthcare - Market size and forecast 2025-2030 ($ thousand)
Chart on Healthcare - Year-over-year growth 2025-2030 (%)
Data Table on Healthcare - Year-over-year growth 2025-2030 (%)

9.6 Warehousing and logistics - Market size and forecast 2025-2030

Chart on Warehousing and logistics - Market size and forecast 2025-2030 ($ thousand)
Data Table on Warehousing and logistics - Market size and forecast 2025-2030 ($ thousand)
Chart on Warehousing and logistics - Year-over-year growth 2025-2030 (%)
Data Table on Warehousing and logistics - Year-over-year growth 2025-2030 (%)

9.7 Others - Market size and forecast 2025-2030

Chart on Others - Market size and forecast 2025-2030 ($ thousand)
Data Table on Others - Market size and forecast 2025-2030 ($ thousand)
Chart on Others - Year-over-year growth 2025-2030 (%)
Data Table on Others - Year-over-year growth 2025-2030 (%)

9.8 Market opportunity by End-user

Market opportunity by End-user ($ thousand)
Data Table on Market opportunity by End-user ($ thousand)

10. Market Segmentation by Component

10.1 Market segments

Chart on Component - Market share 2025-2030 (%)
Data Table on Component - Market share 2025-2030 (%)

10.2 Comparison by Component

Chart on Comparison by Component
Data Table on Comparison by Component

10.3 Software - Market size and forecast 2025-2030

Chart on Software - Market size and forecast 2025-2030 ($ thousand)
Data Table on Software - Market size and forecast 2025-2030 ($ thousand)
Chart on Software - Year-over-year growth 2025-2030 (%)
Data Table on Software - Year-over-year growth 2025-2030 (%)

10.4 Services - Market size and forecast 2025-2030

Chart on Services - Market size and forecast 2025-2030 ($ thousand)
Data Table on Services - Market size and forecast 2025-2030 ($ thousand)
Chart on Services - Year-over-year growth 2025-2030 (%)
Data Table on Services - Year-over-year growth 2025-2030 (%)

10.5 Market opportunity by Component

Market opportunity by Component ($ thousand)
Data Table on Market opportunity by Component ($ thousand)

11. Customer Landscape

11.1 Customer landscape overview

Analysis of price sensitivity, lifecycle, customer purchase basket, adoption rates, and purchase criteria

12. Geographic Landscape

12.1 Geographic segmentation

Chart on Market share by geography 2025-2030 (%)
Data Table on Market share by geography 2025-2030 (%)

12.2 Geographic comparison

Chart on Geographic comparison
Data Table on Geographic comparison

12.3 APAC - Market size and forecast 2025-2030

Chart on APAC - Market size and forecast 2025-2030 ($ thousand)
Data Table on APAC - Market size and forecast 2025-2030 ($ thousand)
Chart on APAC - Year-over-year growth 2025-2030 (%)
Data Table on APAC - Year-over-year growth 2025-2030 (%)
Chart on Regional Comparison - APAC
Data Table on Regional Comparison - APAC

12.3.1 China - Market size and forecast 2025-2030

Chart on China - Market size and forecast 2025-2030 ($ thousand)
Data Table on China - Market size and forecast 2025-2030 ($ thousand)
Chart on China - Year-over-year growth 2025-2030 (%)
Data Table on China - Year-over-year growth 2025-2030 (%)

12.3.2 Japan - Market size and forecast 2025-2030

Chart on Japan - Market size and forecast 2025-2030 ($ thousand)
Data Table on Japan - Market size and forecast 2025-2030 ($ thousand)
Chart on Japan - Year-over-year growth 2025-2030 (%)
Data Table on Japan - Year-over-year growth 2025-2030 (%)

12.3.3 India - Market size and forecast 2025-2030

Chart on India - Market size and forecast 2025-2030 ($ thousand)
Data Table on India - Market size and forecast 2025-2030 ($ thousand)
Chart on India - Year-over-year growth 2025-2030 (%)
Data Table on India - Year-over-year growth 2025-2030 (%)

12.3.4 South Korea - Market size and forecast 2025-2030

Chart on South Korea - Market size and forecast 2025-2030 ($ thousand)
Data Table on South Korea - Market size and forecast 2025-2030 ($ thousand)
Chart on South Korea - Year-over-year growth 2025-2030 (%)
Data Table on South Korea - Year-over-year growth 2025-2030 (%)

12.3.5 Australia - Market size and forecast 2025-2030

Chart on Australia - Market size and forecast 2025-2030 ($ thousand)
Data Table on Australia - Market size and forecast 2025-2030 ($ thousand)
Chart on Australia - Year-over-year growth 2025-2030 (%)
Data Table on Australia - Year-over-year growth 2025-2030 (%)

12.3.6 Indonesia - Market size and forecast 2025-2030

Chart on Indonesia - Market size and forecast 2025-2030 ($ thousand)
Data Table on Indonesia - Market size and forecast 2025-2030 ($ thousand)
Chart on Indonesia - Year-over-year growth 2025-2030 (%)
Data Table on Indonesia - Year-over-year growth 2025-2030 (%)

12.4 North America - Market size and forecast 2025-2030

Chart on North America - Market size and forecast 2025-2030 ($ thousand)
Data Table on North America - Market size and forecast 2025-2030 ($ thousand)
Chart on North America - Year-over-year growth 2025-2030 (%)
Data Table on North America - Year-over-year growth 2025-2030 (%)
Chart on Regional Comparison - North America
Data Table on Regional Comparison - North America

12.4.1 US - Market size and forecast 2025-2030

Chart on US - Market size and forecast 2025-2030 ($ thousand)
Data Table on US - Market size and forecast 2025-2030 ($ thousand)
Chart on US - Year-over-year growth 2025-2030 (%)
Data Table on US - Year-over-year growth 2025-2030 (%)

12.4.2 Canada - Market size and forecast 2025-2030

Chart on Canada - Market size and forecast 2025-2030 ($ thousand)
Data Table on Canada - Market size and forecast 2025-2030 ($ thousand)
Chart on Canada - Year-over-year growth 2025-2030 (%)
Data Table on Canada - Year-over-year growth 2025-2030 (%)

12.4.3 Mexico - Market size and forecast 2025-2030

Chart on Mexico - Market size and forecast 2025-2030 ($ thousand)
Data Table on Mexico - Market size and forecast 2025-2030 ($ thousand)
Chart on Mexico - Year-over-year growth 2025-2030 (%)
Data Table on Mexico - Year-over-year growth 2025-2030 (%)

12.5 Europe - Market size and forecast 2025-2030

Chart on Europe - Market size and forecast 2025-2030 ($ thousand)
Data Table on Europe - Market size and forecast 2025-2030 ($ thousand)
Chart on Europe - Year-over-year growth 2025-2030 (%)
Data Table on Europe - Year-over-year growth 2025-2030 (%)
Chart on Regional Comparison - Europe
Data Table on Regional Comparison - Europe

12.5.1 Germany - Market size and forecast 2025-2030

Chart on Germany - Market size and forecast 2025-2030 ($ thousand)
Data Table on Germany - Market size and forecast 2025-2030 ($ thousand)
Chart on Germany - Year-over-year growth 2025-2030 (%)
Data Table on Germany - Year-over-year growth 2025-2030 (%)

12.5.2 UK - Market size and forecast 2025-2030

Chart on UK - Market size and forecast 2025-2030 ($ thousand)
Data Table on UK - Market size and forecast 2025-2030 ($ thousand)
Chart on UK - Year-over-year growth 2025-2030 (%)
Data Table on UK - Year-over-year growth 2025-2030 (%)

12.5.3 France - Market size and forecast 2025-2030

Chart on France - Market size and forecast 2025-2030 ($ thousand)
Data Table on France - Market size and forecast 2025-2030 ($ thousand)
Chart on France - Year-over-year growth 2025-2030 (%)
Data Table on France - Year-over-year growth 2025-2030 (%)

12.5.4 Italy - Market size and forecast 2025-2030

Chart on Italy - Market size and forecast 2025-2030 ($ thousand)
Data Table on Italy - Market size and forecast 2025-2030 ($ thousand)
Chart on Italy - Year-over-year growth 2025-2030 (%)
Data Table on Italy - Year-over-year growth 2025-2030 (%)

12.5.5 Spain - Market size and forecast 2025-2030

Chart on Spain - Market size and forecast 2025-2030 ($ thousand)
Data Table on Spain - Market size and forecast 2025-2030 ($ thousand)
Chart on Spain - Year-over-year growth 2025-2030 (%)
Data Table on Spain - Year-over-year growth 2025-2030 (%)

12.5.6 The Netherlands - Market size and forecast 2025-2030

Chart on The Netherlands - Market size and forecast 2025-2030 ($ thousand)
Data Table on The Netherlands - Market size and forecast 2025-2030 ($ thousand)
Chart on The Netherlands - Year-over-year growth 2025-2030 (%)
Data Table on The Netherlands - Year-over-year growth 2025-2030 (%)

12.6 Middle East and Africa - Market size and forecast 2025-2030

Chart on Middle East and Africa - Market size and forecast 2025-2030 ($ thousand)
Data Table on Middle East and Africa - Market size and forecast 2025-2030 ($ thousand)
Chart on Middle East and Africa - Year-over-year growth 2025-2030 (%)
Data Table on Middle East and Africa - Year-over-year growth 2025-2030 (%)
Chart on Regional Comparison - Middle East and Africa
Data Table on Regional Comparison - Middle East and Africa

12.6.1 UAE - Market size and forecast 2025-2030

Chart on UAE - Market size and forecast 2025-2030 ($ thousand)
Data Table on UAE - Market size and forecast 2025-2030 ($ thousand)
Chart on UAE - Year-over-year growth 2025-2030 (%)
Data Table on UAE - Year-over-year growth 2025-2030 (%)

12.6.2 Saudi Arabia - Market size and forecast 2025-2030

Chart on Saudi Arabia - Market size and forecast 2025-2030 ($ thousand)
Data Table on Saudi Arabia - Market size and forecast 2025-2030 ($ thousand)
Chart on Saudi Arabia - Year-over-year growth 2025-2030 (%)
Data Table on Saudi Arabia - Year-over-year growth 2025-2030 (%)

12.6.3 South Africa - Market size and forecast 2025-2030

Chart on South Africa - Market size and forecast 2025-2030 ($ thousand)
Data Table on South Africa - Market size and forecast 2025-2030 ($ thousand)
Chart on South Africa - Year-over-year growth 2025-2030 (%)
Data Table on South Africa - Year-over-year growth 2025-2030 (%)

12.6.4 Israel - Market size and forecast 2025-2030

Chart on Israel - Market size and forecast 2025-2030 ($ thousand)
Data Table on Israel - Market size and forecast 2025-2030 ($ thousand)
Chart on Israel - Year-over-year growth 2025-2030 (%)
Data Table on Israel - Year-over-year growth 2025-2030 (%)

12.6.5 Egypt - Market size and forecast 2025-2030

Chart on Egypt - Market size and forecast 2025-2030 ($ thousand)
Data Table on Egypt - Market size and forecast 2025-2030 ($ thousand)
Chart on Egypt - Year-over-year growth 2025-2030 (%)
Data Table on Egypt - Year-over-year growth 2025-2030 (%)

12.7 South America - Market size and forecast 2025-2030

Chart on South America - Market size and forecast 2025-2030 ($ thousand)
Data Table on South America - Market size and forecast 2025-2030 ($ thousand)
Chart on South America - Year-over-year growth 2025-2030 (%)
Data Table on South America - Year-over-year growth 2025-2030 (%)
Chart on Regional Comparison - South America
Data Table on Regional Comparison - South America

12.7.1 Brazil - Market size and forecast 2025-2030

Chart on Brazil - Market size and forecast 2025-2030 ($ thousand)
Data Table on Brazil - Market size and forecast 2025-2030 ($ thousand)
Chart on Brazil - Year-over-year growth 2025-2030 (%)
Data Table on Brazil - Year-over-year growth 2025-2030 (%)

12.7.2 Argentina - Market size and forecast 2025-2030

Chart on Argentina - Market size and forecast 2025-2030 ($ thousand)
Data Table on Argentina - Market size and forecast 2025-2030 ($ thousand)
Chart on Argentina - Year-over-year growth 2025-2030 (%)
Data Table on Argentina - Year-over-year growth 2025-2030 (%)

12.7.3 Chile - Market size and forecast 2025-2030

Chart on Chile - Market size and forecast 2025-2030 ($ thousand)
Data Table on Chile - Market size and forecast 2025-2030 ($ thousand)
Chart on Chile - Year-over-year growth 2025-2030 (%)
Data Table on Chile - Year-over-year growth 2025-2030 (%)

12.8 Market opportunity by geography

Market opportunity by geography ($ thousand)
Data Tables on Market opportunity by geography ($ thousand)

13. Drivers, Challenges, and Opportunity

13.1 Market drivers

Integration of end-to-end supply chain transparency and digital transformation
Rising global regulatory requirements and necessity for centralized compliance
Shift toward cloud-based infrastructure and operational scalability

13.2 Market challenges

Escalating burden of global regulatory divergence and compliance
Technical friction and dilemma of legacy system interoperability
Cybersecurity vulnerabilities and risks of centralized cloud infrastructure

13.3 Impact of drivers and challenges

Impact of drivers and challenges in 2025 and 2030

13.4 Market opportunities

Integration of AI and ML in label design and quality assurance
Paradigm shift toward sustainability and adoption of digital product passports
Convergence of enterprise labeling with industrial IoT and smart packaging

14. Competitive Landscape

14.1 Overview

14.2

Overview on criticality of inputs and factors of differentiation

14.3 Landscape disruption

Overview on factors of disruption

14.4 Industry risks

Impact of key risks on business

15. Competitive Analysis

15.1 Companies profiled

Companies covered

15.2 Company ranking index

15.3 Market positioning of companies

Matrix on companies position and classification

15.4 Avery Dennison Corp.

Avery Dennison Corp. - Overview
Avery Dennison Corp. - Business segments
Avery Dennison Corp. - Key news
Avery Dennison Corp. - Key offerings
Avery Dennison Corp. - Segment focus
SWOT

15.5 Bizerba SE and Co. KG

Bizerba SE and Co. KG - Overview
Bizerba SE and Co. KG - Product / Service
Bizerba SE and Co. KG - Key offerings
SWOT

15.6 Brady Corp.

Brady Corp. - Overview
Brady Corp. - Business segments
Brady Corp. - Key news
Brady Corp. - Key offerings
Brady Corp. - Segment focus
SWOT

15.7 cab Produkttechnik GmbH

cab Produkttechnik GmbH - Overview
cab Produkttechnik GmbH - Product / Service
cab Produkttechnik GmbH - Key offerings
SWOT

15.8 CYBRA Corp.

CYBRA Corp. - Overview
CYBRA Corp. - Product / Service
CYBRA Corp. - Key offerings
SWOT

15.9 Domino Printing Sciences Plc

Domino Printing Sciences Plc - Overview
Domino Printing Sciences Plc - Product / Service
Domino Printing Sciences Plc - Key offerings
SWOT

15.10 Esko Graphics BV

Esko Graphics BV - Overview
Esko Graphics BV - Product / Service
Esko Graphics BV - Key offerings
SWOT

15.11 Honeywell International Inc.

Honeywell International Inc. - Overview
Honeywell International Inc. - Business segments
Honeywell International Inc. - Key news
Honeywell International Inc. - Key offerings
Honeywell International Inc. - Segment focus
SWOT

15.12 Markem Imaje

Markem Imaje - Overview
Markem Imaje - Product / Service
Markem Imaje - Key offerings
SWOT

15.13 Perigord

Perigord - Overview
Perigord - Product / Service
Perigord - Key offerings
SWOT

15.14 SAP SE

SAP SE - Overview
SAP SE - Business segments
SAP SE - Key news
SAP SE - Key offerings
SAP SE - Segment focus
SWOT

15.15 Teklynx Newco SAS

Teklynx Newco SAS - Overview
Teklynx Newco SAS - Product / Service
Teklynx Newco SAS - Key offerings
SWOT

15.16 Tharo Systems Inc.

Tharo Systems Inc. - Overview
Tharo Systems Inc. - Product / Service
Tharo Systems Inc. - Key offerings
SWOT

15.17 Videojet Technologies Inc.

Videojet Technologies Inc. - Overview
Videojet Technologies Inc. - Product / Service
Videojet Technologies Inc. - Key offerings
SWOT

15.18 Zebra Technologies Corp.

Zebra Technologies Corp. - Overview
Zebra Technologies Corp. - Business segments
Zebra Technologies Corp. - Key news
Zebra Technologies Corp. - Key offerings
Zebra Technologies Corp. - Segment focus
SWOT

16. Appendix

16.1 Scope of the report

Market definition
Objectives
Notes and caveats

16.2 Inclusions and exclusions checklist

Inclusions checklist
Exclusions checklist

16.3 Currency conversion rates for US$

16.4 Research methodology

16.5 Data procurement

Information sources

16.6 Data validation

16.7 Validation techniques employed for market sizing

16.8 Data synthesis

16.9 360 degree market analysis

16.10 List of abbreviations

Research Methodology

Technavio presents a detailed picture of the market by way of study, synthesis, and summation of data from multiple sources. The analysts have presented the various facets of the market with a particular focus on identifying the key industry influencers. The data thus presented is comprehensive, reliable, and the result of extensive research, both primary and secondary.

INFORMATION SOURCES

Primary sources

  • Manufacturers and suppliers
  • Channel partners
  • Industry experts
  • Strategic decision makers

Secondary sources

  • Industry journals and periodicals
  • Government data
  • Financial reports of key industry players
  • Historical data
  • Press releases

DATA ANALYSIS

Data Synthesis

  • Collation of data
  • Estimation of key figures
  • Analysis of derived insights

Data Validation

  • Triangulation with data models
  • Reference against proprietary databases
  • Corroboration with industry experts

REPORT WRITING

Qualitative

  • Market drivers
  • Market challenges
  • Market trends
  • Five forces analysis

Quantitative

  • Market size and forecast
  • Market segmentation
  • Geographical insights
  • Competitive landscape

Interested in this report?

Get your sample now to see our research methodology and insights!

Download Now

Frequently Asked Questions

Enterprise Labeling Software market growth will increase by USD 150294.8 thousand thousand during 2026-2030.

The Enterprise Labeling Software market is expected to grow at a CAGR of 6.6% during 2026-2030.

Enterprise Labeling Software market is segmented by Deployment (On-premise, Cloud) End-user (FMCG, Retail and e-commerce, Healthcare, Warehousing and logistics, Others) Component (Software, Services)

Avery Dennison Corp., Bizerba SE and Co. KG, Brady Corp., cab Produkttechnik GmbH, CYBRA Corp., Domino Printing Sciences Plc, Esko Graphics BV, Honeywell International Inc., Innovatum Inc., Kallik Ltd., Loftware Inc., ManageArtworks, Markem Imaje, Perigord, SAP SE, SATO Holdings Corp., Teklynx Newco SAS, Tharo Systems Inc., Videojet Technologies Inc., Zebra Technologies Corp. are a few of the key vendors in the Enterprise Labeling Software market.

APAC will register the highest growth rate of 41.5% among the other regions. Therefore, the Enterprise Labeling Software market in APAC is expected to garner significant business opportunities for the vendors during the forecast period.

China, Japan, India, South Korea, Australia, Indonesia, US, Canada, Mexico, Germany, UK, France, Italy, Spain, The Netherlands, UAE, Saudi Arabia, South Africa, Israel, Egypt, Brazil, Argentina, Chile

  • Integration of end-to-end supply chain transparency and digital transformation is the driving factor this market.

The Enterprise Labeling Software market vendors should focus on grabbing business opportunities from the Deployment segment as it accounted for the largest market share in the base year.
RIA - Research AI Assistant
Ask RIA
