
Epedigree Software Market Analysis, Size, and Forecast 2026-2030: North America (US, Canada, and Mexico), Europe (Germany, UK, and France), APAC (China, Japan, and India), South America (Brazil, Argentina, and Chile), Middle East and Africa (Saudi Arabia, UAE, and South Africa), and Rest of World (ROW)

Epedigree Software Market Analysis, Size, and Forecast 2026-2030:
North America (US, Canada, and Mexico), Europe (Germany, UK, and France), APAC (China, Japan, and India), South America (Brazil, Argentina, and Chile), Middle East and Africa (Saudi Arabia, UAE, and South Africa), and Rest of World (ROW)

Published: Oct 2026 287 Pages SKU: IRTNTR41063

Market Overview at a Glance

$5.64 B
Market Opportunity
19.1%
CAGR 2025 - 2030
35.7%
Europe Growth
$1.78 B
Cloud segment 2024

Epedigree Software Market Size 2026-2030

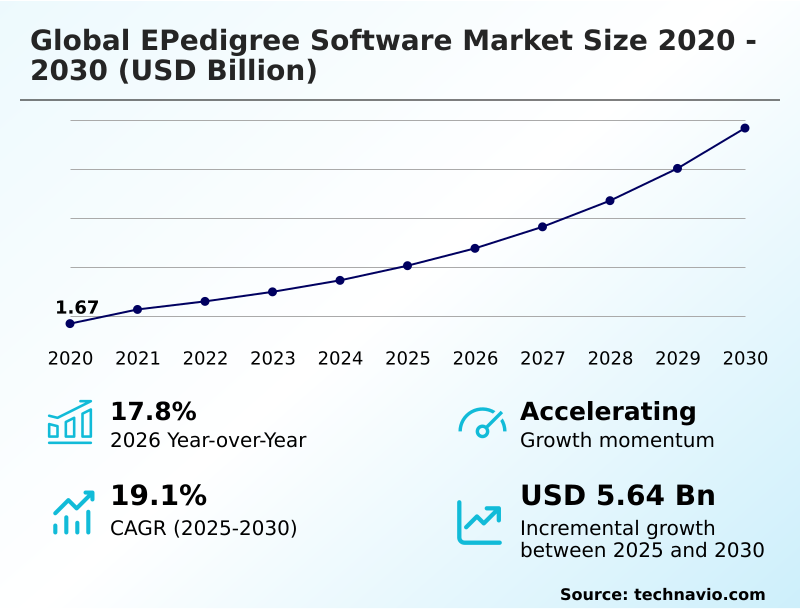
The epedigree software market size is valued to increase by USD 5.64 billion, at a CAGR of 19.1% from 2025 to 2030. Strict global regulatory mandates for pharmaceutical traceability will drive the epedigree software market.

Major Market Trends & Insights

  • Europe dominated the market and accounted for a 35.7% growth during the forecast period.
  • By Deployment - Cloud segment was valued at USD 1.78 billion in 2024
  • By End-user - Large enterprise segment accounted for the largest market revenue share in 2024

Market Size & Forecast

  • Market Opportunities: USD 8.01 billion
  • Market Future Opportunities: USD 5.64 billion
  • CAGR from 2025 to 2030 : 19.1%

Market Summary

  • The Global EPedigree Software Market 2026-2030 demonstrates robust structural expansion driven by urgent requirements for secure pharmaceutical traceability and counterfeit prevention. Stringent track-and-trace mandates force healthcare manufacturers to deploy advanced compliance platforms to secure their distribution channels. For instance, multinational distributors implementing centralized verification platforms have successfully reduced inventory stockouts by 18% while enhancing recall efficiency.
  • Strict global regulatory mandates for pharmaceutical traceability serve as the primary catalyst, compelling organizations to modernize their tracking infrastructure to avoid severe legal penalties. Conversely, cross-border interoperability and heterogeneous global data standards act as a significant barrier, frequently causing data latency during international customs transfers. Enterprises actively upgrade their digital architectures to maintain uninterrupted operations and protect public health.
  • The continuous shift toward automated verification ensures that businesses maintain absolute compliance while optimizing broader logistics networks.

What will be the Size of the Epedigree Software Market during the forecast period?
Get Key Insights on Market Forecast (PDF) Get Free Sample

How is the Epedigree Software Market Segmented?

The epedigree software industry research report provides comprehensive data (region-wise segment analysis), with forecasts and estimates in "USD million" for the period 2026-2030, as well as historical data from 2020-2024 for the following segments.

  • Deployment
    • Cloud
    • On-premises
  • End-user
    • Large enterprise
    • Small and medium enterprises
  • Component
    • Software
    • Services
  • Geography
    • North America
      • US
      • Canada
      • Mexico
    • Europe
      • Germany
      • UK
      • France
      • Italy
      • Spain
      • The Netherlands
    • APAC
      • China
      • Japan
      • India
      • South Korea
      • Australia
      • Indonesia
    • South America
      • Brazil
      • Argentina
      • Chile
    • Middle East and Africa
      • Saudi Arabia
      • UAE
      • South Africa
      • Israel
      • Turkey

By Deployment Insights

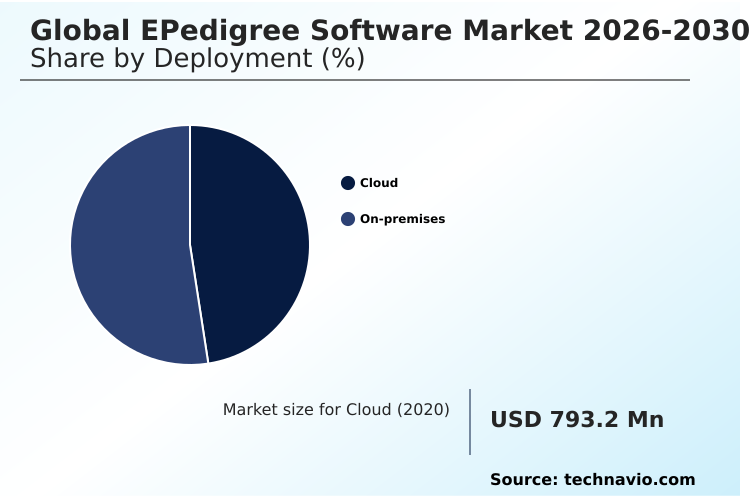
The cloud segment is estimated to witness significant growth during the forecast period.

The cloud deployment segment fundamentally reshapes Epedigree Software functionality by delivering scalable compliance architectures across distributed pharmaceutical networks. Modern software-as-a-service platforms enable seamless multi-enterprise network orchestration without the heavy maintenance required by local server infrastructure.

Centralized cloud-native control towers provide organizations with instant regulatory updates and synchronized data sharing, reducing compliance reporting delays by up to 25%.

This architectural shift allows companies to bypass complex database architecture design requirements while ensuring real-time visibility into supply chain events.

By centralizing serialization management into a single digital hub, enterprise operators gain a 30% improvement in error detection and faster product verification.

The transition toward cloud environments directly supports continuous global operations, ensuring uncompromised traceability and operational agility across massive multinational trade routes.
Get Free Sample

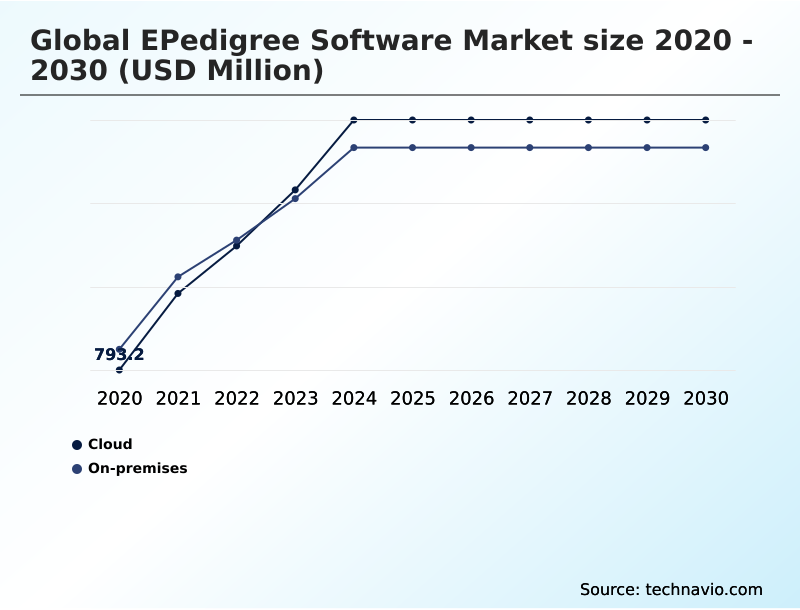
The Cloud segment was valued at USD 1.78 billion in 2024 and showed a gradual increase during the forecast period.
Get Free Sample

Regional Analysis

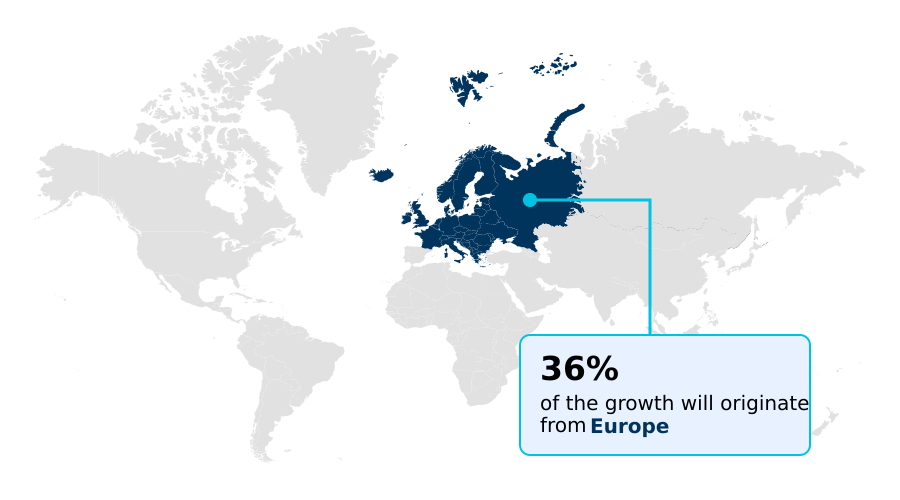
Europe is estimated to contribute 35.7% to the growth of the global market during the forecast period.Technavio’s analysts have elaborately explained the regional trends and drivers that shape the market during the forecast period.
See How Epedigree Software Market Demand is Rising in Europe Get Free Sample

The regional adoption of Epedigree Software highlights significant operational differences driven by distinct regulatory frameworks and supply chain maturity.

North America leads the transition with widespread implementation of electronic product code capabilities, ensuring comprehensive product tracing and achieving a 28% higher compliance automation rate than other regions.

Europe heavily prioritizes cryptographic verification to align with strict falsified medicine directives, reducing illicit product infiltration by 15% across major pharmacy networks. APAC demonstrates rapid digital chain of custody adoption, supported by massive pharmaceutical manufacturing expansions and regional modernization initiatives.

Asian facilities are aggressively integrating enterprise resource planning systems with modern traceability tools to handle surging export volumes.

Meanwhile, warehouse management systems and customized application programming interface connections allow European and North America distributors to streamline complex multi-tier distribution logistics seamlessly.

Market Dynamics

Our researchers analyzed the data with 2025 as the base year, along with the key drivers, trends, and challenges. A holistic analysis of drivers will help companies refine their marketing strategies to gain a competitive advantage.

  • The implementation of Epedigree Software continuously transforms how pharmaceutical manufacturers handle compliance and product safety across extensive logistics networks. Advanced real time unit level tracing empowers warehouse managers to isolate compromised inventory instantly, improving recall efficiency by over 40% compared to traditional batch-tracking methods.
  • By adopting cloud based pharmaceutical compliance engines, organizations can bypass the massive infrastructure requirements of legacy systems and secure seamless data synchronization across multiple geographic jurisdictions. Automated suspect product investigation workflows actively filter through millions of daily transaction records, instantly flagging unreadable barcodes or aggregation mismatches without requiring manual human intervention.
  • Furthermore, the integration of robust digital supply chain verification frameworks ensures that wholesale distributors and retail pharmacies maintain uninterrupted operational trust, preventing costly quarantines at international borders. Modern enterprise grade electronic pedigree systems have evolved from basic administrative tools into strategic operational assets that optimize reverse logistics, limit expiration waste, and safeguard brand integrity against sophisticated gray market diversion operations.
  • This continuous evolution in software capabilities ensures that the entire healthcare distribution spectrum remains secure, agile, and fully aligned with evolving global security mandates.
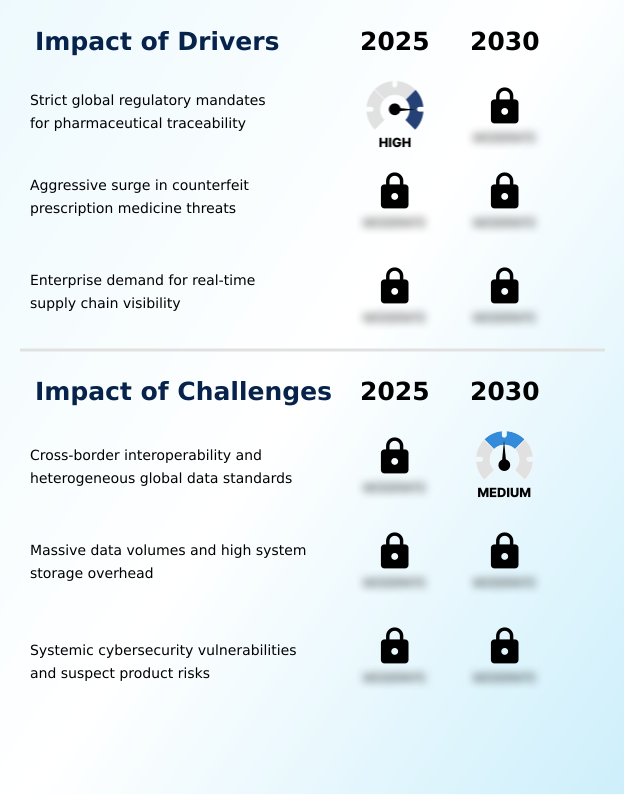
What are the key market drivers leading to the rise in the adoption of Epedigree Software Industry?

  • Strict global regulatory mandates for pharmaceutical traceability function as the primary catalyst expanding digital compliance requirements.

  • The escalating demand for Epedigree Software is heavily propelled by stringent international mandates enforcing drug supply chain security and patient safety.
  • Global regulatory frameworks, particularly the falsified medicines directive, compel healthcare networks to adopt comprehensive pharmaceutical traceability solutions to prevent counterfeit infiltration.
  • Compliance with these laws forces enterprise brand owners to integrate precise radio-frequency identification tags and digital tracking tools to establish unalterable audit trails. This comprehensive oversight enables organizations to execute dynamic inventory positioning, improving stockout prevention by 18%.
  • Expert regulatory compliance consulting ensures that multinational manufacturers seamlessly adapt their architectures to meet dynamic legislative deadlines, dramatically reducing the risk of severe operational penalties and protecting vital revenue streams across all logistics tiers.

What are the market trends shaping the Epedigree Software Industry?

  • The transition toward autonomous cloud serialization control towers represents a defining structural shift in the market.

  • A defining trend shaping the Epedigree Software sector is the rapid adoption of decentralized verification architectures to enhance data privacy and trust. Organizations are aggressively integrating blockchain traceability to secure sensitive commercial relationships across competing logistics networks. The deployment of distributed ledger technology ensures that every pharmaceutical ownership transfer is recorded on a tamper-proof digital ledger, preventing retroactive record manipulation.
  • This structural shift allows enterprises to share critical compliance data securely, improving cross-network verification speeds by 24%. Furthermore, the incorporation of agentic orchestration capabilities and advanced anomaly detection models automates complex resolution workflows without human oversight. This shift toward remote supply chain coordination dramatically reduces distribution bottlenecks, ensuring that massive volumes of critical therapeutics navigate international checkpoints efficiently and safely.

What challenges does the Epedigree Software Industry face during its growth?

  • Cross-border interoperability and heterogeneous global data standards create significant operational bottlenecks for international distribution networks.

  • The Epedigree Software sector encounters critical operational barriers due to the sheer complexity of maintaining cross-border interoperability among fragmented international trading partners. Synchronizing unique unit-level serialization data across distinct regional repositories creates immense data latency and translation challenges. The exponential generation of transactional records severely inflates system storage overhead, straining conventional enterprise quality management platforms.
  • When millions of daily scans overwhelm database indexing efficiency, organizations face a 15% increase in temporary line shutdowns. Establishing high-speed automated communication between disparate external nodes and internal systems remains a daunting technical hurdle. Without reliable automated exception handling, unresolved data mismatches trigger immediate product quarantines, forcing extensive manual investigations and disrupting the continuous flow of critical medical supplies.

Exclusive Technavio Analysis on Customer Landscape

The epedigree software market forecasting report includes the adoption lifecycle of the market, covering from the innovator’s stage to the laggard’s stage. It focuses on adoption rates in different regions based on penetration. Furthermore, the epedigree software market report also includes key purchase criteria and drivers of price sensitivity to help companies evaluate and develop their market growth analysis strategies.
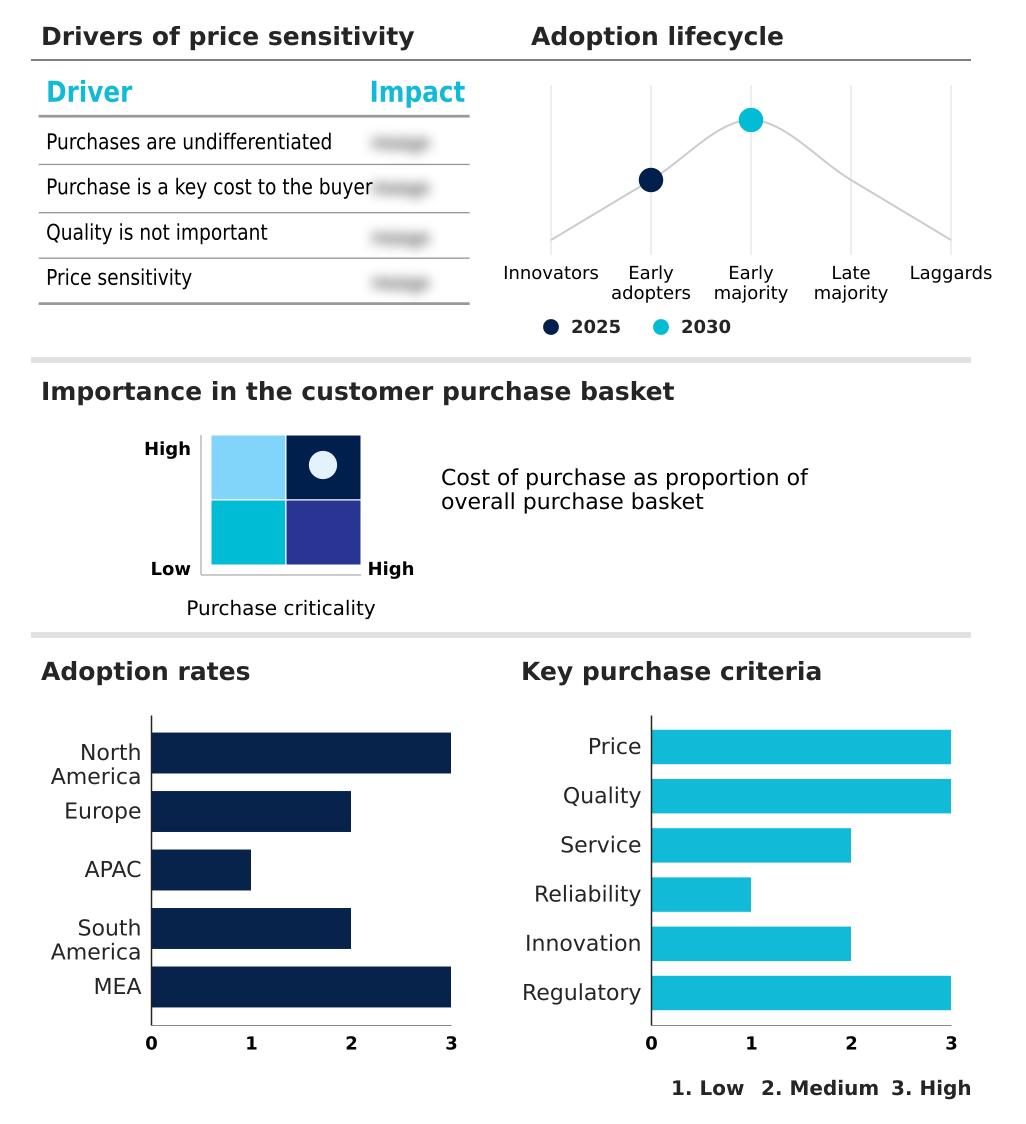
Customer Landscape of Epedigree Software Industry

Competitive Landscape

Companies are implementing various strategies, such as strategic alliances, epedigree software market forecast, partnerships, mergers and acquisitions, geographical expansion, and product/service launches, to enhance their presence in the industry.

Advanco S.A. - Provides advanced Epedigree Software optimizing pharmaceutical serialization and supply chain traceability to ensure complete regulatory compliance and seamless product authentication across diverse operational environments.

The industry research and growth report includes detailed analyses of the competitive landscape of the market and information about key companies, including:

  • Advanco S.A.
  • Arvato Systems GmbH
  • Blue Yonder Group Inc.
  • Covectra Inc.
  • IBM Corp.
  • Koerber AG
  • Labeling Systems LLC
  • Merit Solutions Inc.
  • Microsoft Corp.
  • Optel Group
  • Oracle Corp.
  • rfxcel Corp.
  • SAP SE
  • Siemens AG
  • Systech
  • TraceLink Inc.
  • WIPOTEC GmbH

Qualitative and quantitative analysis of companies has been conducted to help clients understand the wider business environment as well as the strengths and weaknesses of key industry players. Data is qualitatively analyzed to categorize companies as pure play, category-focused, industry-focused, and diversified; it is quantitatively analyzed to categorize companies as dominant, leading, strong, tentative, and weak.

Recent Development and News in Epedigree software market

  • In the Application Software industry, the rapid deployment of workflow interoperability protocols has standardized data exchange across disparate platforms, directly impacting Epedigree Software demand by reducing integration friction for global pharmaceutical manufacturers.
  • In the Application Software industry, the implementation of stringent data privacy regulations like GDPR has forced enterprises to adopt secure cloud-based delivery models, increasing the need for compliant Epedigree Software that protects sensitive proprietary commercial information.
  • In the Application Software industry, the systemic integration of enterprise automation and AI governance frameworks has accelerated real-time data processing capabilities, enabling Epedigree Software to achieve a 40% improvement in suspect product identification speed.
  • In the Application Software industry, widespread shifts toward edge computing architectures have enhanced local processing power at packaging lines, pulling demand for Epedigree Software that supports high-frequency scanning without central server latency.

Dive into Technavio’s robust research methodology, blending expert interviews, extensive data synthesis, and validated models for unparalleled Epedigree Software Market insights. See full methodology.

Market Scope
Page number 287
Base year 2025
Historic period 2020-2024
Forecast period 2026-2030
Growth momentum & CAGR Accelerate at a CAGR of 19.1%
Market growth 2026-2030 USD 5638.1 million
Market structure Fragmented
YoY growth 2025-2026(%) 17.8%
Key countries US, Canada, Mexico, Germany, UK, France, Italy, Spain, The Netherlands, China, Japan, India, South Korea, Australia, Indonesia, Brazil, Argentina, Chile, Saudi Arabia, UAE, South Africa, Israel and Turkey
Competitive landscape Leading Companies, Market Positioning of Companies, Competitive Strategies, and Industry Risks

Request Free Sample

Research Analyst Overview

  • The Epedigree Software environment represents a critical technological frontier shaped by the absolute necessity of supply chain transparency and regulatory alignment. Enterprise operators continuously upgrade their digital infrastructure to transition away from fragmented legacy databases toward unified verification networks. The systematic integration of artificial intelligence into exception management workflows directly influences boardroom strategies regarding risk mitigation and compliance budgeting.
  • For example, organizations deploying intelligent tracking architectures have achieved a 30% reduction in manual data processing time, significantly accelerating high-volume distribution operations. The shift toward cloud-based control towers ensures that multi-site manufacturing facilities maintain instantaneous synchronization with international trading partners. The continuous evolution of these platforms allows executives to optimize recall execution and protect brand reputation against sophisticated diversion tactics.
  • As international healthcare jurisdictions finalize their digital track-and-trace mandates, the reliance on high-performance serialization algorithms and secure repositories remains an uncompromising operational imperative for maintaining continuous commercial viability.

What are the Key Data Covered in this Epedigree Software Market Research and Growth Report?

  • What is the expected growth of the Epedigree Software Market between 2026 and 2030?

    • USD 5.64 billion, at a CAGR of 19.1%

  • What segmentation does the market report cover?

    • The report is segmented by Deployment (Cloud, and On-premises), End-user (Large enterprise, and Small and medium enterprises), Component (Software, and Services) and Geography (North America, Europe, APAC, South America, Middle East and Africa)

  • Which regions are analyzed in the report?

    • North America, Europe, APAC, South America and Middle East and Africa

  • What are the key growth drivers and market challenges?

    • Strict global regulatory mandates for pharmaceutical traceability, Cross-border interoperability and heterogeneous global data standards

  • Who are the major players in the Epedigree Software Market?

    • Advanco S.A., Arvato Systems GmbH, Blue Yonder Group Inc., Covectra Inc., IBM Corp., Koerber AG, Labeling Systems LLC, Merit Solutions Inc., Microsoft Corp., Optel Group, Oracle Corp., rfxcel Corp., SAP SE, Siemens AG, Systech, TraceLink Inc. and WIPOTEC GmbH

Market Research Insights

  • The Epedigree Software environment continuously adapts to sophisticated supply chain visibility demands and aggressive regulatory timelines. Companies integrate dynamic inventory positioning tools to maintain compliance while increasing distribution efficiency by 22%. The integration of regulatory compliance consulting ensures that complex deployments align perfectly with international track-and-trace mandates.
  • By leveraging advanced anomaly detection models, pharmaceutical enterprises achieve a 35% reduction in false counterfeit alerts. Organizations utilizing seamless remote supply chain coordination achieve unparalleled oversight across multinational trade routes. The systematic reduction of system storage overhead further enables smaller distributors to adopt powerful verification platforms, ensuring complete market participation without prohibitive infrastructure investments.

We can help! Our analysts can customize this epedigree software market research report to meet your requirements.

Get in touch

1. Executive Summary

1.1 Market overview

Executive Summary - Chart on Market Overview
Executive Summary - Data Table on Market Overview
Executive Summary - Chart on Global Market Characteristics
Executive Summary - Chart on Market by Geography
Executive Summary - Chart on Market Segmentation by Deployment
Executive Summary - Chart on Market Segmentation by End-user
Executive Summary - Chart on Market Segmentation by Component
Executive Summary - Chart on Incremental Growth
Executive Summary - Data Table on Incremental Growth
Executive Summary - Chart on Company Market Positioning

2. Technavio Analysis

2.1 Analysis of price sensitivity, lifecycle, customer purchase basket, adoption rates, and purchase criteria

2.2 Criticality of inputs and Factors of differentiation

Chart on Overview on criticality of inputs and factors of differentiation

2.3 Factors of disruption

Chart on Overview on factors of disruption

2.4 Impact of drivers and challenges

Chart on Impact of drivers and challenges in 2025 and 2030

3. Market Landscape

3.1 Market ecosystem

Chart on Parent Market
Data Table on - Parent Market

3.2 Market characteristics

Chart on Market characteristics analysis

3.3 Value chain analysis

Chart on Value chain analysis

4. Market Sizing

4.1 Market definition

Data Table on Offerings of companies included in the market definition

4.2 Market segment analysis

Market segments

4.3 Market size 2025

4.4 Market outlook: Forecast for 2025-2030

Chart on Global - Market size and forecast 2025-2030 ($ million)
Data Table on Global - Market size and forecast 2025-2030 ($ million)
Chart on Global Market: Year-over-year growth 2025-2030 (%)
Data Table on Global Market: Year-over-year growth 2025-2030 (%)

5. Historic Market Size

5.1 Global EPedigree Software Market 2020 - 2024

Historic Market Size - Data Table on Global EPedigree Software Market 2020 - 2024 ($ million)

5.2 Deployment segment analysis 2020 - 2024

Historic Market Size - Deployment Segment 2020 - 2024 ($ million)

5.3 End-user segment analysis 2020 - 2024

Historic Market Size - End-user Segment 2020 - 2024 ($ million)

5.4 Component segment analysis 2020 - 2024

Historic Market Size - Component Segment 2020 - 2024 ($ million)

5.5 Geography segment analysis 2020 - 2024

Historic Market Size - Geography Segment 2020 - 2024 ($ million)

5.6 Country segment analysis 2020 - 2024

Historic Market Size - Country Segment 2020 - 2024 ($ million)

6. Qualitative Analysis

6.1 Impact of AI on global ePedigree software market

6.2 Impact of geopolitical conflicts on global ePedigree software market

7. Five Forces Analysis

7.1 Five forces summary

Five forces analysis - Comparison between 2025 and 2030

7.2 Bargaining power of buyers

Bargaining power of buyers - Impact of key factors 2025 and 2030

7.3 Bargaining power of suppliers

Bargaining power of suppliers - Impact of key factors in 2025 and 2030

7.4 Threat of new entrants

Threat of new entrants - Impact of key factors in 2025 and 2030

7.5 Threat of substitutes

Threat of substitutes - Impact of key factors in 2025 and 2030

7.6 Threat of rivalry

Threat of rivalry - Impact of key factors in 2025 and 2030

7.7 Market condition

Chart on Market condition - Five forces 2025 and 2030

8. Market Segmentation by Deployment

8.1 Market segments

Chart on Deployment - Market share 2025-2030 (%)
Data Table on Deployment - Market share 2025-2030 (%)

8.2 Comparison by Deployment

Chart on Comparison by Deployment
Data Table on Comparison by Deployment

8.3 Cloud - Market size and forecast 2025-2030

Chart on Cloud - Market size and forecast 2025-2030 ($ million)
Data Table on Cloud - Market size and forecast 2025-2030 ($ million)
Chart on Cloud - Year-over-year growth 2025-2030 (%)
Data Table on Cloud - Year-over-year growth 2025-2030 (%)

8.4 On-premises - Market size and forecast 2025-2030

Chart on On-premises - Market size and forecast 2025-2030 ($ million)
Data Table on On-premises - Market size and forecast 2025-2030 ($ million)
Chart on On-premises - Year-over-year growth 2025-2030 (%)
Data Table on On-premises - Year-over-year growth 2025-2030 (%)

8.5 Market opportunity by Deployment

Market opportunity by Deployment ($ million)
Data Table on Market opportunity by Deployment ($ million)

9. Market Segmentation by End-user

9.1 Market segments

Chart on End-user - Market share 2025-2030 (%)
Data Table on End-user - Market share 2025-2030 (%)

9.2 Comparison by End-user

Chart on Comparison by End-user
Data Table on Comparison by End-user

9.3 Large enterprise - Market size and forecast 2025-2030

Chart on Large enterprise - Market size and forecast 2025-2030 ($ million)
Data Table on Large enterprise - Market size and forecast 2025-2030 ($ million)
Chart on Large enterprise - Year-over-year growth 2025-2030 (%)
Data Table on Large enterprise - Year-over-year growth 2025-2030 (%)

9.4 Small and medium enterprises - Market size and forecast 2025-2030

Chart on Small and medium enterprises - Market size and forecast 2025-2030 ($ million)
Data Table on Small and medium enterprises - Market size and forecast 2025-2030 ($ million)
Chart on Small and medium enterprises - Year-over-year growth 2025-2030 (%)
Data Table on Small and medium enterprises - Year-over-year growth 2025-2030 (%)

9.5 Market opportunity by End-user

Market opportunity by End-user ($ million)
Data Table on Market opportunity by End-user ($ million)

10. Market Segmentation by Component

10.1 Market segments

Chart on Component - Market share 2025-2030 (%)
Data Table on Component - Market share 2025-2030 (%)

10.2 Comparison by Component

Chart on Comparison by Component
Data Table on Comparison by Component

10.3 Software - Market size and forecast 2025-2030

Chart on Software - Market size and forecast 2025-2030 ($ million)
Data Table on Software - Market size and forecast 2025-2030 ($ million)
Chart on Software - Year-over-year growth 2025-2030 (%)
Data Table on Software - Year-over-year growth 2025-2030 (%)

10.4 Services - Market size and forecast 2025-2030

Chart on Services - Market size and forecast 2025-2030 ($ million)
Data Table on Services - Market size and forecast 2025-2030 ($ million)
Chart on Services - Year-over-year growth 2025-2030 (%)
Data Table on Services - Year-over-year growth 2025-2030 (%)

10.5 Market opportunity by Component

Market opportunity by Component ($ million)
Data Table on Market opportunity by Component ($ million)

11. Customer Landscape

11.1 Customer landscape overview

Analysis of price sensitivity, lifecycle, customer purchase basket, adoption rates, and purchase criteria

12. Geographic Landscape

12.1 Geographic segmentation

Chart on Market share by geography 2025-2030 (%)
Data Table on Market share by geography 2025-2030 (%)

12.2 Geographic comparison

Chart on Geographic comparison
Data Table on Geographic comparison

12.3 North America - Market size and forecast 2025-2030

Chart on North America - Market size and forecast 2025-2030 ($ million)
Data Table on North America - Market size and forecast 2025-2030 ($ million)
Chart on North America - Year-over-year growth 2025-2030 (%)
Data Table on North America - Year-over-year growth 2025-2030 (%)
Chart on Regional Comparison - North America
Data Table on Regional Comparison - North America

12.3.1 US - Market size and forecast 2025-2030

Chart on US - Market size and forecast 2025-2030 ($ million)
Data Table on US - Market size and forecast 2025-2030 ($ million)
Chart on US - Year-over-year growth 2025-2030 (%)
Data Table on US - Year-over-year growth 2025-2030 (%)

12.3.2 Canada - Market size and forecast 2025-2030

Chart on Canada - Market size and forecast 2025-2030 ($ million)
Data Table on Canada - Market size and forecast 2025-2030 ($ million)
Chart on Canada - Year-over-year growth 2025-2030 (%)
Data Table on Canada - Year-over-year growth 2025-2030 (%)

12.3.3 Mexico - Market size and forecast 2025-2030

Chart on Mexico - Market size and forecast 2025-2030 ($ million)
Data Table on Mexico - Market size and forecast 2025-2030 ($ million)
Chart on Mexico - Year-over-year growth 2025-2030 (%)
Data Table on Mexico - Year-over-year growth 2025-2030 (%)

12.4 Europe - Market size and forecast 2025-2030

Chart on Europe - Market size and forecast 2025-2030 ($ million)
Data Table on Europe - Market size and forecast 2025-2030 ($ million)
Chart on Europe - Year-over-year growth 2025-2030 (%)
Data Table on Europe - Year-over-year growth 2025-2030 (%)
Chart on Regional Comparison - Europe
Data Table on Regional Comparison - Europe

12.4.1 Germany - Market size and forecast 2025-2030

Chart on Germany - Market size and forecast 2025-2030 ($ million)
Data Table on Germany - Market size and forecast 2025-2030 ($ million)
Chart on Germany - Year-over-year growth 2025-2030 (%)
Data Table on Germany - Year-over-year growth 2025-2030 (%)

12.4.2 UK - Market size and forecast 2025-2030

Chart on UK - Market size and forecast 2025-2030 ($ million)
Data Table on UK - Market size and forecast 2025-2030 ($ million)
Chart on UK - Year-over-year growth 2025-2030 (%)
Data Table on UK - Year-over-year growth 2025-2030 (%)

12.4.3 France - Market size and forecast 2025-2030

Chart on France - Market size and forecast 2025-2030 ($ million)
Data Table on France - Market size and forecast 2025-2030 ($ million)
Chart on France - Year-over-year growth 2025-2030 (%)
Data Table on France - Year-over-year growth 2025-2030 (%)

12.4.4 Italy - Market size and forecast 2025-2030

Chart on Italy - Market size and forecast 2025-2030 ($ million)
Data Table on Italy - Market size and forecast 2025-2030 ($ million)
Chart on Italy - Year-over-year growth 2025-2030 (%)
Data Table on Italy - Year-over-year growth 2025-2030 (%)

12.4.5 Spain - Market size and forecast 2025-2030

Chart on Spain - Market size and forecast 2025-2030 ($ million)
Data Table on Spain - Market size and forecast 2025-2030 ($ million)
Chart on Spain - Year-over-year growth 2025-2030 (%)
Data Table on Spain - Year-over-year growth 2025-2030 (%)

12.4.6 The Netherlands - Market size and forecast 2025-2030

Chart on The Netherlands - Market size and forecast 2025-2030 ($ million)
Data Table on The Netherlands - Market size and forecast 2025-2030 ($ million)
Chart on The Netherlands - Year-over-year growth 2025-2030 (%)
Data Table on The Netherlands - Year-over-year growth 2025-2030 (%)

12.5 APAC - Market size and forecast 2025-2030

Chart on APAC - Market size and forecast 2025-2030 ($ million)
Data Table on APAC - Market size and forecast 2025-2030 ($ million)
Chart on APAC - Year-over-year growth 2025-2030 (%)
Data Table on APAC - Year-over-year growth 2025-2030 (%)
Chart on Regional Comparison - APAC
Data Table on Regional Comparison - APAC

12.5.1 China - Market size and forecast 2025-2030

Chart on China - Market size and forecast 2025-2030 ($ million)
Data Table on China - Market size and forecast 2025-2030 ($ million)
Chart on China - Year-over-year growth 2025-2030 (%)
Data Table on China - Year-over-year growth 2025-2030 (%)

12.5.2 Japan - Market size and forecast 2025-2030

Chart on Japan - Market size and forecast 2025-2030 ($ million)
Data Table on Japan - Market size and forecast 2025-2030 ($ million)
Chart on Japan - Year-over-year growth 2025-2030 (%)
Data Table on Japan - Year-over-year growth 2025-2030 (%)

12.5.3 India - Market size and forecast 2025-2030

Chart on India - Market size and forecast 2025-2030 ($ million)
Data Table on India - Market size and forecast 2025-2030 ($ million)
Chart on India - Year-over-year growth 2025-2030 (%)
Data Table on India - Year-over-year growth 2025-2030 (%)

12.5.4 South Korea - Market size and forecast 2025-2030

Chart on South Korea - Market size and forecast 2025-2030 ($ million)
Data Table on South Korea - Market size and forecast 2025-2030 ($ million)
Chart on South Korea - Year-over-year growth 2025-2030 (%)
Data Table on South Korea - Year-over-year growth 2025-2030 (%)

12.5.5 Australia - Market size and forecast 2025-2030

Chart on Australia - Market size and forecast 2025-2030 ($ million)
Data Table on Australia - Market size and forecast 2025-2030 ($ million)
Chart on Australia - Year-over-year growth 2025-2030 (%)
Data Table on Australia - Year-over-year growth 2025-2030 (%)

12.5.6 Indonesia - Market size and forecast 2025-2030

Chart on Indonesia - Market size and forecast 2025-2030 ($ million)
Data Table on Indonesia - Market size and forecast 2025-2030 ($ million)
Chart on Indonesia - Year-over-year growth 2025-2030 (%)
Data Table on Indonesia - Year-over-year growth 2025-2030 (%)

12.6 South America - Market size and forecast 2025-2030

Chart on South America - Market size and forecast 2025-2030 ($ million)
Data Table on South America - Market size and forecast 2025-2030 ($ million)
Chart on South America - Year-over-year growth 2025-2030 (%)
Data Table on South America - Year-over-year growth 2025-2030 (%)
Chart on Regional Comparison - South America
Data Table on Regional Comparison - South America

12.6.1 Brazil - Market size and forecast 2025-2030

Chart on Brazil - Market size and forecast 2025-2030 ($ million)
Data Table on Brazil - Market size and forecast 2025-2030 ($ million)
Chart on Brazil - Year-over-year growth 2025-2030 (%)
Data Table on Brazil - Year-over-year growth 2025-2030 (%)

12.6.2 Argentina - Market size and forecast 2025-2030

Chart on Argentina - Market size and forecast 2025-2030 ($ million)
Data Table on Argentina - Market size and forecast 2025-2030 ($ million)
Chart on Argentina - Year-over-year growth 2025-2030 (%)
Data Table on Argentina - Year-over-year growth 2025-2030 (%)

12.6.3 Chile - Market size and forecast 2025-2030

Chart on Chile - Market size and forecast 2025-2030 ($ million)
Data Table on Chile - Market size and forecast 2025-2030 ($ million)
Chart on Chile - Year-over-year growth 2025-2030 (%)
Data Table on Chile - Year-over-year growth 2025-2030 (%)

12.7 Middle East and Africa - Market size and forecast 2025-2030

Chart on Middle East and Africa - Market size and forecast 2025-2030 ($ million)
Data Table on Middle East and Africa - Market size and forecast 2025-2030 ($ million)
Chart on Middle East and Africa - Year-over-year growth 2025-2030 (%)
Data Table on Middle East and Africa - Year-over-year growth 2025-2030 (%)
Chart on Regional Comparison - Middle East and Africa
Data Table on Regional Comparison - Middle East and Africa

12.7.1 Saudi Arabia - Market size and forecast 2025-2030

Chart on Saudi Arabia - Market size and forecast 2025-2030 ($ million)
Data Table on Saudi Arabia - Market size and forecast 2025-2030 ($ million)
Chart on Saudi Arabia - Year-over-year growth 2025-2030 (%)
Data Table on Saudi Arabia - Year-over-year growth 2025-2030 (%)

12.7.2 UAE - Market size and forecast 2025-2030

Chart on UAE - Market size and forecast 2025-2030 ($ million)
Data Table on UAE - Market size and forecast 2025-2030 ($ million)
Chart on UAE - Year-over-year growth 2025-2030 (%)
Data Table on UAE - Year-over-year growth 2025-2030 (%)

12.7.3 South Africa - Market size and forecast 2025-2030

Chart on South Africa - Market size and forecast 2025-2030 ($ million)
Data Table on South Africa - Market size and forecast 2025-2030 ($ million)
Chart on South Africa - Year-over-year growth 2025-2030 (%)
Data Table on South Africa - Year-over-year growth 2025-2030 (%)

12.7.4 Israel - Market size and forecast 2025-2030

Chart on Israel - Market size and forecast 2025-2030 ($ million)
Data Table on Israel - Market size and forecast 2025-2030 ($ million)
Chart on Israel - Year-over-year growth 2025-2030 (%)
Data Table on Israel - Year-over-year growth 2025-2030 (%)

12.7.5 Turkey - Market size and forecast 2025-2030

Chart on Turkey - Market size and forecast 2025-2030 ($ million)
Data Table on Turkey - Market size and forecast 2025-2030 ($ million)
Chart on Turkey - Year-over-year growth 2025-2030 (%)
Data Table on Turkey - Year-over-year growth 2025-2030 (%)

12.8 Market opportunity by geography

Market opportunity by geography ($ million)
Data Tables on Market opportunity by geography ($ million)

13. Drivers, Challenges, and Opportunity

13.1 Market drivers

Strict global regulatory mandates for pharmaceutical traceability
Aggressive surge in counterfeit prescription medicine threats
Enterprise demand for real-time supply chain visibility

13.2 Market challenges

Cross-border interoperability and heterogeneous global data standards
Massive data volumes and high system storage overhead
Systemic cybersecurity vulnerabilities and suspect product risks

13.3 Impact of drivers and challenges

Impact of drivers and challenges in 2025 and 2030

13.4 Market opportunities

Transition toward autonomous cloud serialization control towers
Integration of AI for exception handling
Emergence of immutable distributed ledger traceability architectures

14. Competitive Landscape

14.1 Overview

14.2

Overview on criticality of inputs and factors of differentiation

14.3 Landscape disruption

Overview on factors of disruption

14.4 Industry risks

Impact of key risks on business

15. Competitive Analysis

15.1 Companies profiled

Companies covered

15.2 Company ranking index

15.3 Market positioning of companies

Matrix on companies position and classification

15.4 Advanco S.A.

Advanco S.A. - Overview
Advanco S.A. - Product / Service
Advanco S.A. - Key offerings
SWOT

15.5 Arvato Systems GmbH

Arvato Systems GmbH - Overview
Arvato Systems GmbH - Product / Service
Arvato Systems GmbH - Key offerings
SWOT

15.6 Blue Yonder Group Inc.

Blue Yonder Group Inc. - Overview
Blue Yonder Group Inc. - Product / Service
Blue Yonder Group Inc. - Key offerings
SWOT

15.7 Covectra Inc.

Covectra Inc. - Overview
Covectra Inc. - Product / Service
Covectra Inc. - Key offerings
SWOT

15.8 IBM Corp.

IBM Corp. - Overview
IBM Corp. - Business segments
IBM Corp. - Key news
IBM Corp. - Key offerings
IBM Corp. - Segment focus
SWOT

15.9 Koerber AG

Koerber AG - Overview
Koerber AG - Product / Service
Koerber AG - Key offerings
SWOT

15.10 Merit Solutions Inc.

Merit Solutions Inc. - Overview
Merit Solutions Inc. - Product / Service
Merit Solutions Inc. - Key offerings
SWOT

15.11 Microsoft Corp.

Microsoft Corp. - Overview
Microsoft Corp. - Business segments
Microsoft Corp. - Key news
Microsoft Corp. - Key offerings
Microsoft Corp. - Segment focus
SWOT

15.12 Optel Group

Optel Group - Overview
Optel Group - Product / Service
Optel Group - Key offerings
SWOT

15.13 Oracle Corp.

Oracle Corp. - Overview
Oracle Corp. - Business segments
Oracle Corp. - Key news
Oracle Corp. - Key offerings
Oracle Corp. - Segment focus
SWOT

15.14 rfxcel Corp.

rfxcel Corp. - Overview
rfxcel Corp. - Product / Service
rfxcel Corp. - Key offerings
SWOT

15.15 SAP SE

SAP SE - Overview
SAP SE - Business segments
SAP SE - Key news
SAP SE - Key offerings
SAP SE - Segment focus
SWOT

15.16 Siemens AG

Siemens AG - Overview
Siemens AG - Business segments
Siemens AG - Key news
Siemens AG - Key offerings
Siemens AG - Segment focus
SWOT

15.17 TraceLink Inc.

TraceLink Inc. - Overview
TraceLink Inc. - Product / Service
TraceLink Inc. - Key offerings
SWOT

15.18 WIPOTEC GmbH

WIPOTEC GmbH - Overview
WIPOTEC GmbH - Product / Service
WIPOTEC GmbH - Key offerings
SWOT

16. Appendix

16.1 Scope of the report

Market definition
Objectives
Notes and caveats

16.2 Inclusions and exclusions checklist

Inclusions checklist
Exclusions checklist

16.3 Currency conversion rates for US$

16.4 Research methodology

16.5 Data procurement

Information sources

16.6 Data validation

16.7 Validation techniques employed for market sizing

16.8 Data synthesis

16.9 360 degree market analysis

16.10 List of abbreviations

Research Methodology

Technavio presents a detailed picture of the market by way of study, synthesis, and summation of data from multiple sources. The analysts have presented the various facets of the market with a particular focus on identifying the key industry influencers. The data thus presented is comprehensive, reliable, and the result of extensive research, both primary and secondary.

INFORMATION SOURCES

Primary sources

  • Manufacturers and suppliers
  • Channel partners
  • Industry experts
  • Strategic decision makers

Secondary sources

  • Industry journals and periodicals
  • Government data
  • Financial reports of key industry players
  • Historical data
  • Press releases

DATA ANALYSIS

Data Synthesis

  • Collation of data
  • Estimation of key figures
  • Analysis of derived insights

Data Validation

  • Triangulation with data models
  • Reference against proprietary databases
  • Corroboration with industry experts

REPORT WRITING

Qualitative

  • Market drivers
  • Market challenges
  • Market trends
  • Five forces analysis

Quantitative

  • Market size and forecast
  • Market segmentation
  • Geographical insights
  • Competitive landscape

Interested in this report?

Get your sample now to see our research methodology and insights!

Download Now

Frequently Asked Questions

Epedigree Software market growth will increase by USD 5638.1 million during 2026-2030.

The Epedigree Software market is expected to grow at a CAGR of 19.1% during 2026-2030.

Epedigree Software market is segmented by Deployment (Cloud, On-premises) End-user (Large enterprise, Small and medium enterprises) Component (Software, Services)

Advanco S.A., Arvato Systems GmbH, Blue Yonder Group Inc., Covectra Inc., IBM Corp., Koerber AG, Labeling Systems LLC, Merit Solutions Inc., Microsoft Corp., Optel Group, Oracle Corp., rfxcel Corp., SAP SE, Siemens AG, Systech, TraceLink Inc., WIPOTEC GmbH are a few of the key vendors in the Epedigree Software market.

Europe will register the highest growth rate of 35.7% among the other regions. Therefore, the Epedigree Software market in Europe is expected to garner significant business opportunities for the vendors during the forecast period.

US, Canada, Mexico, Germany, UK, France, Italy, Spain, The Netherlands, China, Japan, India, South Korea, Australia, Indonesia, Brazil, Argentina, Chile, Saudi Arabia, UAE, South Africa, Israel, Turkey

  • Strict global regulatory mandates for pharmaceutical traceability is the driving factor this market.

The Epedigree Software market vendors should focus on grabbing business opportunities from the Deployment segment as it accounted for the largest market share in the base year.
RIA - Research AI Assistant
Ask RIA
