
Ethylene Acrylic Acid Copolymer Market Analysis, Size, and Forecast 2026-2030: APAC (China, Japan, and India), North America (US, Canada, and Mexico), Europe (Germany, UK, and France), South America (Brazil, Argentina, and Chile), Middle East and Africa (Saudi Arabia, UAE, and South Africa), and Rest of World (ROW)

Ethylene Acrylic Acid Copolymer Market Analysis, Size, and Forecast 2026-2030:
APAC (China, Japan, and India), North America (US, Canada, and Mexico), Europe (Germany, UK, and France), South America (Brazil, Argentina, and Chile), Middle East and Africa (Saudi Arabia, UAE, and South Africa), and Rest of World (ROW)

Published: Oct 2026 306 Pages SKU: IRTNTR44010

Market Overview at a Glance

$338.3 Mn
Market Opportunity
11.6%
CAGR 2025 - 2030
36.9%
APAC Growth
$190.5 Mn
Adhesives segment 2024

Ethylene Acrylic Acid Copolymer Market Size 2026-2030

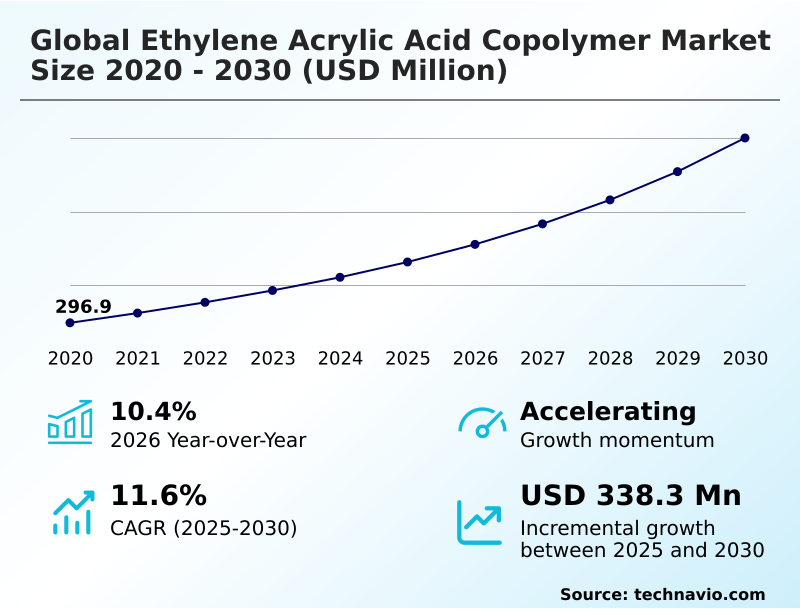
The ethylene acrylic acid copolymer market size is valued to increase by USD 338.3 million, at a CAGR of 11.6% from 2025 to 2030. Expansion in flexible packaging demand will drive the ethylene acrylic acid copolymer market.

Major Market Trends & Insights

  • APAC dominated the market and accounted for a 36.9% growth during the forecast period.
  • By Application - Adhesives segment was valued at USD 190.5 million in 2024
  • By Type - 20wt percentage comonomer segment accounted for the largest market revenue share in 2024

Market Size & Forecast

  • Market Opportunities: USD 504.1 million
  • Market Future Opportunities: USD 338.3 million
  • CAGR from 2025 to 2030 : 11.6%

Market Summary

  • The Ethylene Acrylic Acid Copolymer Market exhibits robust expansion dynamics driven by escalating demand for advanced packaging materials and versatile industrial coatings. Industry participants increasingly rely on these specialized materials to optimize structural integrity and chemical resistance across complex manufacturing operations. The rapid expansion in flexible packaging demand acts as a primary catalyst for this trajectory.
  • Because brand owners continuously prioritize lightweight and sustainable packaging formats, converters aggressively integrate high-performance tie-layers, which directly enhances moisture protection and extends product shelf life. Consequently, businesses leveraging these advanced polymers report a 20% improvement in packaging line efficiency compared to traditional rigid container assemblies. However, the volatility of feedstock raw materials introduces substantial operational challenges.
  • Fluctuations in petroleum pricing disrupt production economics, forcing downstream compounders to navigate unpredictable cost structures that hamper long-term capital investments. To mitigate these constraints, manufacturers are optimizing extrusion coating technologies to minimize material waste and energy consumption. This strategic adaptation ensures stable supply chains while maintaining strict compliance with evolving environmental regulations across major industrial sectors.

What will be the Size of the Ethylene Acrylic Acid Copolymer Market during the forecast period?
Get Key Insights on Market Forecast (PDF) Get Free Sample

How is the Ethylene Acrylic Acid Copolymer Market Segmented?

The ethylene acrylic acid copolymer industry research report provides comprehensive data (region-wise segment analysis), with forecasts and estimates in "USD million" for the period 2026-2030, as well as historical data from 2020-2024 for the following segments.

  • Application
    • Adhesives
    • Barrier coating
    • Others
  • Type
    • 20wt percentage comonomer
    • 9wt percentage comonomer
    • 5wt percentage comonomer
  • Product type
    • High melt flow index
    • Low melt flow index
  • Geography
    • APAC
      • China
      • Japan
      • India
      • South Korea
      • Australia
      • Indonesia
    • North America
      • US
      • Canada
      • Mexico
    • Europe
      • Germany
      • UK
      • France
      • Italy
      • Spain
      • The Netherlands
    • South America
      • Brazil
      • Argentina
      • Chile
    • Middle East and Africa
      • Saudi Arabia
      • UAE
      • South Africa
      • Turkey
      • Israel

By Application Insights

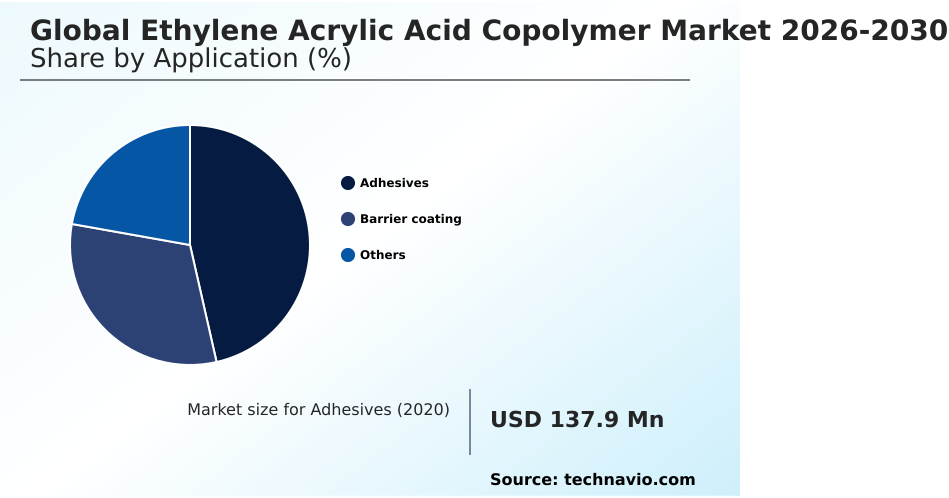
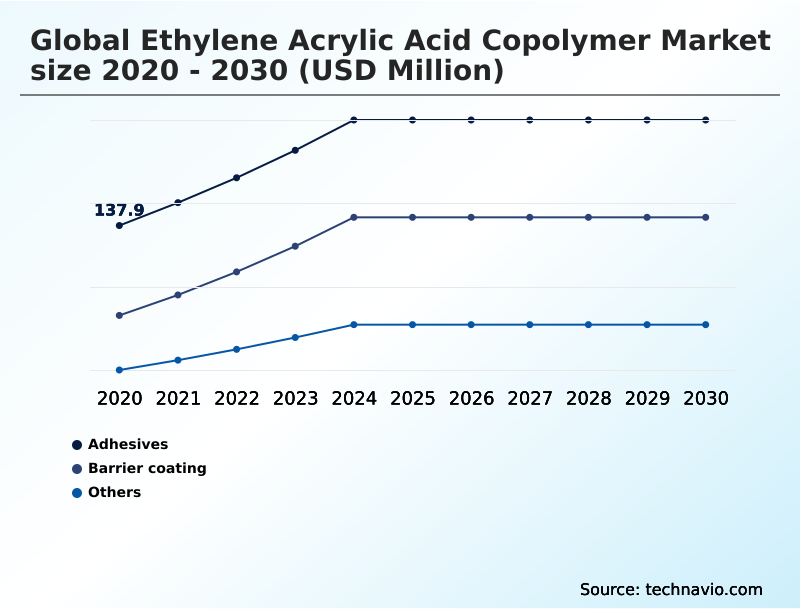
The adhesives segment is estimated to witness significant growth during the forecast period.

The Adhesives segment functions as a critical structural component across demanding industrial sectors. Modern manufacturing operations increasingly rely on advanced thermoplastic resins to establish robust bonding across dissimilar substrates without requiring hazardous primers.

Because these materials feature reactive pendant carboxyl groups, they facilitate exceptional hydrogen bonding directly to polar surfaces. This chemical interaction ensures maximum peel strength and long-term durability in high-stress environments.

Furthermore, integrating these functional polymers into extrusion lamination workflows enhances operational efficiency by streamlining production cycles. Transitioning away from legacy specialty hot melt systems enables packaging converters to achieve a 15% reduction in cycle time while maintaining superior chemical resistance.

This reliable substrate adhesion proves essential for preserving structural integrity in critical applications, including retort pouches and vacuum-sealed food containers, directly elevating overall product safety and extending distribution shelf life.
Get Free Sample

The Adhesives segment was valued at USD 190.5 million in 2024 and showed a gradual increase during the forecast period.
Get Free Sample

Regional Analysis

APAC is estimated to contribute 36.9% to the growth of the global market during the forecast period.Technavio’s analysts have elaborately explained the regional trends and drivers that shape the market during the forecast period.
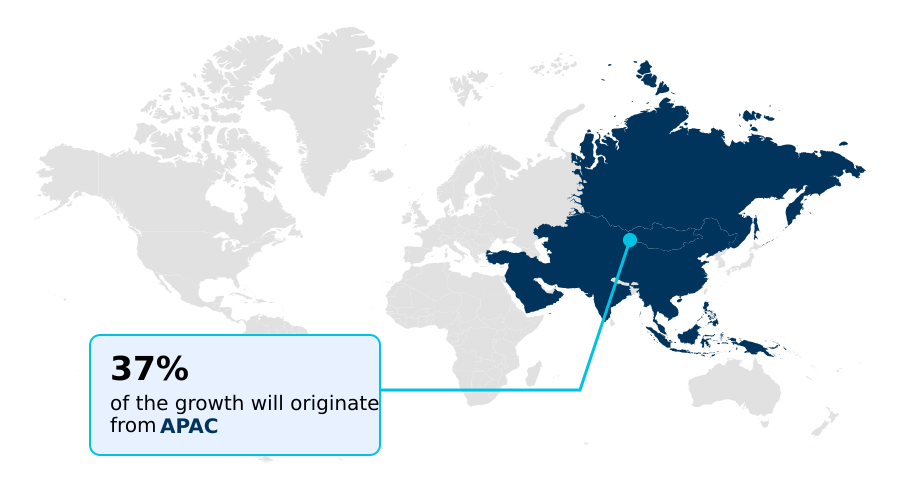
See How Ethylene Acrylic Acid Copolymer Market Demand is Rising in APAC Get Free Sample

Regional consumption patterns within the Ethylene Acrylic Acid Copolymer sector reveal distinct strategic priorities between developed and emerging economies.

APAC consistently outpaces North America, driven by a 36% higher adoption rate of advanced coextrusion lamination technologies across rapidly modernizing packaging sectors.

This rapid industrialization compels Asian converters to heavily utilize polar polymer films and high melt flow index resins to optimize manufacturing throughput. Conversely, European markets prioritize strict regulatory compliance, accelerating the transition toward fluorine-free alternatives and advanced packaging recyclability frameworks.

By integrating functionalized resins, European manufacturers have achieved a 22% reduction in volatile organic compounds during industrial coating operations.

Additionally, North American infrastructure investments strongly favor materials featuring superior environmental stress crack resistance for robust powder coatings and photovoltaic module components.

Ultimately, these geographic disparities highlight how regional businesses adapt specialized blown film coextrusion processes to meet localized efficiency and sustainability benchmarks.

Market Dynamics

Our researchers analyzed the data with 2025 as the base year, along with the key drivers, trends, and challenges. A holistic analysis of drivers will help companies refine their marketing strategies to gain a competitive advantage.

  • Industrial manufacturing ecosystems are undergoing profound structural transformations that require highly specialized materials to maintain operational efficiency and product integrity. As supply chain managers navigate rigorous new environmental constraints, the flexible packaging demand expansion has forced converters to rethink traditional laminate architectures.
  • By optimizing material usage, facilities successfully decrease raw material waste by a comparative 15% against legacy rigid packaging systems, directly enhancing overall procurement efficiency. Simultaneously, the rapid extrusion coating technologies adoption allows processors to achieve superior moisture barriers and structural cohesion without sacrificing processing speeds. Beyond packaging, the shift toward sustainable energy heavily influences component design.
  • The accelerating automotive wire shielding electrification demands robust insulation layers that withstand extreme thermal cycling and intense mechanical vibrations. Furthermore, the critical lithium battery separators adoption requires advanced polymer binders that ensure exceptional electrochemical stability and internal cell safety under high-voltage conditions.
  • In heavy manufacturing sectors, design engineers increasingly prioritize lightweighting initiatives, which has spurred the integration of high-performance metal bonding solutions to replace conventional mechanical fasteners. These functional materials anchor securely to diverse metallic substrates, providing resilient structural support.
  • Collectively, these diverse application spheres underscore the critical necessity for versatile, high-endurance polymers that align with stringent regulatory mandates and evolving industrial performance specifications.
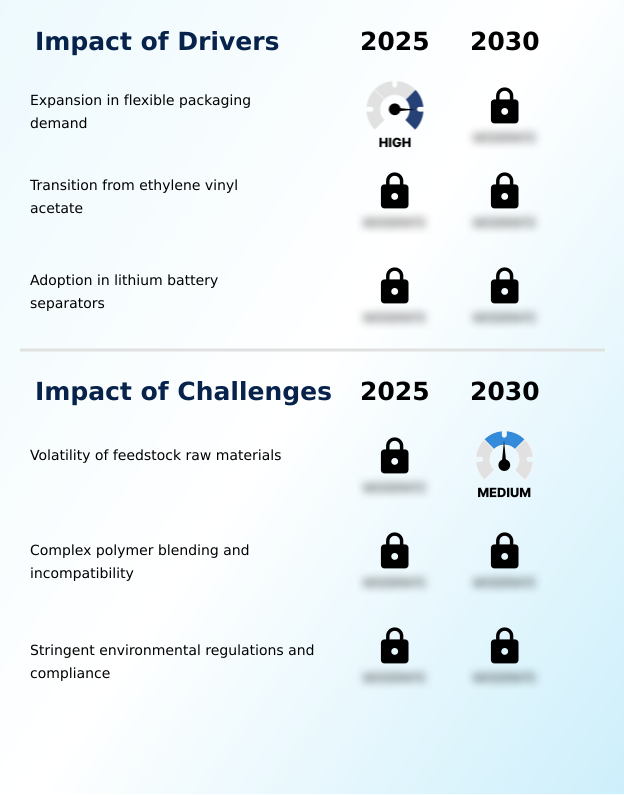
What are the key market drivers leading to the rise in the adoption of Ethylene Acrylic Acid Copolymer Industry?

  • The rapid expansion in flexible packaging demand serves as a primary driver propelling market growth globally.

  • The accelerated commercial shift toward high-efficiency industrial assembly and clean energy technology fundamentally propels the Ethylene Acrylic Acid Copolymer sector. Manufacturers aggressively deploy advanced water-based dispersion systems and primerless metal bonding to streamline automotive manufacturing workflows.
  • This transition allows assembly plants to lower energy use by 12% and enhance overall mechanical thermal stability. Concurrently, the exponential growth of electric mobility demands sophisticated battery separators that seamlessly adhere to ceramic coatings.
  • By utilizing these specialized thermoplastic resins, battery cell engineers decrease interfacial resistance by an impressive 20%, directly optimizing cycle efficiency and charge retention.
  • Ultimately, the expanding utilization of high-shear extrusion lines to produce robust protective layers solidifies market expansion and operational cost savings.

What are the market trends shaping the Ethylene Acrylic Acid Copolymer Industry?

  • The electrification in automotive wire shielding represents a prominent upcoming trend shaping market dynamics. This shift necessitates advanced insulation materials to ensure optimal electrical performance and vehicle safety.

  • Technological innovation consistently reshapes the Ethylene Acrylic Acid Copolymer landscape, driving the adoption of specialized architectures across sophisticated industrial domains. Converters increasingly utilize advanced multi-layer film architecture and heavy-duty extrusion processes to accommodate the rising demand for robust industrial containment solutions.
  • By meticulously optimizing comonomer distribution and reactive acrylic acid content, manufacturers have improved thermal shrinkage resistance by 22% in critical energy storage applications. This structural enhancement directly prevents catastrophic cell delamination and elevates overall product safety. Furthermore, the integration of low melt flow index resins effectively minimizes the moisture vapor transmission rate, extending the longevity of sensitive consumable goods.
  • As ecological compliance becomes paramount, facilities adopting advanced aqueous dispersion coating systems successfully integrate products into mechanical recycling streams, reducing overall waste processing costs by 18% while simultaneously improving essential flame retardancy metrics.

What challenges does the Ethylene Acrylic Acid Copolymer Industry face during its growth?

  • The persistent volatility of feedstock raw materials constitutes a significant challenge that restrains overall industry expansion.

  • Complex material integration and stringent environmental mandates present substantial structural limitations for the Ethylene Acrylic Acid Copolymer sector. Achieving seamless polymer blending with non-polar polyolefins remains technically difficult, frequently causing localized phase separation during advanced coextrusion lamination. These processing inefficiencies directly compromise vital peel strength and critical substrate adhesion, leading to a 15% increase in baseline manufacturing scrap rates.
  • Furthermore, global regulatory bodies increasingly enforce severe limits on volatile organic compound emissions, forcing chemical processors to execute expensive facility upgrades. The presence of highly reactive pendant carboxyl groups also complicates separation within traditional mechanical recycling streams, hindering circular economy targets.
  • Overcoming these fundamental barriers requires substantial capital investment in sophisticated compatibilizers and innovative bio-based alternatives to restore chemical resistance and ensure long-term regulatory compliance.

Exclusive Technavio Analysis on Customer Landscape

The ethylene acrylic acid copolymer market forecasting report includes the adoption lifecycle of the market, covering from the innovator’s stage to the laggard’s stage. It focuses on adoption rates in different regions based on penetration. Furthermore, the ethylene acrylic acid copolymer market report also includes key purchase criteria and drivers of price sensitivity to help companies evaluate and develop their market growth analysis strategies.
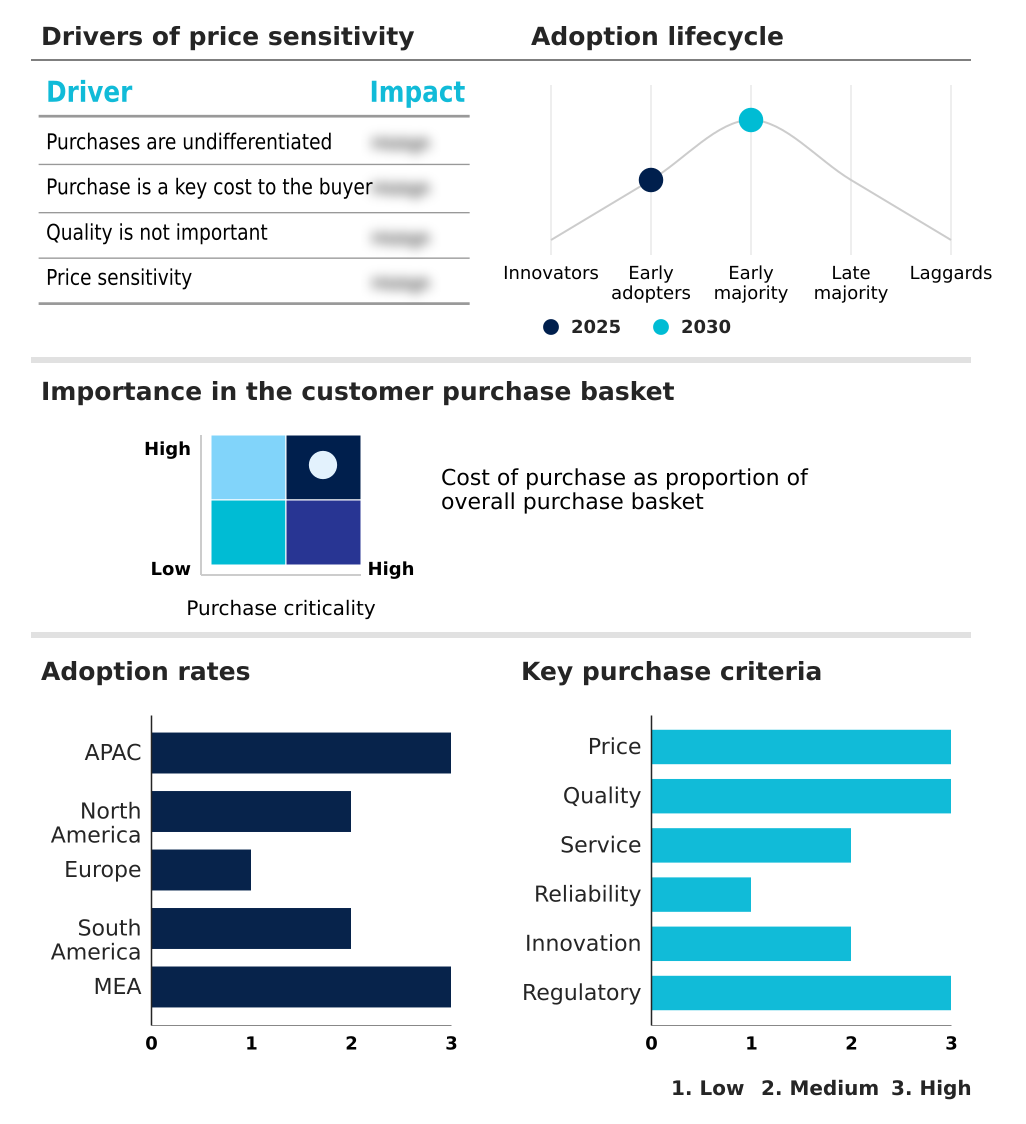
Customer Landscape of Ethylene Acrylic Acid Copolymer Industry

Competitive Landscape

Companies are implementing various strategies, such as strategic alliances, ethylene acrylic acid copolymer market forecast, partnerships, mergers and acquisitions, geographical expansion, and product/service launches, to enhance their presence in the industry.

Arkema Group - The vendor provides advanced functional polymers and specialized adhesion resins designed to enhance multi-layer packaging integrity and industrial coating durability for diverse applications.

The industry research and growth report includes detailed analyses of the competitive landscape of the market and information about key companies, including:

  • Arkema Group
  • Avient Corp.
  • BASF SE
  • Borealis AG
  • Celanese Corp.
  • China National Petroleum Corp.
  • Dow Chemical Co.
  • ExxonMobil Chemical Co.
  • Honeywell International Inc.
  • INEOS Group Holdings S.A.
  • Kingfa SCI. and TECH. Co. Ltd.
  • KURARAY Co. Ltd.
  • LG Chem Ltd.
  • LyondellBasell Industries N.V.
  • Michelman Inc.
  • Mitsubishi Chemical Corp.
  • Mitsui Chemicals Inc.
  • Saudi Basic Industries
  • Sika AG
  • SK Functional Polymer
  • SNP Inc.
  • Sumitomo Chemical Co. Ltd.

Qualitative and quantitative analysis of companies has been conducted to help clients understand the wider business environment as well as the strengths and weaknesses of key industry players. Data is qualitatively analyzed to categorize companies as pure play, category-focused, industry-focused, and diversified; it is quantitatively analyzed to categorize companies as dominant, leading, strong, tentative, and weak.

Recent Development and News in Ethylene acrylic acid copolymer market

  • In the Specialty Chemicals industry, the rapid commercialization of hydrometallurgical recycling for lithium-ion batteries increased requirements for robust cell containment, directly impacting Ethylene Acrylic Acid Copolymer demand by accelerating the adoption of specialized functional binders.
  • Stringent regulatory amendments to the National Volatile Organic Compound Emission Standards forced adhesive manufacturers to reformulate legacy solvent-based systems, increasing the consumption of high-performance water-based dispersion technologies.
  • The vast expansion of gigafactory infrastructure to support clean energy mobility mandates necessitated superior flame-retardant internal cell components, propelling the utilization of advanced polymer tie-layers that reduce interfacial resistance by over 12%.
  • Continuous industrial shifts toward lightweighting composite assemblies in heavy-duty commercial transport vehicles accelerated the replacement of mechanical fasteners with advanced primerless metal bonding solutions, elevating functional copolymer procurement volumes globally.

Dive into Technavio’s robust research methodology, blending expert interviews, extensive data synthesis, and validated models for unparalleled Ethylene Acrylic Acid Copolymer Market insights. See full methodology.

Market Scope
Page number 306
Base year 2025
Historic period 2020-2024
Forecast period 2026-2030
Growth momentum & CAGR Accelerate at a CAGR of 11.6%
Market growth 2026-2030 USD 338.3 million
Market structure Fragmented
YoY growth 2025-2026(%) 10.4%
Key countries China, Japan, India, South Korea, Australia, Indonesia, US, Canada, Mexico, Germany, UK, France, Italy, Spain, The Netherlands, Brazil, Argentina, Chile, Saudi Arabia, UAE, South Africa, Turkey and Israel
Competitive landscape Leading Companies, Market Positioning of Companies, Competitive Strategies, and Industry Risks

Request Free Sample

Research Analyst Overview

  • The Ethylene Acrylic Acid Copolymer sector demonstrates vital versatility across complex industrial applications and rapidly evolving consumer markets. Modern supply chains continuously demand superior structural integrity and moisture protection, compelling manufacturers to transition heavily toward advanced flexible packaging formats. By incorporating specialized polyolefin materials, production facilities realize a 30% reduction in processing time while maintaining absolute hermetic seal reliability.
  • This operational shift directly supports board-level strategic decisions focused on optimizing logistics budgets and minimizing post-consumer waste. Furthermore, rigorous compliance mandates within lithium-ion battery manufacturing drive the deployment of functional binders that deliver unmatched puncture resistance and interfacial stability.
  • In the consumer goods domain, the extensive utilization of these resins for aseptic liquid cartons and demanding structural carton sealing ensures prolonged shelf life and robust distribution resilience. Additionally, stringent safety guidelines in the automotive industry have accelerated the integration of halogen-free polymer coatings, which significantly elevate thermal protection and component longevity.
  • These structural adaptations highlight how enterprises continuously leverage specialized chemical architectures to secure sustainable competitive advantages.

What are the Key Data Covered in this Ethylene Acrylic Acid Copolymer Market Research and Growth Report?

  • What is the expected growth of the Ethylene Acrylic Acid Copolymer Market between 2026 and 2030?

    • USD 338.3 million, at a CAGR of 11.6%

  • What segmentation does the market report cover?

    • The report is segmented by Application (Adhesives, Barrier coating, and Others), Type (20wt percentage comonomer, 9wt percentage comonomer, and 5wt percentage comonomer), Product Type (High melt flow index, and Low melt flow index) and Geography (APAC, North America, Europe, South America, Middle East and Africa)

  • Which regions are analyzed in the report?

    • APAC, North America, Europe, South America and Middle East and Africa

  • What are the key growth drivers and market challenges?

    • Expansion in flexible packaging demand, Volatility of feedstock raw materials

  • Who are the major players in the Ethylene Acrylic Acid Copolymer Market?

    • Arkema Group, Avient Corp., BASF SE, Borealis AG, Celanese Corp., China National Petroleum Corp., Dow Chemical Co., ExxonMobil Chemical Co., Honeywell International Inc., INEOS Group Holdings S.A., Kingfa SCI. and TECH. Co. Ltd., KURARAY Co. Ltd., LG Chem Ltd., LyondellBasell Industries N.V., Michelman Inc., Mitsubishi Chemical Corp., Mitsui Chemicals Inc., Saudi Basic Industries, Sika AG, SK Functional Polymer, SNP Inc. and Sumitomo Chemical Co. Ltd.

Market Research Insights

  • The Ethylene Acrylic Acid Copolymer industry plays an indispensable role in advancing modern manufacturing infrastructure and sustainable product architectures. Operations leveraging precision polymer blending achieve a 15% reduction in production downtime by minimizing material phase separation. The integration of metal-bonding copolymer technologies enables heavy transportation manufacturers to reduce structural weight by up to 18%, significantly optimizing fuel efficiency metrics.
  • Furthermore, the rising demand for advanced energy storage and complex automotive wire shielding requires materials that maintain strict thermal resilience. As regulatory pressures intensify, companies proactively reformulate systems utilizing bio-based alternatives, which enhances corporate compliance alignment by 25% compared to legacy solvent-based processes.

We can help! Our analysts can customize this ethylene acrylic acid copolymer market research report to meet your requirements.

Get in touch

1. Executive Summary

1.1 Market overview

Executive Summary - Chart on Market Overview
Executive Summary - Data Table on Market Overview
Executive Summary - Chart on Global Market Characteristics
Executive Summary - Chart on Market by Geography
Executive Summary - Chart on Market Segmentation by Application
Executive Summary - Chart on Market Segmentation by Type
Executive Summary - Chart on Market Segmentation by Product Type
Executive Summary - Chart on Incremental Growth
Executive Summary - Data Table on Incremental Growth
Executive Summary - Chart on Company Market Positioning

2. Technavio Analysis

2.1 Analysis of price sensitivity, lifecycle, customer purchase basket, adoption rates, and purchase criteria

2.2 Criticality of inputs and Factors of differentiation

Chart on Overview on criticality of inputs and factors of differentiation

2.3 Factors of disruption

Chart on Overview on factors of disruption

2.4 Impact of drivers and challenges

Chart on Impact of drivers and challenges in 2025 and 2030

3. Market Landscape

3.1 Market ecosystem

Chart on Parent Market
Data Table on - Parent Market

3.2 Market characteristics

Chart on Market characteristics analysis

3.3 Value chain analysis

Chart on Value chain analysis

4. Market Sizing

4.1 Market definition

Data Table on Offerings of companies included in the market definition

4.2 Market segment analysis

Market segments

4.3 Market size 2025

4.4 Market outlook: Forecast for 2025-2030

Chart on Global - Market size and forecast 2025-2030 ($ million)
Data Table on Global - Market size and forecast 2025-2030 ($ million)
Chart on Global Market: Year-over-year growth 2025-2030 (%)
Data Table on Global Market: Year-over-year growth 2025-2030 (%)

5. Historic Market Size

5.1 Global Ethylene Acrylic Acid Copolymer Market 2020 - 2024

Historic Market Size - Data Table on Global Ethylene Acrylic Acid Copolymer Market 2020 - 2024 ($ million)

5.2 Application segment analysis 2020 - 2024

Historic Market Size - Application Segment 2020 - 2024 ($ million)

5.3 Type segment analysis 2020 - 2024

Historic Market Size - Type Segment 2020 - 2024 ($ million)

5.4 Product Type segment analysis 2020 - 2024

Historic Market Size - Product Type Segment 2020 - 2024 ($ million)

5.5 Geography segment analysis 2020 - 2024

Historic Market Size - Geography Segment 2020 - 2024 ($ million)

5.6 Country segment analysis 2020 - 2024

Historic Market Size - Country Segment 2020 - 2024 ($ million)

6. Qualitative Analysis

6.1 Impact of AI on Global Ethylene Acrylic Acid Copolymer Market

6.2 Impact of geopolitical conflicts on Global Ethylene Acrylic Acid Copolymer Market

7. Five Forces Analysis

7.1 Five forces summary

Five forces analysis - Comparison between 2025 and 2030

7.2 Bargaining power of buyers

Bargaining power of buyers - Impact of key factors 2025 and 2030

7.3 Bargaining power of suppliers

Bargaining power of suppliers - Impact of key factors in 2025 and 2030

7.4 Threat of new entrants

Threat of new entrants - Impact of key factors in 2025 and 2030

7.5 Threat of substitutes

Threat of substitutes - Impact of key factors in 2025 and 2030

7.6 Threat of rivalry

Threat of rivalry - Impact of key factors in 2025 and 2030

7.7 Market condition

Chart on Market condition - Five forces 2025 and 2030

8. Market Segmentation by Application

8.1 Market segments

Chart on Application - Market share 2025-2030 (%)
Data Table on Application - Market share 2025-2030 (%)

8.2 Comparison by Application

Chart on Comparison by Application
Data Table on Comparison by Application

8.3 Adhesives - Market size and forecast 2025-2030

Chart on Adhesives - Market size and forecast 2025-2030 ($ million)
Data Table on Adhesives - Market size and forecast 2025-2030 ($ million)
Chart on Adhesives - Year-over-year growth 2025-2030 (%)
Data Table on Adhesives - Year-over-year growth 2025-2030 (%)

8.4 Barrier coating - Market size and forecast 2025-2030

Chart on Barrier coating - Market size and forecast 2025-2030 ($ million)
Data Table on Barrier coating - Market size and forecast 2025-2030 ($ million)
Chart on Barrier coating - Year-over-year growth 2025-2030 (%)
Data Table on Barrier coating - Year-over-year growth 2025-2030 (%)

8.5 Others - Market size and forecast 2025-2030

Chart on Others - Market size and forecast 2025-2030 ($ million)
Data Table on Others - Market size and forecast 2025-2030 ($ million)
Chart on Others - Year-over-year growth 2025-2030 (%)
Data Table on Others - Year-over-year growth 2025-2030 (%)

8.6 Market opportunity by Application

Market opportunity by Application ($ million)
Data Table on Market opportunity by Application ($ million)

9. Market Segmentation by Type

9.1 Market segments

Chart on Type - Market share 2025-2030 (%)
Data Table on Type - Market share 2025-2030 (%)

9.2 Comparison by Type

Chart on Comparison by Type
Data Table on Comparison by Type

9.3 20wt percentage comonomer - Market size and forecast 2025-2030

Chart on 20wt percentage comonomer - Market size and forecast 2025-2030 ($ million)
Data Table on 20wt percentage comonomer - Market size and forecast 2025-2030 ($ million)
Chart on 20wt percentage comonomer - Year-over-year growth 2025-2030 (%)
Data Table on 20wt percentage comonomer - Year-over-year growth 2025-2030 (%)

9.4 9wt percentage comonomer - Market size and forecast 2025-2030

Chart on 9wt percentage comonomer - Market size and forecast 2025-2030 ($ million)
Data Table on 9wt percentage comonomer - Market size and forecast 2025-2030 ($ million)
Chart on 9wt percentage comonomer - Year-over-year growth 2025-2030 (%)
Data Table on 9wt percentage comonomer - Year-over-year growth 2025-2030 (%)

9.5 5wt percentage comonomer - Market size and forecast 2025-2030

Chart on 5wt percentage comonomer - Market size and forecast 2025-2030 ($ million)
Data Table on 5wt percentage comonomer - Market size and forecast 2025-2030 ($ million)
Chart on 5wt percentage comonomer - Year-over-year growth 2025-2030 (%)
Data Table on 5wt percentage comonomer - Year-over-year growth 2025-2030 (%)

9.6 Market opportunity by Type

Market opportunity by Type ($ million)
Data Table on Market opportunity by Type ($ million)

10. Market Segmentation by Product Type

10.1 Market segments

Chart on Product Type - Market share 2025-2030 (%)
Data Table on Product Type - Market share 2025-2030 (%)

10.2 Comparison by Product Type

Chart on Comparison by Product Type
Data Table on Comparison by Product Type

10.3 High melt flow index - Market size and forecast 2025-2030

Chart on High melt flow index - Market size and forecast 2025-2030 ($ million)
Data Table on High melt flow index - Market size and forecast 2025-2030 ($ million)
Chart on High melt flow index - Year-over-year growth 2025-2030 (%)
Data Table on High melt flow index - Year-over-year growth 2025-2030 (%)

10.4 Low melt flow index - Market size and forecast 2025-2030

Chart on Low melt flow index - Market size and forecast 2025-2030 ($ million)
Data Table on Low melt flow index - Market size and forecast 2025-2030 ($ million)
Chart on Low melt flow index - Year-over-year growth 2025-2030 (%)
Data Table on Low melt flow index - Year-over-year growth 2025-2030 (%)

10.5 Market opportunity by Product Type

Market opportunity by Product Type ($ million)
Data Table on Market opportunity by Product Type ($ million)

11. Customer Landscape

11.1 Customer landscape overview

Analysis of price sensitivity, lifecycle, customer purchase basket, adoption rates, and purchase criteria

12. Geographic Landscape

12.1 Geographic segmentation

Chart on Market share by geography 2025-2030 (%)
Data Table on Market share by geography 2025-2030 (%)

12.2 Geographic comparison

Chart on Geographic comparison
Data Table on Geographic comparison

12.3 APAC - Market size and forecast 2025-2030

Chart on APAC - Market size and forecast 2025-2030 ($ million)
Data Table on APAC - Market size and forecast 2025-2030 ($ million)
Chart on APAC - Year-over-year growth 2025-2030 (%)
Data Table on APAC - Year-over-year growth 2025-2030 (%)
Chart on Regional Comparison - APAC
Data Table on Regional Comparison - APAC

12.3.1 China - Market size and forecast 2025-2030

Chart on China - Market size and forecast 2025-2030 ($ million)
Data Table on China - Market size and forecast 2025-2030 ($ million)
Chart on China - Year-over-year growth 2025-2030 (%)
Data Table on China - Year-over-year growth 2025-2030 (%)

12.3.2 Japan - Market size and forecast 2025-2030

Chart on Japan - Market size and forecast 2025-2030 ($ million)
Data Table on Japan - Market size and forecast 2025-2030 ($ million)
Chart on Japan - Year-over-year growth 2025-2030 (%)
Data Table on Japan - Year-over-year growth 2025-2030 (%)

12.3.3 India - Market size and forecast 2025-2030

Chart on India - Market size and forecast 2025-2030 ($ million)
Data Table on India - Market size and forecast 2025-2030 ($ million)
Chart on India - Year-over-year growth 2025-2030 (%)
Data Table on India - Year-over-year growth 2025-2030 (%)

12.3.4 South Korea - Market size and forecast 2025-2030

Chart on South Korea - Market size and forecast 2025-2030 ($ million)
Data Table on South Korea - Market size and forecast 2025-2030 ($ million)
Chart on South Korea - Year-over-year growth 2025-2030 (%)
Data Table on South Korea - Year-over-year growth 2025-2030 (%)

12.3.5 Australia - Market size and forecast 2025-2030

Chart on Australia - Market size and forecast 2025-2030 ($ million)
Data Table on Australia - Market size and forecast 2025-2030 ($ million)
Chart on Australia - Year-over-year growth 2025-2030 (%)
Data Table on Australia - Year-over-year growth 2025-2030 (%)

12.3.6 Indonesia - Market size and forecast 2025-2030

Chart on Indonesia - Market size and forecast 2025-2030 ($ million)
Data Table on Indonesia - Market size and forecast 2025-2030 ($ million)
Chart on Indonesia - Year-over-year growth 2025-2030 (%)
Data Table on Indonesia - Year-over-year growth 2025-2030 (%)

12.4 North America - Market size and forecast 2025-2030

Chart on North America - Market size and forecast 2025-2030 ($ million)
Data Table on North America - Market size and forecast 2025-2030 ($ million)
Chart on North America - Year-over-year growth 2025-2030 (%)
Data Table on North America - Year-over-year growth 2025-2030 (%)
Chart on Regional Comparison - North America
Data Table on Regional Comparison - North America

12.4.1 US - Market size and forecast 2025-2030

Chart on US - Market size and forecast 2025-2030 ($ million)
Data Table on US - Market size and forecast 2025-2030 ($ million)
Chart on US - Year-over-year growth 2025-2030 (%)
Data Table on US - Year-over-year growth 2025-2030 (%)

12.4.2 Canada - Market size and forecast 2025-2030

Chart on Canada - Market size and forecast 2025-2030 ($ million)
Data Table on Canada - Market size and forecast 2025-2030 ($ million)
Chart on Canada - Year-over-year growth 2025-2030 (%)
Data Table on Canada - Year-over-year growth 2025-2030 (%)

12.4.3 Mexico - Market size and forecast 2025-2030

Chart on Mexico - Market size and forecast 2025-2030 ($ million)
Data Table on Mexico - Market size and forecast 2025-2030 ($ million)
Chart on Mexico - Year-over-year growth 2025-2030 (%)
Data Table on Mexico - Year-over-year growth 2025-2030 (%)

12.5 Europe - Market size and forecast 2025-2030

Chart on Europe - Market size and forecast 2025-2030 ($ million)
Data Table on Europe - Market size and forecast 2025-2030 ($ million)
Chart on Europe - Year-over-year growth 2025-2030 (%)
Data Table on Europe - Year-over-year growth 2025-2030 (%)
Chart on Regional Comparison - Europe
Data Table on Regional Comparison - Europe

12.5.1 Germany - Market size and forecast 2025-2030

Chart on Germany - Market size and forecast 2025-2030 ($ million)
Data Table on Germany - Market size and forecast 2025-2030 ($ million)
Chart on Germany - Year-over-year growth 2025-2030 (%)
Data Table on Germany - Year-over-year growth 2025-2030 (%)

12.5.2 UK - Market size and forecast 2025-2030

Chart on UK - Market size and forecast 2025-2030 ($ million)
Data Table on UK - Market size and forecast 2025-2030 ($ million)
Chart on UK - Year-over-year growth 2025-2030 (%)
Data Table on UK - Year-over-year growth 2025-2030 (%)

12.5.3 France - Market size and forecast 2025-2030

Chart on France - Market size and forecast 2025-2030 ($ million)
Data Table on France - Market size and forecast 2025-2030 ($ million)
Chart on France - Year-over-year growth 2025-2030 (%)
Data Table on France - Year-over-year growth 2025-2030 (%)

12.5.4 Italy - Market size and forecast 2025-2030

Chart on Italy - Market size and forecast 2025-2030 ($ million)
Data Table on Italy - Market size and forecast 2025-2030 ($ million)
Chart on Italy - Year-over-year growth 2025-2030 (%)
Data Table on Italy - Year-over-year growth 2025-2030 (%)

12.5.5 Spain - Market size and forecast 2025-2030

Chart on Spain - Market size and forecast 2025-2030 ($ million)
Data Table on Spain - Market size and forecast 2025-2030 ($ million)
Chart on Spain - Year-over-year growth 2025-2030 (%)
Data Table on Spain - Year-over-year growth 2025-2030 (%)

12.5.6 The Netherlands - Market size and forecast 2025-2030

Chart on The Netherlands - Market size and forecast 2025-2030 ($ million)
Data Table on The Netherlands - Market size and forecast 2025-2030 ($ million)
Chart on The Netherlands - Year-over-year growth 2025-2030 (%)
Data Table on The Netherlands - Year-over-year growth 2025-2030 (%)

12.6 South America - Market size and forecast 2025-2030

Chart on South America - Market size and forecast 2025-2030 ($ million)
Data Table on South America - Market size and forecast 2025-2030 ($ million)
Chart on South America - Year-over-year growth 2025-2030 (%)
Data Table on South America - Year-over-year growth 2025-2030 (%)
Chart on Regional Comparison - South America
Data Table on Regional Comparison - South America

12.6.1 Brazil - Market size and forecast 2025-2030

Chart on Brazil - Market size and forecast 2025-2030 ($ million)
Data Table on Brazil - Market size and forecast 2025-2030 ($ million)
Chart on Brazil - Year-over-year growth 2025-2030 (%)
Data Table on Brazil - Year-over-year growth 2025-2030 (%)

12.6.2 Argentina - Market size and forecast 2025-2030

Chart on Argentina - Market size and forecast 2025-2030 ($ million)
Data Table on Argentina - Market size and forecast 2025-2030 ($ million)
Chart on Argentina - Year-over-year growth 2025-2030 (%)
Data Table on Argentina - Year-over-year growth 2025-2030 (%)

12.6.3 Chile - Market size and forecast 2025-2030

Chart on Chile - Market size and forecast 2025-2030 ($ million)
Data Table on Chile - Market size and forecast 2025-2030 ($ million)
Chart on Chile - Year-over-year growth 2025-2030 (%)
Data Table on Chile - Year-over-year growth 2025-2030 (%)

12.7 Middle East and Africa - Market size and forecast 2025-2030

Chart on Middle East and Africa - Market size and forecast 2025-2030 ($ million)
Data Table on Middle East and Africa - Market size and forecast 2025-2030 ($ million)
Chart on Middle East and Africa - Year-over-year growth 2025-2030 (%)
Data Table on Middle East and Africa - Year-over-year growth 2025-2030 (%)
Chart on Regional Comparison - Middle East and Africa
Data Table on Regional Comparison - Middle East and Africa

12.7.1 Saudi Arabia - Market size and forecast 2025-2030

Chart on Saudi Arabia - Market size and forecast 2025-2030 ($ million)
Data Table on Saudi Arabia - Market size and forecast 2025-2030 ($ million)
Chart on Saudi Arabia - Year-over-year growth 2025-2030 (%)
Data Table on Saudi Arabia - Year-over-year growth 2025-2030 (%)

12.7.2 UAE - Market size and forecast 2025-2030

Chart on UAE - Market size and forecast 2025-2030 ($ million)
Data Table on UAE - Market size and forecast 2025-2030 ($ million)
Chart on UAE - Year-over-year growth 2025-2030 (%)
Data Table on UAE - Year-over-year growth 2025-2030 (%)

12.7.3 South Africa - Market size and forecast 2025-2030

Chart on South Africa - Market size and forecast 2025-2030 ($ million)
Data Table on South Africa - Market size and forecast 2025-2030 ($ million)
Chart on South Africa - Year-over-year growth 2025-2030 (%)
Data Table on South Africa - Year-over-year growth 2025-2030 (%)

12.7.4 Turkey - Market size and forecast 2025-2030

Chart on Turkey - Market size and forecast 2025-2030 ($ million)
Data Table on Turkey - Market size and forecast 2025-2030 ($ million)
Chart on Turkey - Year-over-year growth 2025-2030 (%)
Data Table on Turkey - Year-over-year growth 2025-2030 (%)

12.7.5 Israel - Market size and forecast 2025-2030

Chart on Israel - Market size and forecast 2025-2030 ($ million)
Data Table on Israel - Market size and forecast 2025-2030 ($ million)
Chart on Israel - Year-over-year growth 2025-2030 (%)
Data Table on Israel - Year-over-year growth 2025-2030 (%)

12.8 Market opportunity by geography

Market opportunity by geography ($ million)
Data Tables on Market opportunity by geography ($ million)

13. Drivers, Challenges, and Opportunity

13.1 Market drivers

Expansion in flexible packaging demand
Transition from ethylene vinyl acetate
Adoption in lithium battery separators

13.2 Market challenges

Volatility of feedstock raw materials
Complex polymer blending and incompatibility
Stringent environmental regulations and compliance

13.3 Impact of drivers and challenges

Impact of drivers and challenges in 2025 and 2030

13.4 Market opportunities

Electrification in automotive wire shielding
Expansion of extrusion coating technologies
Adoption of high-performance metal bonding

14. Competitive Landscape

14.1 Overview

14.2

Overview on criticality of inputs and factors of differentiation

14.3 Landscape disruption

Overview on factors of disruption

14.4 Industry risks

Impact of key risks on business

15. Competitive Analysis

15.1 Companies profiled

Companies covered

15.2 Company ranking index

15.3 Market positioning of companies

Matrix on companies position and classification

15.4 Arkema Group

Arkema Group - Overview
Arkema Group - Business segments
Arkema Group - Key news
Arkema Group - Key offerings
Arkema Group - Segment focus
SWOT

15.5 Avient Corp.

Avient Corp. - Overview
Avient Corp. - Business segments
Avient Corp. - Key offerings
Avient Corp. - Segment focus
SWOT

15.6 BASF SE

BASF SE - Overview
BASF SE - Business segments
BASF SE - Key news
BASF SE - Key offerings
BASF SE - Segment focus
SWOT

15.7 Dow Chemical Co.

Dow Chemical Co. - Overview
Dow Chemical Co. - Business segments
Dow Chemical Co. - Key news
Dow Chemical Co. - Key offerings
Dow Chemical Co. - Segment focus
SWOT

15.8 ExxonMobil Chemical Co.

ExxonMobil Chemical Co. - Overview
ExxonMobil Chemical Co. - Product / Service
ExxonMobil Chemical Co. - Key offerings
SWOT

15.9 Honeywell International Inc.

Honeywell International Inc. - Overview
Honeywell International Inc. - Business segments
Honeywell International Inc. - Key news
Honeywell International Inc. - Key offerings
Honeywell International Inc. - Segment focus
SWOT

15.10 INEOS Group Holdings S.A.

INEOS Group Holdings S.A. - Overview
INEOS Group Holdings S.A. - Product / Service
INEOS Group Holdings S.A. - Key offerings
SWOT

15.11 Kingfa SCI. and TECH. Co. Ltd.

Kingfa SCI. and TECH. Co. Ltd. - Overview
Kingfa SCI. and TECH. Co. Ltd. - Product / Service
Kingfa SCI. and TECH. Co. Ltd. - Key offerings
SWOT

15.12 KURARAY Co. Ltd.

KURARAY Co. Ltd. - Overview
KURARAY Co. Ltd. - Business segments
KURARAY Co. Ltd. - Key news
KURARAY Co. Ltd. - Key offerings
KURARAY Co. Ltd. - Segment focus
SWOT

15.13 LG Chem Ltd.

LG Chem Ltd. - Overview
LG Chem Ltd. - Business segments
LG Chem Ltd. - Key news
LG Chem Ltd. - Key offerings
LG Chem Ltd. - Segment focus
SWOT

15.14 LyondellBasell Industries N.V.

LyondellBasell Industries N.V. - Overview
LyondellBasell Industries N.V. - Business segments
LyondellBasell Industries N.V. - Key news
LyondellBasell Industries N.V. - Key offerings
LyondellBasell Industries N.V. - Segment focus
SWOT

15.15 Mitsubishi Chemical Corp.

Mitsubishi Chemical Corp. - Overview
Mitsubishi Chemical Corp. - Business segments
Mitsubishi Chemical Corp. - Key offerings
Mitsubishi Chemical Corp. - Segment focus
SWOT

15.16 Mitsui Chemicals Inc.

Mitsui Chemicals Inc. - Overview
Mitsui Chemicals Inc. - Business segments
Mitsui Chemicals Inc. - Key offerings
Mitsui Chemicals Inc. - Segment focus
SWOT

15.17 Sika AG

Sika AG - Overview
Sika AG - Business segments
Sika AG - Key news
Sika AG - Key offerings
Sika AG - Segment focus
SWOT

15.18 Sumitomo Chemical Co. Ltd.

Sumitomo Chemical Co. Ltd. - Overview
Sumitomo Chemical Co. Ltd. - Business segments
Sumitomo Chemical Co. Ltd. - Key offerings
Sumitomo Chemical Co. Ltd. - Segment focus
SWOT

16. Appendix

16.1 Scope of the report

Market definition
Objectives
Notes and caveats

16.2 Inclusions and exclusions checklist

Inclusions checklist
Exclusions checklist

16.3 Currency conversion rates for US$

16.4 Research methodology

16.5 Data procurement

Information sources

16.6 Data validation

16.7 Validation techniques employed for market sizing

16.8 Data synthesis

16.9 360 degree market analysis

16.10 List of abbreviations

Research Methodology

Technavio presents a detailed picture of the market by way of study, synthesis, and summation of data from multiple sources. The analysts have presented the various facets of the market with a particular focus on identifying the key industry influencers. The data thus presented is comprehensive, reliable, and the result of extensive research, both primary and secondary.

INFORMATION SOURCES

Primary sources

  • Manufacturers and suppliers
  • Channel partners
  • Industry experts
  • Strategic decision makers

Secondary sources

  • Industry journals and periodicals
  • Government data
  • Financial reports of key industry players
  • Historical data
  • Press releases

DATA ANALYSIS

Data Synthesis

  • Collation of data
  • Estimation of key figures
  • Analysis of derived insights

Data Validation

  • Triangulation with data models
  • Reference against proprietary databases
  • Corroboration with industry experts

REPORT WRITING

Qualitative

  • Market drivers
  • Market challenges
  • Market trends
  • Five forces analysis

Quantitative

  • Market size and forecast
  • Market segmentation
  • Geographical insights
  • Competitive landscape

Interested in this report?

Get your sample now to see our research methodology and insights!

Download Now

Frequently Asked Questions

Ethylene Acrylic Acid Copolymer market growth will increase by USD 338.3 million during 2026-2030.

The Ethylene Acrylic Acid Copolymer market is expected to grow at a CAGR of 11.6% during 2026-2030.

Ethylene Acrylic Acid Copolymer market is segmented by Application (Adhesives, Barrier coating, Others) Type (20wt percentage comonomer, 9wt percentage comonomer, 5wt percentage comonomer) Product type (High melt flow index, Low melt flow index)

Arkema Group, Avient Corp., BASF SE, Borealis AG, Celanese Corp., China National Petroleum Corp., Dow Chemical Co., ExxonMobil Chemical Co., Honeywell International Inc., INEOS Group Holdings S.A., Kingfa SCI. and TECH. Co. Ltd., KURARAY Co. Ltd., LG Chem Ltd., LyondellBasell Industries N.V., Michelman Inc., Mitsubishi Chemical Corp., Mitsui Chemicals Inc., Saudi Basic Industries, Sika AG, SK Functional Polymer, SNP Inc., Sumitomo Chemical Co. Ltd. are a few of the key vendors in the Ethylene Acrylic Acid Copolymer market.

APAC will register the highest growth rate of 36.9% among the other regions. Therefore, the Ethylene Acrylic Acid Copolymer market in APAC is expected to garner significant business opportunities for the vendors during the forecast period.

China, Japan, India, South Korea, Australia, Indonesia, US, Canada, Mexico, Germany, UK, France, Italy, Spain, The Netherlands, Brazil, Argentina, Chile, Saudi Arabia, UAE, South Africa, Turkey, Israel

  • Expansion in flexible packaging demand is the driving factor this market.

The Ethylene Acrylic Acid Copolymer market vendors should focus on grabbing business opportunities from the Application segment as it accounted for the largest market share in the base year.
RIA - Research AI Assistant
Ask RIA
