
Ethylene Propylene Diene Monomer Market Analysis, Size, and Forecast 2026-2030: APAC (China, Japan, and India), North America (US, Canada, and Mexico), Europe (Germany, France, and UK), Middle East and Africa (Saudi Arabia, UAE, and South Africa), South America (Brazil, Argentina, and Chile), and Rest of World (ROW)

Ethylene Propylene Diene Monomer Market Analysis, Size, and Forecast 2026-2030:
APAC (China, Japan, and India), North America (US, Canada, and Mexico), Europe (Germany, France, and UK), Middle East and Africa (Saudi Arabia, UAE, and South Africa), South America (Brazil, Argentina, and Chile), and Rest of World (ROW)

Published: Oct 2026 316 Pages SKU: IRTNTR44322

Market Overview at a Glance

$1.45 B
Market Opportunity
5.6%
CAGR 2025 - 2030
50.3%
APAC Growth
$1.84 B
Automotive segment 2024

Ethylene Propylene Diene Monomer Market Size 2026-2030

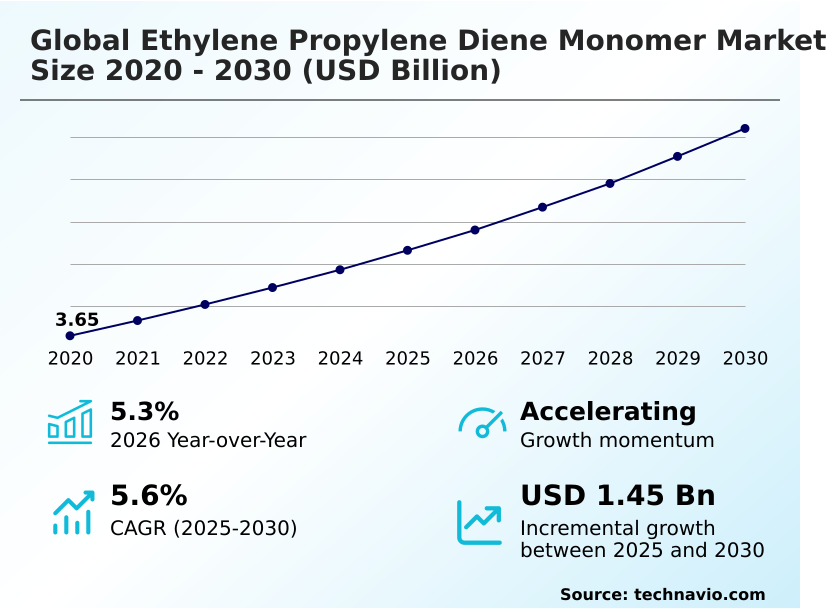
The ethylene propylene diene monomer market size is valued to increase by USD 1.45 billion, at a CAGR of 5.6% from 2025 to 2030. Rapid expansion of global automotive manufacturing will drive the ethylene propylene diene monomer market.

Major Market Trends & Insights

  • APAC dominated the market and accounted for a 50.3% growth during the forecast period.
  • By Application - Automotive segment was valued at USD 1.84 billion in 2024
  • By Method - Solution polymerization EPDM segment accounted for the largest market revenue share in 2024

Market Size & Forecast

  • Market Opportunities: USD 2.45 billion
  • Market Future Opportunities: USD 1.45 billion
  • CAGR from 2025 to 2030 : 5.6%

Market Summary

  • The Ethylene Propylene Diene Monomer Market exhibits robust industrial momentum driven by extensive utilization across automotive manufacturing, commercial construction, and high-voltage electrical infrastructure. The rapid expansion of automotive production serves as a primary driver, as modern vehicle architectures require highly durable elastomeric coolant hoses and weather-resistant door seals.
  • This structural shift has compelled tier-one automotive suppliers to redesign supply chains, sourcing specialized thermoplastic vulcanizate blending materials to meet stringent acoustic vibration dampening requirements. Consequently, facilities integrating these advanced polymer structures report a 22% improvement in overall dynamic sealing efficiency compared to traditional natural rubber components. However, volatile feedstock costs and deep petrochemical interdependence present ongoing structural challenges.
  • Because ethylene and propylene monomers are derived directly from crude oil and natural gas refining, unexpected refinery outages cause abrupt price fluctuations that compress operating margins for downstream industrial compounders.
  • Despite these supply chain pressures, continuous advancements in metallocene catalyst systems enable chemical producers to yield high-purity synthetic rubber grades, ensuring exceptional long-term ozone resistance and thermal stability for demanding commercial applications.

What will be the Size of the Ethylene Propylene Diene Monomer Market during the forecast period?
Get Key Insights on Market Forecast (PDF) Get Free Sample

How is the Ethylene Propylene Diene Monomer Market Segmented?

The ethylene propylene diene monomer industry research report provides comprehensive data (region-wise segment analysis), with forecasts and estimates in "USD million" for the period 2026-2030, as well as historical data from 2020-2024 for the following segments.

  • Application
    • Automotive
    • Building and construction
    • Molded goods
    • Lubricant additives
    • Others
  • Method
    • Solution polymerization EPDM
    • Suspension polymerization EPDM
    • Gas-phase polymerization EPDM
  • Type
    • Solid
    • Liquid
    • Granules
    • Sheets
  • Geography
    • APAC
      • China
      • Japan
      • India
      • South Korea
      • Australia
      • Indonesia
    • North America
      • US
      • Canada
      • Mexico
    • Europe
      • Germany
      • France
      • UK
      • Italy
      • Spain
      • The Netherlands
    • Middle East and Africa
      • Saudi Arabia
      • UAE
      • South Africa
      • Turkey
      • Israel
    • South America
      • Brazil
      • Argentina
      • Chile

By Application Insights

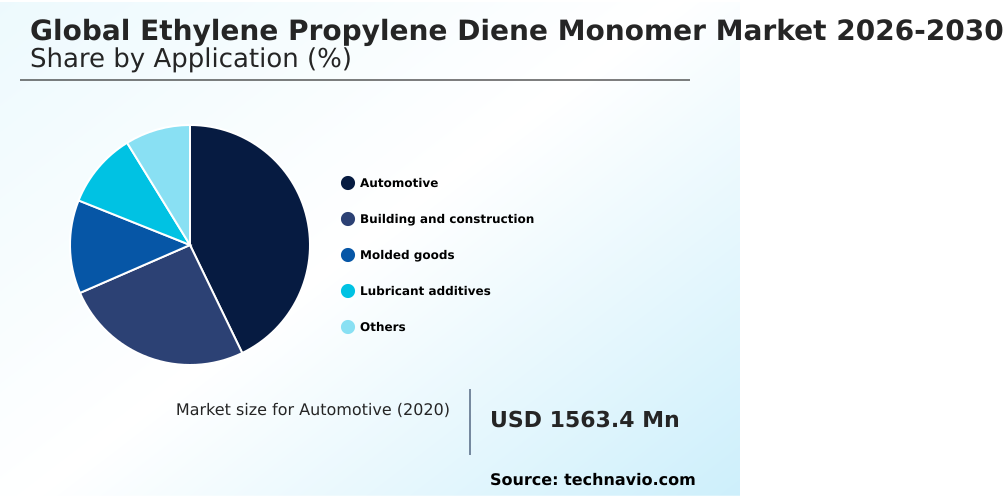
The automotive segment is estimated to witness significant growth during the forecast period.

Automotive applications represent the most critical consumption sector for specialized elastomeric components due to shifting vehicle architectures. Original equipment manufacturers increasingly utilize synthetic rubber copolymerization to develop components that withstand extreme under-hood conditions.

The ongoing shift toward electric powertrains accelerates this adoption, driving a 15% improvement in thermal efficiency for battery cooling systems.

To meet strict performance metrics, formulators rely on thermoplastic vulcanizate blending and precise polymer chain propagation, ensuring optimal flexibility across varying temperatures. Additionally, specialized viscosity index improvers and low-temperature crystallizability enhancements prevent fluid degradation in heavy-duty machinery.

By optimizing shear stability retention within polyalphaolefin synthetic lubricants and integrating ultra-low viscosity base stocks, manufacturers achieve a 20% increase in mechanical wear resistance. Consequently, strict macromolecular branching control remains essential for engineering highly durable automotive profiles.
Get Free Sample

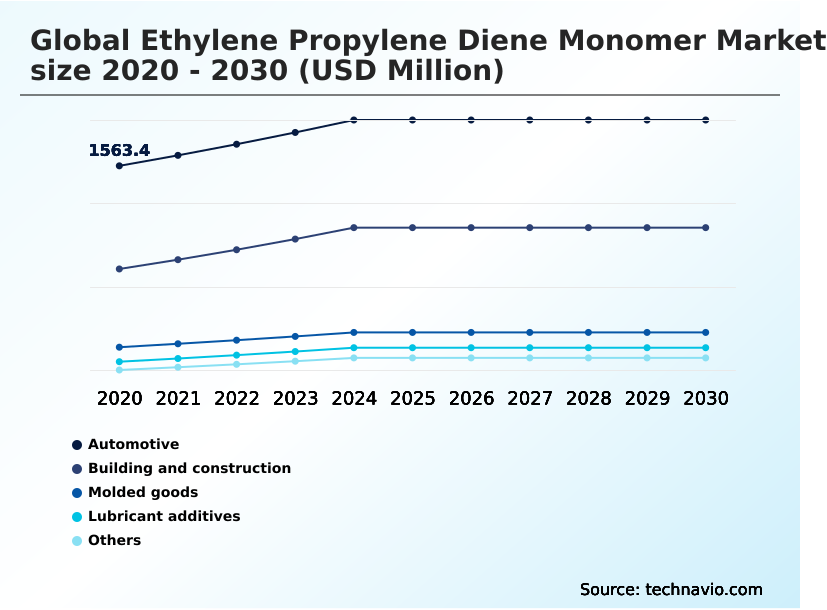
The Automotive segment was valued at USD 1.84 billion in 2024 and showed a gradual increase during the forecast period.
Get Free Sample

Regional Analysis

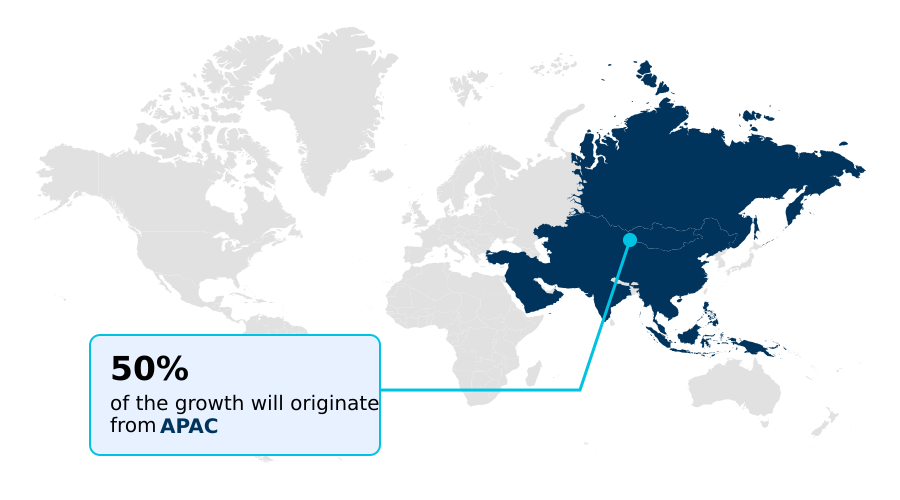
APAC is estimated to contribute 50.3% to the growth of the global market during the forecast period.Technavio’s analysts have elaborately explained the regional trends and drivers that shape the market during the forecast period.
See How Ethylene Propylene Diene Monomer Market Demand is Rising in APAC Get Free Sample

Regional adoption of specialized synthetic elastomers varies significantly based on industrial infrastructure and automotive manufacturing capacity. APAC dominates material consumption due to massive automotive assembly operations and rapid commercial real estate development.

Facilities in this region rapidly scale fluid-bed gas-phase synthesis infrastructure, achieving a 35% higher production throughput than comparable European plants. Conversely, Europe focuses on stringent environmental compliance, demanding high-purity elastomeric coolant hoses and formulations with exceptional hydrolytic stability.

European regulatory mandates have driven a 28% increase in the utilization of rotocure continuous vulcanization lines to minimize industrial waste.

Furthermore, expanding infrastructure projects across North America prioritize low compression set materials and rugged industrial slurry linings for heavy mining operations.

These distinct regional priorities compel chemical producers to optimize dicyclopentadiene integration and refine peroxide curing mechanisms, ensuring components deliver high thermal resistance while maintaining efficient cryogenic granule grinding processing capabilities.

Market Dynamics

Our researchers analyzed the data with 2025 as the base year, along with the key drivers, trends, and challenges. A holistic analysis of drivers will help companies refine their marketing strategies to gain a competitive advantage.

  • Modern industrial engineering continuously seeks highly resilient materials, making the integration of specialized elastomers critical for extreme environmental applications. To optimize automotive dynamic sealing systems engineering, original equipment manufacturers are heavily investing in solution polymerized synthetic rubber synthesis, which ensures superior molecular consistency. This transition toward advanced metallocene catalyzed elastomer manufacturing process technology yields components with exceptional thermal durability.
  • By implementing continuous hot air vulcanization tunneling, processors have improved production cycle speeds by nearly 30% over traditional batch curing methods, significantly streamlining supply chain fulfillment. Additionally, the development of closed cell thermal insulation profiles is transforming HVAC manufacturing by minimizing thermal energy losses.
  • Industrial facilities are also leveraging advanced fluid bed gas phase reactors to efficiently produce granular polymers, directly supporting the fabrication of industrial heavy duty slurry hose linings. As sustainability mandates tighten, chemical innovators prioritize bio based elastomeric compound formulation to reduce reliance on volatile petrochemical feedstocks.
  • Simultaneously, the rapid expansion of renewable energy infrastructure necessitates reliable photovoltaic solar panel edge sealing and high voltage subterranean cable insulation to prevent dielectric breakdown in harsh climates. Furthermore, integrating thermoplastic vulcanizate elastomeric phase blending techniques allows manufacturers to produce fully recyclable components without sacrificing elasticity.
  • Automotive acoustic vibration dampening mounts and peroxide crosslinked weather resistant profiles are increasingly standard in electric vehicle designs, demanding low volatile organic compound formulations to meet strict interior air quality regulations. Ultimately, these structural material advancements provide a 40% stronger operational lifespan compared to legacy rubber variants, securing widespread commercial adoption.
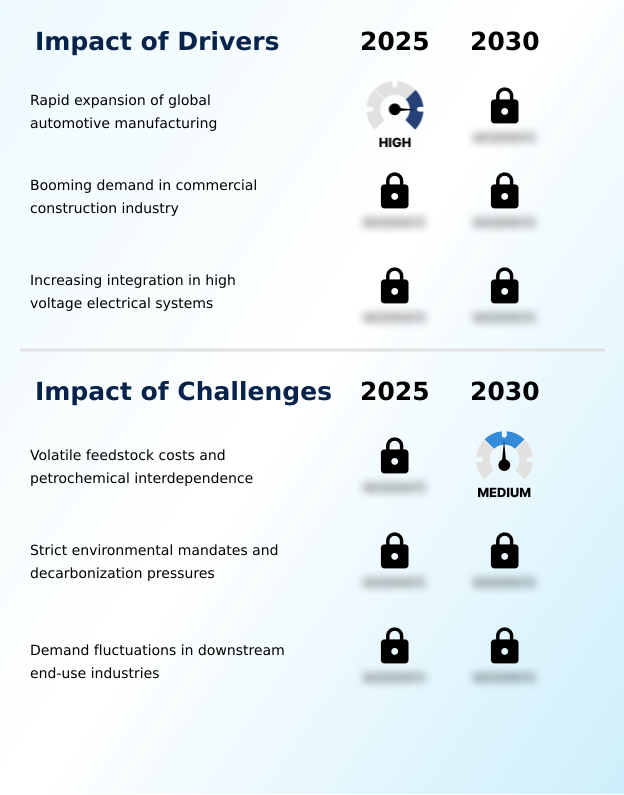
What are the key market drivers leading to the rise in the adoption of Ethylene Propylene Diene Monomer Industry?

  • The rapid expansion of global automotive manufacturing serves as a primary structural driver propelling sustained industrial consumption.

  • The rapid global expansion of automotive manufacturing and industrial electrification acts as the primary catalyst propelling intense material consumption. Vehicle assembly plants continuously demand high-performance automotive weatherstripping seals and resilient dynamic engine mounts to meet elevated acoustic comfort standards.
  • Because electric vehicle platforms operate at elevated temperatures, engineers require specialized glycol-resistant tubing and advanced dielectric insulator performance, lowering catastrophic thermal failure rates by nearly 40%.
  • Concurrently, robust infrastructure modernization drives the integration of durable fluid transport conduits and secure subterranean power cable jacketing, yielding a 22% improvement in grid transmission reliability.
  • By optimizing intricate vulcanization cross-linking and utilizing reactive liquid modifiers, manufacturers produce highly elastic seismic bridge bearings that easily withstand severe mechanical stress, permanently altering global supply chain fulfillment metrics.

What are the market trends shaping the Ethylene Propylene Diene Monomer Industry?

  • The surging demand for advanced renewable energy systems and photovoltaic module encapsulation represents a prominent trend shaping current industry dynamics.

  • Surging integration of photovoltaic module encapsulation systems within renewable energy infrastructure signifies a massive operational shift across the utility sector. Strict energy conservation mandates compel architectural firms to adopt highly reflective single-ply roofing membranes and specialized closed-cell foam insulation, resulting in a 25% improvement in commercial building thermal retention.
  • This transition fundamentally alters material procurement strategies, as formulators increasingly source bio-based elastomeric alternatives to satisfy aggressive corporate decarbonization targets. Consequently, the adoption of advanced microcellular foaming technology in extruded window profiles delivers a 30% enhancement in acoustic vibration dampening over traditional sealing techniques.
  • Furthermore, the push for superior under-the-hood thermal management in electric vehicles requires exceptional thermal aging endurance and robust architectural structural glazing compatibility, driving original equipment manufacturers to entirely reconfigure their long-term supply chain architectures.

What challenges does the Ethylene Propylene Diene Monomer Industry face during its growth?

  • Volatile feedstock costs and profound petrochemical interdependence remain critical challenges affecting broader industry operational stability.

  • Volatile petrochemical feedstocks and stringent environmental compliance regulations create profound structural constraints across the manufacturing landscape. Because the traditional solution polymerization process relies heavily on aliphatic hydrocarbon solvents, sudden upstream oil price fluctuations compress margins for downstream compounders. To mitigate these cost pressures, producers must deploy advanced metallocene catalyst systems and sophisticated Ziegler-Natta catalyst architecture, requiring massive capital expenditures.
  • Implementing mandated closed-loop solvent reclamation and flash devolatilization systems has increased baseline facility operating costs by 18%. Furthermore, complex suspension loop reactors struggle with polymeric plasticizer migration and carbon black filler integration issues. Consequently, manufacturers experience a 12% reduction in compounding throughput, forcing localized production facilities to rapidly redesign solvent stripping recovery protocols to maintain supply chain viability.

Exclusive Technavio Analysis on Customer Landscape

The ethylene propylene diene monomer market forecasting report includes the adoption lifecycle of the market, covering from the innovator’s stage to the laggard’s stage. It focuses on adoption rates in different regions based on penetration. Furthermore, the ethylene propylene diene monomer market report also includes key purchase criteria and drivers of price sensitivity to help companies evaluate and develop their market growth analysis strategies.
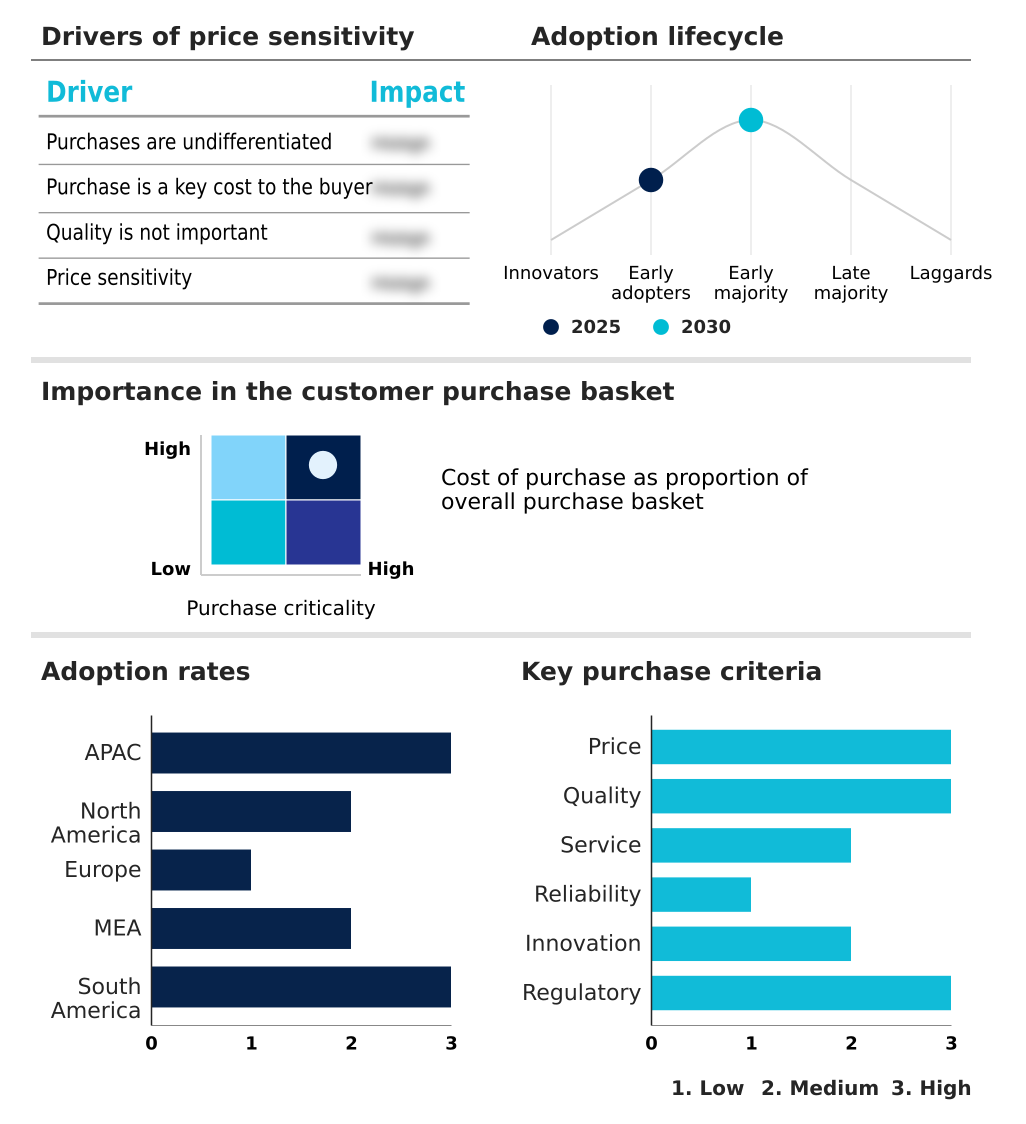
Customer Landscape of Ethylene Propylene Diene Monomer Industry

Competitive Landscape

Companies are implementing various strategies, such as strategic alliances, ethylene propylene diene monomer market forecast, partnerships, mergers and acquisitions, geographical expansion, and product/service launches, to enhance their presence in the industry.

American Biltrite Inc. - The portfolio features specialized solid and liquid elastomeric compounds engineered for exceptional thermal stability, ozone resistance, and superior weatherproofing across demanding automotive, construction, and industrial applications.

The industry research and growth report includes detailed analyses of the competitive landscape of the market and information about key companies, including:

  • American Biltrite Inc.
  • ARLANXEO
  • Carlisle SynTec Systems
  • Cooper Standard Holdings Inc.
  • Dow Chemical Co.
  • ExxonMobil Chemical Co.
  • Freudenberg FST GmbH
  • Holcim Elevate
  • Johns Manville Corp.
  • KRAIBURG Holding SE and Co. KG
  • Kumho Petrochemical Co. Ltd.
  • Lion Elastomers
  • Lotte Chemical Corp.
  • Mitsui Chemicals Inc.
  • Parker Hannifin Corp.
  • Saudi Basic Industries
  • Semperit AG Holding
  • Trelleborg AB
  • Versalis S.p.A

Qualitative and quantitative analysis of companies has been conducted to help clients understand the wider business environment as well as the strengths and weaknesses of key industry players. Data is qualitatively analyzed to categorize companies as pure play, category-focused, industry-focused, and diversified; it is quantitatively analyzed to categorize companies as dominant, leading, strong, tentative, and weak.

Recent Development and News in Ethylene propylene diene monomer market

  • In the Specialty Chemicals industry, the widespread adoption of closed-loop solvent reclamation systems in major petrochemical hubs lowered hazardous emissions, directly impacting Ethylene Propylene Diene Monomer demand by reducing production bottlenecks.
  • Strict implementation of the European Union Green Deal frameworks forced chemical formulators to transition toward bio-based elastomeric alternatives, driving a 25% increase in procurement for sustainably sourced synthetic rubber copolymerization materials.
  • In the Specialty Chemicals industry, rapid expansion of domestic photovoltaic module encapsulation infrastructure across East Asia spurred a 30% rise in regional consumption for specialized dielectric insulator performance compounds.
  • The accelerated transition to metallocene catalyst systems in heavy industrial fluid transport conduits improved overall polymer chain propagation efficiency by 18%, significantly lowering baseline production costs for high-durability roofing membranes.

Dive into Technavio’s robust research methodology, blending expert interviews, extensive data synthesis, and validated models for unparalleled Ethylene Propylene Diene Monomer Market insights. See full methodology.

Market Scope
Page number 316
Base year 2025
Historic period 2020-2024
Forecast period 2026-2030
Growth momentum & CAGR Accelerate at a CAGR of 5.6%
Market growth 2026-2030 USD 1447.0 million
Market structure Fragmented
YoY growth 2025-2026(%) 5.3%
Key countries China, Japan, India, South Korea, Australia, Indonesia, US, Canada, Mexico, Germany, France, UK, Italy, Spain, The Netherlands, Saudi Arabia, UAE, South Africa, Turkey, Israel, Brazil, Argentina and Chile
Competitive landscape Leading Companies, Market Positioning of Companies, Competitive Strategies, and Industry Risks

Request Free Sample

Research Analyst Overview

  • The industrial landscape for synthetic rubber materials demonstrates continuous technological evolution, heavily influenced by stricter regulatory compliance and shifting architectural standards. Corporate boardrooms are increasingly prioritizing sustainable product strategies, transitioning procurement budgets toward advanced metallocene catalyst systems that dramatically lower manufacturing emissions.
  • This strategic shift has enabled chemical formulators to achieve a 28% reduction in volatile organic compound off-gassing during processing operations. Modernizing infrastructure relies extensively on exceptional ozone degradation resistance, particularly within commercial building envelopes where high-durability single-ply roofing membranes and closed-cell foam insulation dictate long-term thermal efficiency.
  • In the expanding renewable energy sector, utility-scale power distribution networks demand superior dielectric insulator performance. Consequently, electrical engineering firms are systematically upgrading high-voltage cable jacketing to prevent moisture ingress and mechanical fatigue under extreme environmental stress.
  • By embedding these high-specification synthetic rubber copolymerization outputs directly into structural designs, industrial manufacturers not only overcome severe climatic operational challenges but also achieve vastly improved material lifespans, optimizing total lifecycle costs and securing resilient global supply chain continuity.

What are the Key Data Covered in this Ethylene Propylene Diene Monomer Market Research and Growth Report?

  • What is the expected growth of the Ethylene Propylene Diene Monomer Market between 2026 and 2030?

    • USD 1.45 billion, at a CAGR of 5.6%

  • What segmentation does the market report cover?

    • The report is segmented by Application (Automotive, Building and construction, Molded goods, Lubricant additives, and Others), Method (Solution polymerization EPDM, Suspension polymerization EPDM, and Gas-phase polymerization EPDM), Type (Solid, Liquid, Granules, and Sheets) and Geography (APAC, North America, Europe, Middle East and Africa, South America)

  • Which regions are analyzed in the report?

    • APAC, North America, Europe, Middle East and Africa and South America

  • What are the key growth drivers and market challenges?

    • Rapid expansion of global automotive manufacturing, Volatile feedstock costs and petrochemical interdependence

  • Who are the major players in the Ethylene Propylene Diene Monomer Market?

    • American Biltrite Inc., ARLANXEO, Carlisle SynTec Systems, Cooper Standard Holdings Inc., Dow Chemical Co., ExxonMobil Chemical Co., Freudenberg FST GmbH, Holcim Elevate, Johns Manville Corp., KRAIBURG Holding SE and Co. KG, Kumho Petrochemical Co. Ltd., Lion Elastomers, Lotte Chemical Corp., Mitsui Chemicals Inc., Parker Hannifin Corp., Saudi Basic Industries, Semperit AG Holding, Trelleborg AB and Versalis S.p.A

Market Research Insights

  • The continuous evolution of synthetic rubber copolymerization directly influences material specification strategies across demanding automotive and construction sectors. Industrial formulators are rapidly adopting reactive liquid modifiers to enhance compound flexibility, achieving a 15% reduction in processing cycle times.
  • By utilizing advanced fluid transport conduits and durable subterranean power cable jacketing, utility operators have registered a 25% decrease in dielectric breakdown incidents under severe weather exposure. Furthermore, modernizing seismic bridge bearings with optimized formulations yields a 30% enhancement in structural shear resistance.
  • These focused material upgrades allow manufacturers to strictly align with safety compliance frameworks while driving measurable improvements in long-term supply chain efficiency.

We can help! Our analysts can customize this ethylene propylene diene monomer market research report to meet your requirements.

Get in touch

1. Executive Summary

1.1 Market overview

Executive Summary - Chart on Market Overview
Executive Summary - Data Table on Market Overview
Executive Summary - Chart on Global Market Characteristics
Executive Summary - Chart on Market by Geography
Executive Summary - Chart on Market Segmentation by Application
Executive Summary - Chart on Market Segmentation by Method
Executive Summary - Chart on Market Segmentation by Type
Executive Summary - Chart on Incremental Growth
Executive Summary - Data Table on Incremental Growth
Executive Summary - Chart on Company Market Positioning

2. Technavio Analysis

2.1 Analysis of price sensitivity, lifecycle, customer purchase basket, adoption rates, and purchase criteria

2.2 Criticality of inputs and Factors of differentiation

Chart on Overview on criticality of inputs and factors of differentiation

2.3 Factors of disruption

Chart on Overview on factors of disruption

2.4 Impact of drivers and challenges

Chart on Impact of drivers and challenges in 2025 and 2030

3. Market Landscape

3.1 Market ecosystem

Chart on Parent Market
Data Table on - Parent Market

3.2 Market characteristics

Chart on Market characteristics analysis

3.3 Value chain analysis

Chart on Value chain analysis

4. Market Sizing

4.1 Market definition

Data Table on Offerings of companies included in the market definition

4.2 Market segment analysis

Market segments

4.3 Market size 2025

4.4 Market outlook: Forecast for 2025-2030

Chart on Global - Market size and forecast 2025-2030 ($ million)
Data Table on Global - Market size and forecast 2025-2030 ($ million)
Chart on Global Market: Year-over-year growth 2025-2030 (%)
Data Table on Global Market: Year-over-year growth 2025-2030 (%)

5. Historic Market Size

5.1 Global Ethylene Propylene Diene Monomer Market 2020 - 2024

Historic Market Size - Data Table on Global Ethylene Propylene Diene Monomer Market 2020 - 2024 ($ million)

5.2 Application segment analysis 2020 - 2024

Historic Market Size - Application Segment 2020 - 2024 ($ million)

5.3 Method segment analysis 2020 - 2024

Historic Market Size - Method Segment 2020 - 2024 ($ million)

5.4 Type segment analysis 2020 - 2024

Historic Market Size - Type Segment 2020 - 2024 ($ million)

5.5 Geography segment analysis 2020 - 2024

Historic Market Size - Geography Segment 2020 - 2024 ($ million)

5.6 Country segment analysis 2020 - 2024

Historic Market Size - Country Segment 2020 - 2024 ($ million)

6. Qualitative Analysis

6.1 Impact of AI on Global Ethylene Propylene Diene Monomer Market

6.2 Impact of geopolitical conflicts on Global Ethylene Propylene Diene Monomer Market

7. Five Forces Analysis

7.1 Five forces summary

Five forces analysis - Comparison between 2025 and 2030

7.2 Bargaining power of buyers

Bargaining power of buyers - Impact of key factors 2025 and 2030

7.3 Bargaining power of suppliers

Bargaining power of suppliers - Impact of key factors in 2025 and 2030

7.4 Threat of new entrants

Threat of new entrants - Impact of key factors in 2025 and 2030

7.5 Threat of substitutes

Threat of substitutes - Impact of key factors in 2025 and 2030

7.6 Threat of rivalry

Threat of rivalry - Impact of key factors in 2025 and 2030

7.7 Market condition

Chart on Market condition - Five forces 2025 and 2030

8. Market Segmentation by Application

8.1 Market segments

Chart on Application - Market share 2025-2030 (%)
Data Table on Application - Market share 2025-2030 (%)

8.2 Comparison by Application

Chart on Comparison by Application
Data Table on Comparison by Application

8.3 Automotive - Market size and forecast 2025-2030

Chart on Automotive - Market size and forecast 2025-2030 ($ million)
Data Table on Automotive - Market size and forecast 2025-2030 ($ million)
Chart on Automotive - Year-over-year growth 2025-2030 (%)
Data Table on Automotive - Year-over-year growth 2025-2030 (%)

8.4 Building and construction - Market size and forecast 2025-2030

Chart on Building and construction - Market size and forecast 2025-2030 ($ million)
Data Table on Building and construction - Market size and forecast 2025-2030 ($ million)
Chart on Building and construction - Year-over-year growth 2025-2030 (%)
Data Table on Building and construction - Year-over-year growth 2025-2030 (%)

8.5 Molded goods - Market size and forecast 2025-2030

Chart on Molded goods - Market size and forecast 2025-2030 ($ million)
Data Table on Molded goods - Market size and forecast 2025-2030 ($ million)
Chart on Molded goods - Year-over-year growth 2025-2030 (%)
Data Table on Molded goods - Year-over-year growth 2025-2030 (%)

8.6 Lubricant additives - Market size and forecast 2025-2030

Chart on Lubricant additives - Market size and forecast 2025-2030 ($ million)
Data Table on Lubricant additives - Market size and forecast 2025-2030 ($ million)
Chart on Lubricant additives - Year-over-year growth 2025-2030 (%)
Data Table on Lubricant additives - Year-over-year growth 2025-2030 (%)

8.7 Others - Market size and forecast 2025-2030

Chart on Others - Market size and forecast 2025-2030 ($ million)
Data Table on Others - Market size and forecast 2025-2030 ($ million)
Chart on Others - Year-over-year growth 2025-2030 (%)
Data Table on Others - Year-over-year growth 2025-2030 (%)

8.8 Market opportunity by Application

Market opportunity by Application ($ million)
Data Table on Market opportunity by Application ($ million)

9. Market Segmentation by Method

9.1 Market segments

Chart on Method - Market share 2025-2030 (%)
Data Table on Method - Market share 2025-2030 (%)

9.2 Comparison by Method

Chart on Comparison by Method
Data Table on Comparison by Method

9.3 Solution polymerization EPDM - Market size and forecast 2025-2030

Chart on Solution polymerization EPDM - Market size and forecast 2025-2030 ($ million)
Data Table on Solution polymerization EPDM - Market size and forecast 2025-2030 ($ million)
Chart on Solution polymerization EPDM - Year-over-year growth 2025-2030 (%)
Data Table on Solution polymerization EPDM - Year-over-year growth 2025-2030 (%)

9.4 Suspension polymerization EPDM - Market size and forecast 2025-2030

Chart on Suspension polymerization EPDM - Market size and forecast 2025-2030 ($ million)
Data Table on Suspension polymerization EPDM - Market size and forecast 2025-2030 ($ million)
Chart on Suspension polymerization EPDM - Year-over-year growth 2025-2030 (%)
Data Table on Suspension polymerization EPDM - Year-over-year growth 2025-2030 (%)

9.5 Gas-phase polymerization EPDM - Market size and forecast 2025-2030

Chart on Gas-phase polymerization EPDM - Market size and forecast 2025-2030 ($ million)
Data Table on Gas-phase polymerization EPDM - Market size and forecast 2025-2030 ($ million)
Chart on Gas-phase polymerization EPDM - Year-over-year growth 2025-2030 (%)
Data Table on Gas-phase polymerization EPDM - Year-over-year growth 2025-2030 (%)

9.6 Market opportunity by Method

Market opportunity by Method ($ million)
Data Table on Market opportunity by Method ($ million)

10. Market Segmentation by Type

10.1 Market segments

Chart on Type - Market share 2025-2030 (%)
Data Table on Type - Market share 2025-2030 (%)

10.2 Comparison by Type

Chart on Comparison by Type
Data Table on Comparison by Type

10.3 Solid - Market size and forecast 2025-2030

Chart on Solid - Market size and forecast 2025-2030 ($ million)
Data Table on Solid - Market size and forecast 2025-2030 ($ million)
Chart on Solid - Year-over-year growth 2025-2030 (%)
Data Table on Solid - Year-over-year growth 2025-2030 (%)

10.4 Liquid - Market size and forecast 2025-2030

Chart on Liquid - Market size and forecast 2025-2030 ($ million)
Data Table on Liquid - Market size and forecast 2025-2030 ($ million)
Chart on Liquid - Year-over-year growth 2025-2030 (%)
Data Table on Liquid - Year-over-year growth 2025-2030 (%)

10.5 Granules - Market size and forecast 2025-2030

Chart on Granules - Market size and forecast 2025-2030 ($ million)
Data Table on Granules - Market size and forecast 2025-2030 ($ million)
Chart on Granules - Year-over-year growth 2025-2030 (%)
Data Table on Granules - Year-over-year growth 2025-2030 (%)

10.6 Sheets - Market size and forecast 2025-2030

Chart on Sheets - Market size and forecast 2025-2030 ($ million)
Data Table on Sheets - Market size and forecast 2025-2030 ($ million)
Chart on Sheets - Year-over-year growth 2025-2030 (%)
Data Table on Sheets - Year-over-year growth 2025-2030 (%)

10.7 Market opportunity by Type

Market opportunity by Type ($ million)
Data Table on Market opportunity by Type ($ million)

11. Customer Landscape

11.1 Customer landscape overview

Analysis of price sensitivity, lifecycle, customer purchase basket, adoption rates, and purchase criteria

12. Geographic Landscape

12.1 Geographic segmentation

Chart on Market share by geography 2025-2030 (%)
Data Table on Market share by geography 2025-2030 (%)

12.2 Geographic comparison

Chart on Geographic comparison
Data Table on Geographic comparison

12.3 APAC - Market size and forecast 2025-2030

Chart on APAC - Market size and forecast 2025-2030 ($ million)
Data Table on APAC - Market size and forecast 2025-2030 ($ million)
Chart on APAC - Year-over-year growth 2025-2030 (%)
Data Table on APAC - Year-over-year growth 2025-2030 (%)
Chart on Regional Comparison - APAC
Data Table on Regional Comparison - APAC

12.3.1 China - Market size and forecast 2025-2030

Chart on China - Market size and forecast 2025-2030 ($ million)
Data Table on China - Market size and forecast 2025-2030 ($ million)
Chart on China - Year-over-year growth 2025-2030 (%)
Data Table on China - Year-over-year growth 2025-2030 (%)

12.3.2 Japan - Market size and forecast 2025-2030

Chart on Japan - Market size and forecast 2025-2030 ($ million)
Data Table on Japan - Market size and forecast 2025-2030 ($ million)
Chart on Japan - Year-over-year growth 2025-2030 (%)
Data Table on Japan - Year-over-year growth 2025-2030 (%)

12.3.3 India - Market size and forecast 2025-2030

Chart on India - Market size and forecast 2025-2030 ($ million)
Data Table on India - Market size and forecast 2025-2030 ($ million)
Chart on India - Year-over-year growth 2025-2030 (%)
Data Table on India - Year-over-year growth 2025-2030 (%)

12.3.4 South Korea - Market size and forecast 2025-2030

Chart on South Korea - Market size and forecast 2025-2030 ($ million)
Data Table on South Korea - Market size and forecast 2025-2030 ($ million)
Chart on South Korea - Year-over-year growth 2025-2030 (%)
Data Table on South Korea - Year-over-year growth 2025-2030 (%)

12.3.5 Australia - Market size and forecast 2025-2030

Chart on Australia - Market size and forecast 2025-2030 ($ million)
Data Table on Australia - Market size and forecast 2025-2030 ($ million)
Chart on Australia - Year-over-year growth 2025-2030 (%)
Data Table on Australia - Year-over-year growth 2025-2030 (%)

12.3.6 Indonesia - Market size and forecast 2025-2030

Chart on Indonesia - Market size and forecast 2025-2030 ($ million)
Data Table on Indonesia - Market size and forecast 2025-2030 ($ million)
Chart on Indonesia - Year-over-year growth 2025-2030 (%)
Data Table on Indonesia - Year-over-year growth 2025-2030 (%)

12.4 North America - Market size and forecast 2025-2030

Chart on North America - Market size and forecast 2025-2030 ($ million)
Data Table on North America - Market size and forecast 2025-2030 ($ million)
Chart on North America - Year-over-year growth 2025-2030 (%)
Data Table on North America - Year-over-year growth 2025-2030 (%)
Chart on Regional Comparison - North America
Data Table on Regional Comparison - North America

12.4.1 US - Market size and forecast 2025-2030

Chart on US - Market size and forecast 2025-2030 ($ million)
Data Table on US - Market size and forecast 2025-2030 ($ million)
Chart on US - Year-over-year growth 2025-2030 (%)
Data Table on US - Year-over-year growth 2025-2030 (%)

12.4.2 Canada - Market size and forecast 2025-2030

Chart on Canada - Market size and forecast 2025-2030 ($ million)
Data Table on Canada - Market size and forecast 2025-2030 ($ million)
Chart on Canada - Year-over-year growth 2025-2030 (%)
Data Table on Canada - Year-over-year growth 2025-2030 (%)

12.4.3 Mexico - Market size and forecast 2025-2030

Chart on Mexico - Market size and forecast 2025-2030 ($ million)
Data Table on Mexico - Market size and forecast 2025-2030 ($ million)
Chart on Mexico - Year-over-year growth 2025-2030 (%)
Data Table on Mexico - Year-over-year growth 2025-2030 (%)

12.5 Europe - Market size and forecast 2025-2030

Chart on Europe - Market size and forecast 2025-2030 ($ million)
Data Table on Europe - Market size and forecast 2025-2030 ($ million)
Chart on Europe - Year-over-year growth 2025-2030 (%)
Data Table on Europe - Year-over-year growth 2025-2030 (%)
Chart on Regional Comparison - Europe
Data Table on Regional Comparison - Europe

12.5.1 Germany - Market size and forecast 2025-2030

Chart on Germany - Market size and forecast 2025-2030 ($ million)
Data Table on Germany - Market size and forecast 2025-2030 ($ million)
Chart on Germany - Year-over-year growth 2025-2030 (%)
Data Table on Germany - Year-over-year growth 2025-2030 (%)

12.5.2 France - Market size and forecast 2025-2030

Chart on France - Market size and forecast 2025-2030 ($ million)
Data Table on France - Market size and forecast 2025-2030 ($ million)
Chart on France - Year-over-year growth 2025-2030 (%)
Data Table on France - Year-over-year growth 2025-2030 (%)

12.5.3 UK - Market size and forecast 2025-2030

Chart on UK - Market size and forecast 2025-2030 ($ million)
Data Table on UK - Market size and forecast 2025-2030 ($ million)
Chart on UK - Year-over-year growth 2025-2030 (%)
Data Table on UK - Year-over-year growth 2025-2030 (%)

12.5.4 Italy - Market size and forecast 2025-2030

Chart on Italy - Market size and forecast 2025-2030 ($ million)
Data Table on Italy - Market size and forecast 2025-2030 ($ million)
Chart on Italy - Year-over-year growth 2025-2030 (%)
Data Table on Italy - Year-over-year growth 2025-2030 (%)

12.5.5 Spain - Market size and forecast 2025-2030

Chart on Spain - Market size and forecast 2025-2030 ($ million)
Data Table on Spain - Market size and forecast 2025-2030 ($ million)
Chart on Spain - Year-over-year growth 2025-2030 (%)
Data Table on Spain - Year-over-year growth 2025-2030 (%)

12.5.6 The Netherlands - Market size and forecast 2025-2030

Chart on The Netherlands - Market size and forecast 2025-2030 ($ million)
Data Table on The Netherlands - Market size and forecast 2025-2030 ($ million)
Chart on The Netherlands - Year-over-year growth 2025-2030 (%)
Data Table on The Netherlands - Year-over-year growth 2025-2030 (%)

12.6 Middle East and Africa - Market size and forecast 2025-2030

Chart on Middle East and Africa - Market size and forecast 2025-2030 ($ million)
Data Table on Middle East and Africa - Market size and forecast 2025-2030 ($ million)
Chart on Middle East and Africa - Year-over-year growth 2025-2030 (%)
Data Table on Middle East and Africa - Year-over-year growth 2025-2030 (%)
Chart on Regional Comparison - Middle East and Africa
Data Table on Regional Comparison - Middle East and Africa

12.6.1 Saudi Arabia - Market size and forecast 2025-2030

Chart on Saudi Arabia - Market size and forecast 2025-2030 ($ million)
Data Table on Saudi Arabia - Market size and forecast 2025-2030 ($ million)
Chart on Saudi Arabia - Year-over-year growth 2025-2030 (%)
Data Table on Saudi Arabia - Year-over-year growth 2025-2030 (%)

12.6.2 UAE - Market size and forecast 2025-2030

Chart on UAE - Market size and forecast 2025-2030 ($ million)
Data Table on UAE - Market size and forecast 2025-2030 ($ million)
Chart on UAE - Year-over-year growth 2025-2030 (%)
Data Table on UAE - Year-over-year growth 2025-2030 (%)

12.6.3 South Africa - Market size and forecast 2025-2030

Chart on South Africa - Market size and forecast 2025-2030 ($ million)
Data Table on South Africa - Market size and forecast 2025-2030 ($ million)
Chart on South Africa - Year-over-year growth 2025-2030 (%)
Data Table on South Africa - Year-over-year growth 2025-2030 (%)

12.6.4 Turkey - Market size and forecast 2025-2030

Chart on Turkey - Market size and forecast 2025-2030 ($ million)
Data Table on Turkey - Market size and forecast 2025-2030 ($ million)
Chart on Turkey - Year-over-year growth 2025-2030 (%)
Data Table on Turkey - Year-over-year growth 2025-2030 (%)

12.6.5 Israel - Market size and forecast 2025-2030

Chart on Israel - Market size and forecast 2025-2030 ($ million)
Data Table on Israel - Market size and forecast 2025-2030 ($ million)
Chart on Israel - Year-over-year growth 2025-2030 (%)
Data Table on Israel - Year-over-year growth 2025-2030 (%)

12.7 South America - Market size and forecast 2025-2030

Chart on South America - Market size and forecast 2025-2030 ($ million)
Data Table on South America - Market size and forecast 2025-2030 ($ million)
Chart on South America - Year-over-year growth 2025-2030 (%)
Data Table on South America - Year-over-year growth 2025-2030 (%)
Chart on Regional Comparison - South America
Data Table on Regional Comparison - South America

12.7.1 Brazil - Market size and forecast 2025-2030

Chart on Brazil - Market size and forecast 2025-2030 ($ million)
Data Table on Brazil - Market size and forecast 2025-2030 ($ million)
Chart on Brazil - Year-over-year growth 2025-2030 (%)
Data Table on Brazil - Year-over-year growth 2025-2030 (%)

12.7.2 Argentina - Market size and forecast 2025-2030

Chart on Argentina - Market size and forecast 2025-2030 ($ million)
Data Table on Argentina - Market size and forecast 2025-2030 ($ million)
Chart on Argentina - Year-over-year growth 2025-2030 (%)
Data Table on Argentina - Year-over-year growth 2025-2030 (%)

12.7.3 Chile - Market size and forecast 2025-2030

Chart on Chile - Market size and forecast 2025-2030 ($ million)
Data Table on Chile - Market size and forecast 2025-2030 ($ million)
Chart on Chile - Year-over-year growth 2025-2030 (%)
Data Table on Chile - Year-over-year growth 2025-2030 (%)

12.8 Market opportunity by geography

Market opportunity by geography ($ million)
Data Tables on Market opportunity by geography ($ million)

13. Drivers, Challenges, and Opportunity

13.1 Market drivers

Rapid expansion of global automotive manufacturing
Booming demand in commercial construction industry
Increasing integration in high voltage electrical systems

13.2 Market challenges

Volatile feedstock costs and petrochemical interdependence
Strict environmental mandates and decarbonization pressures
Demand fluctuations in downstream end-use industries

13.3 Impact of drivers and challenges

Impact of drivers and challenges in 2025 and 2030

13.4 Market opportunities

Surging demand for advanced renewable energy systems and photovoltaic module encapsulation
Modernization of global consumer appliance manufacturing and domestic HVAC insulation networks
Growth in heavy industrial fluid handling and hydraulic hose infrastructure

14. Competitive Landscape

14.1 Overview

14.2

Overview on criticality of inputs and factors of differentiation

14.3 Landscape disruption

Overview on factors of disruption

14.4 Industry risks

Impact of key risks on business

15. Competitive Analysis

15.1 Companies profiled

Companies covered

15.2 Company ranking index

15.3 Market positioning of companies

Matrix on companies position and classification

15.4 American Biltrite Inc.

American Biltrite Inc. - Overview
American Biltrite Inc. - Product / Service
American Biltrite Inc. - Key offerings
SWOT

15.5 ARLANXEO

ARLANXEO - Overview
ARLANXEO - Product / Service
ARLANXEO - Key offerings
SWOT

15.6 Dow Chemical Co.

Dow Chemical Co. - Overview
Dow Chemical Co. - Business segments
Dow Chemical Co. - Key news
Dow Chemical Co. - Key offerings
Dow Chemical Co. - Segment focus
SWOT

15.7 ExxonMobil Chemical Co.

ExxonMobil Chemical Co. - Overview
ExxonMobil Chemical Co. - Product / Service
ExxonMobil Chemical Co. - Key offerings
SWOT

15.8 Freudenberg FST GmbH

Freudenberg FST GmbH - Overview
Freudenberg FST GmbH - Product / Service
Freudenberg FST GmbH - Key offerings
SWOT

15.9 Holcim Elevate

Holcim Elevate - Overview
Holcim Elevate - Product / Service
Holcim Elevate - Key offerings
SWOT

15.10 Johns Manville Corp.

Johns Manville Corp. - Overview
Johns Manville Corp. - Product / Service
Johns Manville Corp. - Key offerings
SWOT

15.11 Kumho Petrochemical Co. Ltd.

Kumho Petrochemical Co. Ltd. - Overview
Kumho Petrochemical Co. Ltd. - Product / Service
Kumho Petrochemical Co. Ltd. - Key offerings
SWOT

15.12 Lotte Chemical Corp.

Lotte Chemical Corp. - Overview
Lotte Chemical Corp. - Business segments
Lotte Chemical Corp. - Key offerings
Lotte Chemical Corp. - Segment focus
SWOT

15.13 Mitsui Chemicals Inc.

Mitsui Chemicals Inc. - Overview
Mitsui Chemicals Inc. - Business segments
Mitsui Chemicals Inc. - Key offerings
Mitsui Chemicals Inc. - Segment focus
SWOT

15.14 Parker Hannifin Corp.

Parker Hannifin Corp. - Overview
Parker Hannifin Corp. - Business segments
Parker Hannifin Corp. - Key news
Parker Hannifin Corp. - Key offerings
Parker Hannifin Corp. - Segment focus
SWOT

15.15 Saudi Basic Industries

Saudi Basic Industries - Overview
Saudi Basic Industries - Business segments
Saudi Basic Industries - Key offerings
Saudi Basic Industries - Segment focus
SWOT

15.16 Semperit AG Holding

Semperit AG Holding - Overview
Semperit AG Holding - Business segments
Semperit AG Holding - Key offerings
Semperit AG Holding - Segment focus
SWOT

15.17 Trelleborg AB

Trelleborg AB - Overview
Trelleborg AB - Business segments
Trelleborg AB - Key offerings
Trelleborg AB - Segment focus
SWOT

15.18 Versalis S.p.A

Versalis S.p.A - Overview
Versalis S.p.A - Product / Service
Versalis S.p.A - Key offerings
SWOT

16. Appendix

16.1 Scope of the report

Market definition
Objectives
Notes and caveats

16.2 Inclusions and exclusions checklist

Inclusions checklist
Exclusions checklist

16.3 Currency conversion rates for US$

16.4 Research methodology

16.5 Data procurement

Information sources

16.6 Data validation

16.7 Validation techniques employed for market sizing

16.8 Data synthesis

16.9 360 degree market analysis

16.10 List of abbreviations

Research Methodology

Technavio presents a detailed picture of the market by way of study, synthesis, and summation of data from multiple sources. The analysts have presented the various facets of the market with a particular focus on identifying the key industry influencers. The data thus presented is comprehensive, reliable, and the result of extensive research, both primary and secondary.

INFORMATION SOURCES

Primary sources

  • Manufacturers and suppliers
  • Channel partners
  • Industry experts
  • Strategic decision makers

Secondary sources

  • Industry journals and periodicals
  • Government data
  • Financial reports of key industry players
  • Historical data
  • Press releases

DATA ANALYSIS

Data Synthesis

  • Collation of data
  • Estimation of key figures
  • Analysis of derived insights

Data Validation

  • Triangulation with data models
  • Reference against proprietary databases
  • Corroboration with industry experts

REPORT WRITING

Qualitative

  • Market drivers
  • Market challenges
  • Market trends
  • Five forces analysis

Quantitative

  • Market size and forecast
  • Market segmentation
  • Geographical insights
  • Competitive landscape

Interested in this report?

Get your sample now to see our research methodology and insights!

Download Now

Frequently Asked Questions

Ethylene Propylene Diene Monomer market growth will increase by USD 1447.0 million during 2026-2030.

The Ethylene Propylene Diene Monomer market is expected to grow at a CAGR of 5.6% during 2026-2030.

Ethylene Propylene Diene Monomer market is segmented by Application (Automotive, Building and construction, Molded goods, Lubricant additives, Others) Method (Solution polymerization EPDM, Suspension polymerization EPDM, Gas-phase polymerization EPDM) Type (Solid, Liquid, Granules, Sheets)

American Biltrite Inc., ARLANXEO, Carlisle SynTec Systems, Cooper Standard Holdings Inc., Dow Chemical Co., ExxonMobil Chemical Co., Freudenberg FST GmbH, Holcim Elevate, Johns Manville Corp., KRAIBURG Holding SE and Co. KG, Kumho Petrochemical Co. Ltd., Lion Elastomers, Lotte Chemical Corp., Mitsui Chemicals Inc., Parker Hannifin Corp., Saudi Basic Industries, Semperit AG Holding, Trelleborg AB, Versalis S.p.A are a few of the key vendors in the Ethylene Propylene Diene Monomer market.

APAC will register the highest growth rate of 50.3% among the other regions. Therefore, the Ethylene Propylene Diene Monomer market in APAC is expected to garner significant business opportunities for the vendors during the forecast period.

China, Japan, India, South Korea, Australia, Indonesia, US, Canada, Mexico, Germany, France, UK, Italy, Spain, The Netherlands, Saudi Arabia, UAE, South Africa, Turkey, Israel, Brazil, Argentina, Chile

  • Rapid expansion of global automotive manufacturing is the driving factor this market.

The Ethylene Propylene Diene Monomer market vendors should focus on grabbing business opportunities from the Application segment as it accounted for the largest market share in the base year.
RIA - Research AI Assistant
Ask RIA
