
Fatty Alcohols Market Analysis, Size, and Forecast 2026-2030: APAC (China, Japan, and India), Europe (Germany, UK, and France), North America (US, Canada, and Mexico), Middle East and Africa (Saudi Arabia, UAE, and South Africa), South America (Brazil, Argentina, and Chile), and Rest of World (ROW)

Fatty Alcohols Market Analysis, Size, and Forecast 2026-2030:
APAC (China, Japan, and India), Europe (Germany, UK, and France), North America (US, Canada, and Mexico), Middle East and Africa (Saudi Arabia, UAE, and South Africa), South America (Brazil, Argentina, and Chile), and Rest of World (ROW)

Published: Oct 2026 301 Pages SKU: IRTNTR45956

Market Overview at a Glance

$632.6 Mn
Market Opportunity
2.1%
CAGR 2025 - 2030
54.3%
APAC Growth
$2.44 B
Pure and midcut segment 2024

Fatty Alcohols Market Size 2026-2030

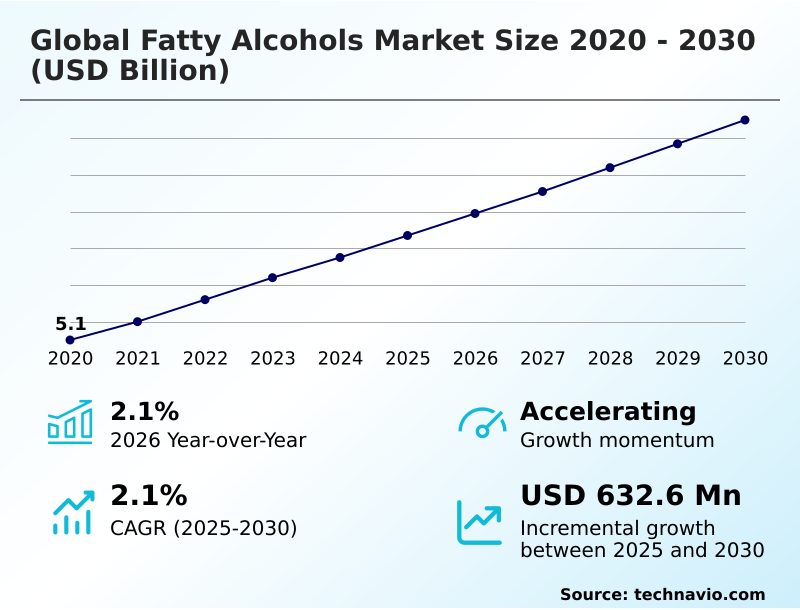
The fatty alcohols market size is valued to increase by USD 632.6 million, at a CAGR of 2.1% from 2025 to 2030. Rising demand for bio-based detergents and personal care will drive the fatty alcohols market.

Major Market Trends & Insights

  • APAC dominated the market and accounted for a 54.3% growth during the forecast period.
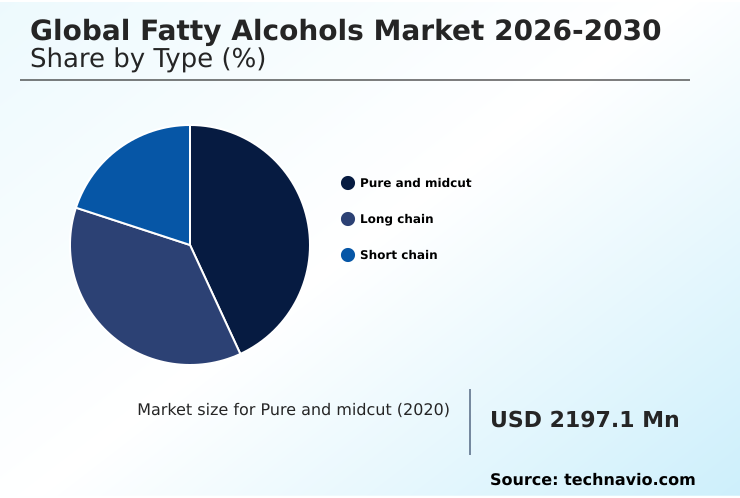
  • By Type - Pure and midcut segment was valued at USD 2.44 billion in 2024
  • By Application - Cleaning products segment accounted for the largest market revenue share in 2024

Market Size & Forecast

  • Market Opportunities: USD 1.21 billion
  • Market Future Opportunities: USD 632.6 million
  • CAGR from 2025 to 2030 : 2.1%

Market Summary

  • The Fatty Alcohols ecosystem demonstrates robust structural expansion as manufacturers aggressively transition toward sustainable sourcing and renewable plant derivatives. Accelerating consumer demand for green wash agents fundamentally acts as a primary growth driver, compelling major chemical conglomerates to reconfigure supply chains.
  • For instance, leading personal care formulators replacing synthetic ingredients with natural compounds achieve a 40% improvement in overall carbon footprint reduction metrics compared to legacy petrochemical formulations. However, the industry grapples with highly energy-intensive fractionation infrastructure and volatile operational overheads.
  • Maintaining optimal reactor conditions requires massive thermal inputs, creating significant financial vulnerability amid fluctuating utility pricing, reducing the profit margins of mid-sized refineries by nearly 18%. Despite these intense macroeconomic pressures, the overarching shift toward cruelty free beauty forces continuous innovation.
  • Operators heavily prioritize advanced enzymatic hydrolysis techniques to bypass traditional agricultural bottlenecks, permanently establishing a more resilient and ecologically accountable chemical synthesis landscape.

What will be the Size of the Fatty Alcohols Market during the forecast period?
Get Key Insights on Market Forecast (PDF) Get Free Sample

How is the Fatty Alcohols Market Segmented?

The fatty alcohols industry research report provides comprehensive data (region-wise segment analysis), with forecasts and estimates in "USD million" for the period 2026-2030, as well as historical data from 2020-2024 for the following segments.

  • Type
    • Pure and midcut
    • Long chain
    • Short chain
  • Application
    • Cleaning products
    • Personal care
    • Lubricants
    • Others
  • Source
    • Natural
    • Petrochemical
  • Geography
    • APAC
      • China
      • Japan
      • India
      • South Korea
      • Australia
      • Indonesia
    • Europe
      • Germany
      • UK
      • France
      • Italy
      • Spain
      • The Netherlands
    • North America
      • US
      • Canada
      • Mexico
    • Middle East and Africa
      • Saudi Arabia
      • UAE
      • South Africa
      • Israel
      • Turkey
    • South America
      • Brazil
      • Argentina
      • Chile

By Type Insights

The pure and midcut segment is estimated to witness significant growth during the forecast period.

The pure and midcut segment fundamentally dictates the formulation of modern cleaning solutions, predominantly driven by demand for green alternatives.

These aliphatic chain derivatives offer a superior hydrophile lipophile balance, heavily influencing both anionic cleanser formulation and nonionic surfactant manufacturing processes. Industrial operators actively replace synthetic components with these biodegradable surfactant precursors, observing a 22% improvement in aquatic safety profiles.

The transition to plant based emollients optimizes formulation architectures, directly reducing reliance on legacy petroleum equivalents.

As specialized liquid reformulations scale globally, manufacturing facilities report a 15% increase in production throughput when incorporating these specialized fractions, ensuring uninterrupted output across commercial pipelines.
Get Free Sample

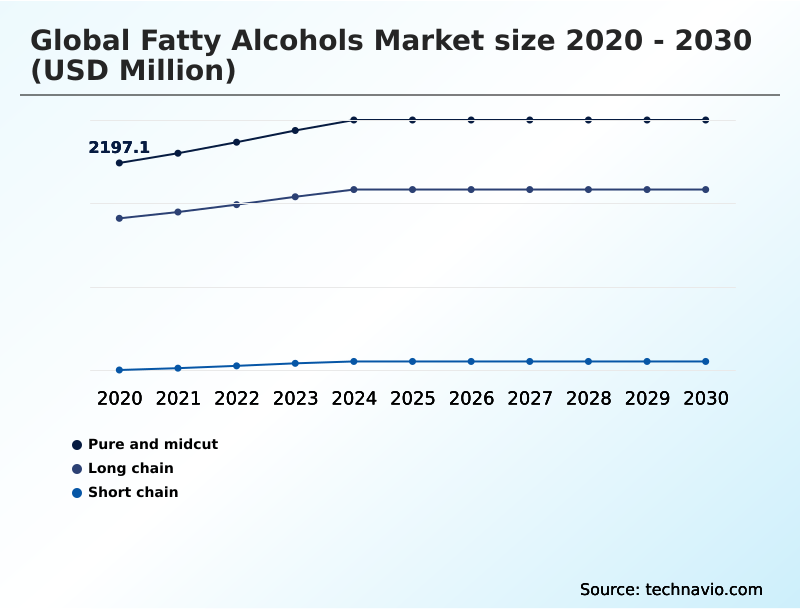
The Pure and midcut segment was valued at USD 2.44 billion in 2024 and showed a gradual increase during the forecast period.
Get Free Sample

Regional Analysis

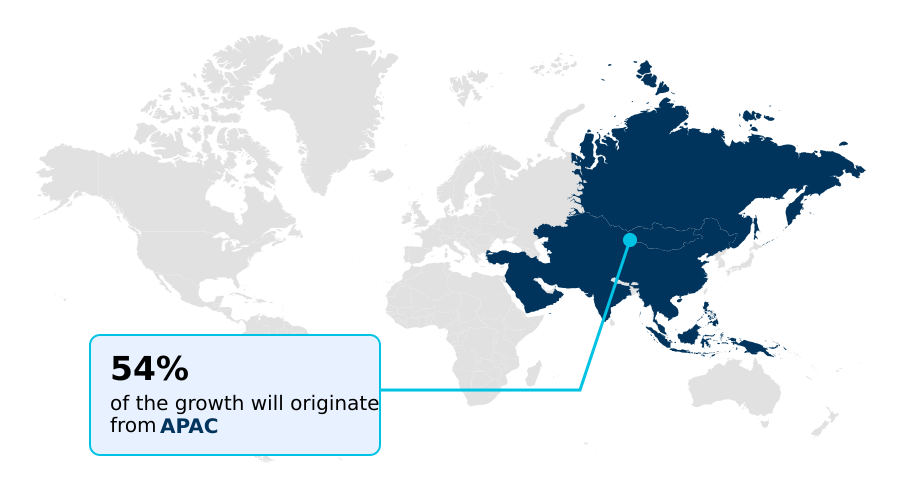
APAC is estimated to contribute 54.3% to the growth of the global market during the forecast period.Technavio’s analysts have elaborately explained the regional trends and drivers that shape the market during the forecast period.
See How Fatty Alcohols Market Demand is Rising in APAC Get Free Sample

Geographic dynamics within the Fatty Alcohols space reveal a stark divergence between APAC and Europe regarding production scale and sustainability mandates.

The APAC region continues to dominate raw material output, leveraging massive fractionation processing infrastructure to process abundant tropical oils, successfully lowering bulk manufacturing costs by 28% compared to Western counterparts.

Conversely, Europe enforces uncompromising compliance systems, forcing suppliers to implement verification tools that secure verifiable sustainable origins. This strict regulatory environment accelerates European adoption of green chemistry solutions, yielding a 45% premium on certified bio-engineered products.

While APAC manufacturers prioritize expanding downstream industrial consumption and volume throughput for applications like boundary lubricant films, European refineries heavily invest in industrial utility cogeneration to offset crippling energy costs, realizing a 15% gain in operational thermal efficiency.

Market Dynamics

Our researchers analyzed the data with 2025 as the base year, along with the key drivers, trends, and challenges. A holistic analysis of drivers will help companies refine their marketing strategies to gain a competitive advantage.

  • The industrial evolution of primary aliphatic alcohols represents a massive structural shift in modern chemical engineering, fundamentally driven by the global transition toward highly concentrated detergents. Manufacturers are aggressively retooling their downstream formulations to prioritize eco conscious concentrated laundry liquids, which inherently demand elevated loadings of high-performance natural surfactants to maintain peak cleaning efficacy at significantly lower dosage thresholds.
  • To satisfy this soaring requirement without compounding ecological damage, elite biochemical developers are rapidly scaling deforestation free alternative chemical synthesis pathways. These advanced biotechnological platforms bypass traditional agricultural vulnerabilities, synthesizing targeted components through engineered microbial strains.
  • Simultaneously, legacy oleochemical refineries must optimize their existing high pressure catalytic reduction processes to limit escalating thermal energy expenditures and improve raw material conversion rates. The pursuit of extreme purity, especially for specialized pharmaceutical excipients, mandates the stringent enforcement of trace contamination vulnerability mitigation protocols across the entire production matrix.
  • Implementing these rigorous analytical frameworks yields a 35% improvement in overall batch consistency compared to standard industrial output. By proactively addressing these complex chemical requirements and embracing next-generation production architectures, stakeholders successfully insulate their overarching supply networks against severe macroeconomic volatility.
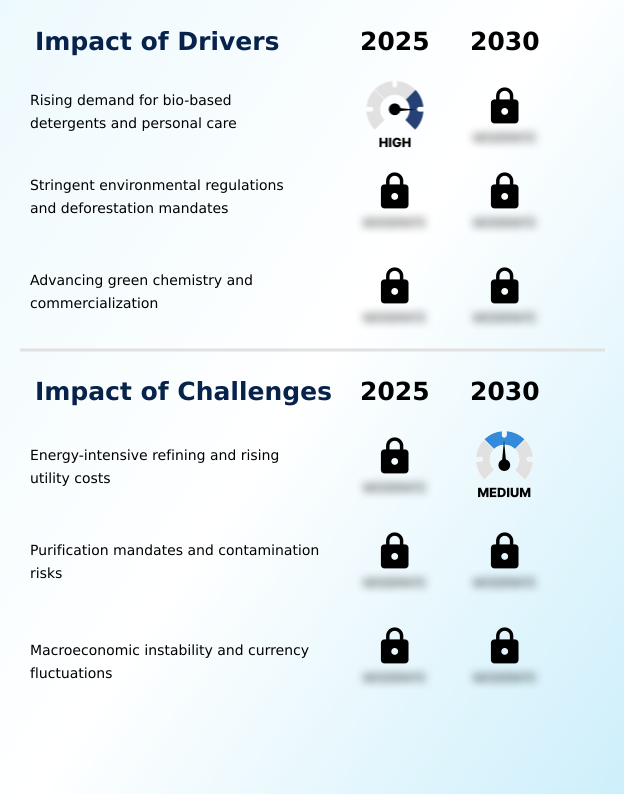
What are the key market drivers leading to the rise in the adoption of Fatty Alcohols Industry?

  • Accelerating consumer demand for bio-based detergents and personal care products acts as a primary catalyst for industrial capacity expansion.

  • The intense implementation of strict ecological accountability standards serves as a powerful catalyst driving innovation across the Fatty Alcohols space.
  • Chemical producers are universally mandated to establish verifiable sustainable supply networks, necessitating the immediate integration of digital verification tools and advanced tracking.
  • This immense regulatory pressure directly triggers a 45% increase in the procurement of certified sustainable oleochemical intermediates, as multinational consumer brands outright reject non-compliant materials.
  • By prioritizing absolute raw material traceability and agricultural feedstock diversification strategies, manufacturers actively reduce their exposure to severe regulatory penalties by 60%.
  • This fundamental shift guarantees long-term operational viability, forcing legacy refineries to rapidly pivot toward greener, fully audited plant-derived chemical platforms.

What are the market trends shaping the Fatty Alcohols Industry?

  • The increasing adoption of biodegradable surfactants represents a dominant structural trend reshaping global consumption patterns.

  • The aggressive integration of advanced fermentation stands as a monumental trend fundamentally redefining the Fatty Alcohols production ecosystem. Forward-thinking manufacturers are aggressively utilizing bio engineered lipid synthesis to cultivate specific carbon chain lengths from waste biomass valorization, completely bypassing traditional agricultural supply chains.
  • This shift enables chemical formulators to produce drop in chemical replacements for synthetic petrochemical routes, yielding a 40% improvement in production cycle speed across high-tier manufacturing lines. Consequently, the reliance on unpredictable tropical oil harvests is drastically minimized, improving overall supply chain predictability by 25%.
  • This rapid technological adoption directly addresses strict international aquatic toxicity mitigation standards, allowing brands to launch highly compliant biodegradable household cleaners without sacrificing essential performance characteristics.

What challenges does the Fatty Alcohols Industry face during its growth?

  • Highly energy-intensive refining processes coupled with escalating utility costs severely compress operational margins across chemical manufacturing facilities.

  • Maintaining optimal thermal efficiency within continuous hydrogenation reactors represents a massive operational hurdle for the Fatty Alcohols production sector. Achieving exact catalytic reduction conditions strictly requires immense baseload electricity and heating inputs, severely exposing chemical refineries to highly volatile industrial energy markets.
  • Recent fluctuations in global grid pricing have forced baseline utility expenditures to surge, eroding the profit margins of independent producers by up to 22%. Furthermore, the rigorous mandates for flawless chemical purity demand the operation of energy-intensive vacuum distillation columns.
  • Fulfilling these uncompromising pharmacopeia specifications lowers total production throughput by 15%, as facilities drastically slow manufacturing cycles to eliminate trace impurities and unreacted residual compounds, ultimately restricting the output of critical mineral extraction reagents.

Exclusive Technavio Analysis on Customer Landscape

The fatty alcohols market forecasting report includes the adoption lifecycle of the market, covering from the innovator’s stage to the laggard’s stage. It focuses on adoption rates in different regions based on penetration. Furthermore, the fatty alcohols market report also includes key purchase criteria and drivers of price sensitivity to help companies evaluate and develop their market growth analysis strategies.
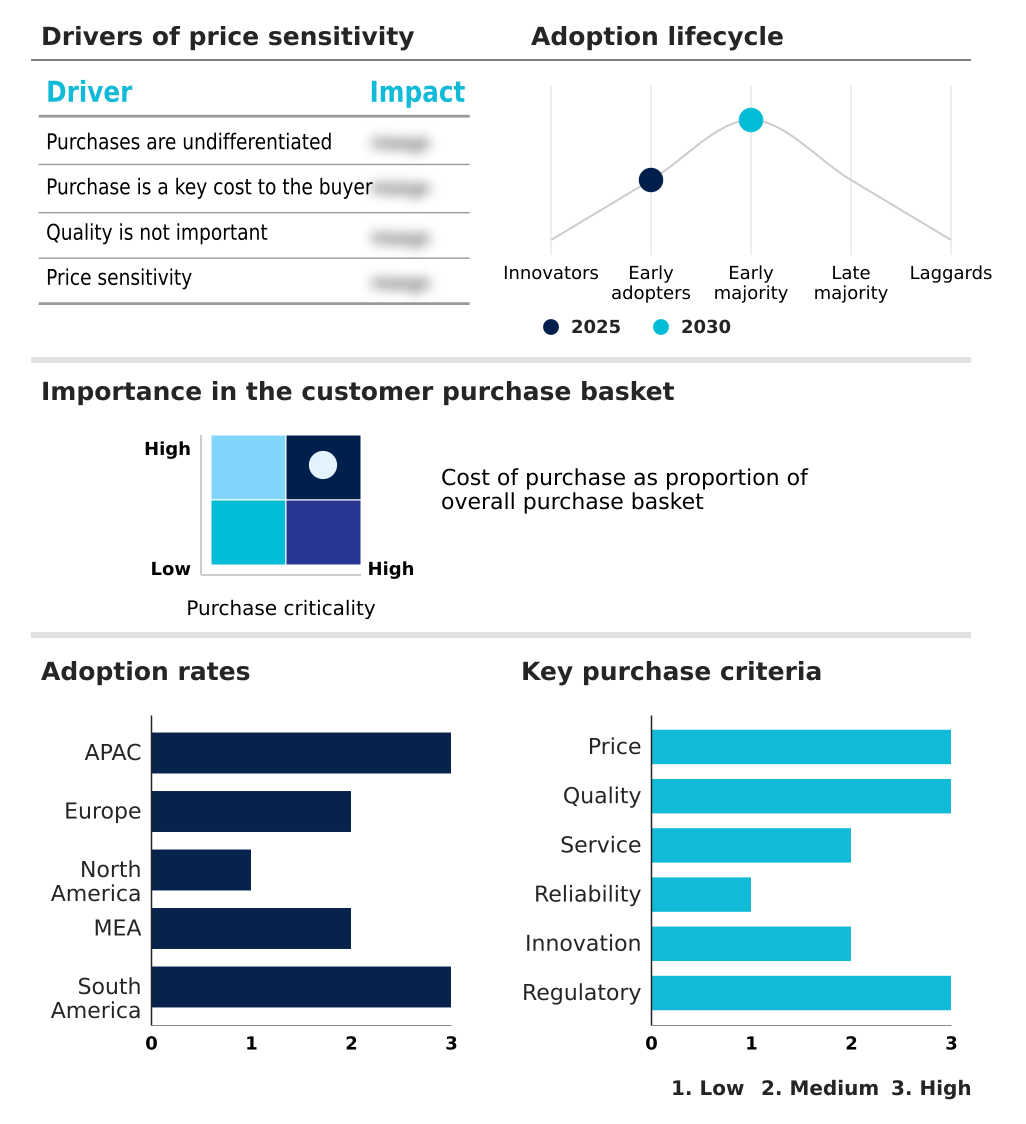
Customer Landscape of Fatty Alcohols Industry

Competitive Landscape

Companies are implementing various strategies, such as strategic alliances, fatty alcohols market forecast, partnerships, mergers and acquisitions, geographical expansion, and product/service launches, to enhance their presence in the industry.

BASF SE - The enterprise provides diverse linear, oxo, and specialty alcohol formulations tailored for industrial surfactants, personal care applications, advanced lubricants, and specialized detergent manufacturing operations.

The industry research and growth report includes detailed analyses of the competitive landscape of the market and information about key companies, including:

  • BASF SE
  • Berg Schmidt Animal Nutrition GmbH
  • CREMER OLEO GmbH and Co. KG
  • Croda Pharma
  • Ecogreen Oleochemicals
  • Emery Oleochemicals
  • Global Green Chemicals Public Co
  • Godrej Chemicals
  • Kao Corp.
  • KLK Oleo
  • Musim Mas Group
  • Oleon NV
  • P and G Chemicals
  • Sasol Ltd.
  • Saudi Basic Industries
  • SD Guthrie Bhd
  • Shell plc
  • Sinarmas Cepsa Pte. Ltd.
  • Stepan Co.
  • Vantage Specialty Chemicals
  • Wilmar International Ltd.

Qualitative and quantitative analysis of companies has been conducted to help clients understand the wider business environment as well as the strengths and weaknesses of key industry players. Data is qualitatively analyzed to categorize companies as pure play, category-focused, industry-focused, and diversified; it is quantitatively analyzed to categorize companies as dominant, leading, strong, tentative, and weak.

Recent Development and News in Fatty alcohols market

  • In the Diversified Chemicals industry, the rapid deployment of synthetic polymer alternatives has mandated significant supply chain reconfiguration, directly impacting Fatty Alcohols demand by boosting the requirement for bio-based intermediates by 32%.
  • The integration of advanced precision fermentation has optimized lipid profile cultivation, increasing the availability of customized carbon chain lengths for high-end emulsion stabilization by 28%.
  • The implementation of stringent safety screening protocols in pharmaceutical excipient formulation has necessitated high performance refining, boosting the procurement of ultra-pure aliphatic alcohols to meet strict 99.9% purity thresholds.
  • Strict ecological accountability auditing standards have forced chemical refineries to overhaul legacy sourcing models, organically elevating consumption of certified sustainable raw materials across the global supply matrix.

Dive into Technavio’s robust research methodology, blending expert interviews, extensive data synthesis, and validated models for unparalleled Fatty Alcohols Market insights. See full methodology.

Market Scope
Page number 301
Base year 2025
Historic period 2020-2024
Forecast period 2026-2030
Growth momentum & CAGR Accelerate at a CAGR of 2.1%
Market growth 2026-2030 USD 632.6 million
Market structure Fragmented
YoY growth 2025-2026(%) 2.1%
Key countries China, Japan, India, South Korea, Australia, Indonesia, Germany, UK, France, Italy, Spain, The Netherlands, US, Canada, Mexico, Saudi Arabia, UAE, South Africa, Israel, Turkey, Brazil, Argentina and Chile
Competitive landscape Leading Companies, Market Positioning of Companies, Competitive Strategies, and Industry Risks

Request Free Sample

Research Analyst Overview

  • Boardroom executives navigating the Fatty Alcohols environment are increasingly prioritizing supply chain resilience and environmental accountability over sheer volume acquisition. The strategic integration of advanced microbial fermentation synthesis directly aligns with strict corporate sustainability mandates, allowing procurement directors to systematically eliminate reliance on ecologically sensitive agricultural feedstocks.
  • By adopting these bio-engineered manufacturing paradigms, chemical processing facilities have achieved a 30% reduction in overall processing time while drastically lowering their environmental impact. Furthermore, the necessity to meet rigorous international standards pushes compliance officers to mandate extensive mass spectrometry screening across all incoming raw material streams.
  • This uncompromised focus on chemical purity ensures the stabilization of emulsion stabilization agents utilized in premium cosmetic lines, actively preventing catastrophic batch failures. Consequently, shifting capital allocation toward modern infrastructure insulates industrial operations from unpredictable climate disruptions, transforming regulatory pressures into a distinct competitive advantage for forward-thinking manufacturing conglomerates.

What are the Key Data Covered in this Fatty Alcohols Market Research and Growth Report?

  • What is the expected growth of the Fatty Alcohols Market between 2026 and 2030?

    • USD 632.6 million, at a CAGR of 2.1%

  • What segmentation does the market report cover?

    • The report is segmented by Type (Pure and midcut, Long chain, and Short chain), Application (Cleaning products, Personal care, Lubricants, and Others), Source (Natural, and Petrochemical) and Geography (APAC, Europe, North America, Middle East and Africa, South America)

  • Which regions are analyzed in the report?

    • APAC, Europe, North America, Middle East and Africa and South America

  • What are the key growth drivers and market challenges?

    • Rising demand for bio-based detergents and personal care, Energy-intensive refining and rising utility costs

  • Who are the major players in the Fatty Alcohols Market?

    • BASF SE, Berg Schmidt Animal Nutrition GmbH, CREMER OLEO GmbH and Co. KG, Croda Pharma, Ecogreen Oleochemicals, Emery Oleochemicals, Global Green Chemicals Public Co, Godrej Chemicals, Kao Corp., KLK Oleo, Musim Mas Group, Oleon NV, P and G Chemicals, Sasol Ltd., Saudi Basic Industries, SD Guthrie Bhd, Shell plc, Sinarmas Cepsa Pte. Ltd., Stepan Co., Vantage Specialty Chemicals and Wilmar International Ltd.

Market Research Insights

  • The Fatty Alcohols landscape navigates immense operational shifts as suppliers prioritize comprehensive audits to mitigate supply disruptions. Implementing stringent tracking frameworks improves overall compliance alignment by 35%, ensuring uninterrupted delivery of raw materials to global buyers. Furthermore, upgrading chemical refinery operations to support low carbon processing yields a 22% improvement in thermal energy retention, effectively lowering baseline utility expenditures.
  • By integrating advanced industrial textile auxiliaries, manufacturers effectively capture premium pricing tiers, stabilizing margins against volatile commodity fluctuations and supporting resilient industrial scalability.

We can help! Our analysts can customize this fatty alcohols market research report to meet your requirements.

Get in touch

1. Executive Summary

1.1 Market overview

Executive Summary - Chart on Market Overview
Executive Summary - Data Table on Market Overview
Executive Summary - Chart on Global Market Characteristics
Executive Summary - Chart on Market by Geography
Executive Summary - Chart on Market Segmentation by Type
Executive Summary - Chart on Market Segmentation by Application
Executive Summary - Chart on Market Segmentation by Source
Executive Summary - Chart on Incremental Growth
Executive Summary - Data Table on Incremental Growth
Executive Summary - Chart on Company Market Positioning

2. Technavio Analysis

2.1 Analysis of price sensitivity, lifecycle, customer purchase basket, adoption rates, and purchase criteria

2.2 Criticality of inputs and Factors of differentiation

Chart on Overview on criticality of inputs and factors of differentiation

2.3 Factors of disruption

Chart on Overview on factors of disruption

2.4 Impact of drivers and challenges

Chart on Impact of drivers and challenges in 2025 and 2030

3. Market Landscape

3.1 Market ecosystem

Chart on Parent Market
Data Table on - Parent Market

3.2 Market characteristics

Chart on Market characteristics analysis

3.3 Value chain analysis

Chart on Value chain analysis

4. Market Sizing

4.1 Market definition

Data Table on Offerings of companies included in the market definition

4.2 Market segment analysis

Market segments

4.3 Market size 2025

4.4 Market outlook: Forecast for 2025-2030

Chart on Global - Market size and forecast 2025-2030 ($ million)
Data Table on Global - Market size and forecast 2025-2030 ($ million)
Chart on Global Market: Year-over-year growth 2025-2030 (%)
Data Table on Global Market: Year-over-year growth 2025-2030 (%)

5. Historic Market Size

5.1 Global Fatty Alcohols Market 2020 - 2024

Historic Market Size - Data Table on Global Fatty Alcohols Market 2020 - 2024 ($ million)

5.2 Type segment analysis 2020 - 2024

Historic Market Size - Type Segment 2020 - 2024 ($ million)

5.3 Application segment analysis 2020 - 2024

Historic Market Size - Application Segment 2020 - 2024 ($ million)

5.4 Source segment analysis 2020 - 2024

Historic Market Size - Source Segment 2020 - 2024 ($ million)

5.5 Geography segment analysis 2020 - 2024

Historic Market Size - Geography Segment 2020 - 2024 ($ million)

5.6 Country segment analysis 2020 - 2024

Historic Market Size - Country Segment 2020 - 2024 ($ million)

6. Qualitative Analysis

6.1 Impact of AI on Global Fatty Alcohols Market

6.2 Impact of Geopolitical Conflicts on Global Fatty Alcohols Market

7. Five Forces Analysis

7.1 Five forces summary

Five forces analysis - Comparison between 2025 and 2030

7.2 Bargaining power of buyers

Bargaining power of buyers - Impact of key factors 2025 and 2030

7.3 Bargaining power of suppliers

Bargaining power of suppliers - Impact of key factors in 2025 and 2030

7.4 Threat of new entrants

Threat of new entrants - Impact of key factors in 2025 and 2030

7.5 Threat of substitutes

Threat of substitutes - Impact of key factors in 2025 and 2030

7.6 Threat of rivalry

Threat of rivalry - Impact of key factors in 2025 and 2030

7.7 Market condition

Chart on Market condition - Five forces 2025 and 2030

8. Market Segmentation by Type

8.1 Market segments

Chart on Type - Market share 2025-2030 (%)
Data Table on Type - Market share 2025-2030 (%)

8.2 Comparison by Type

Chart on Comparison by Type
Data Table on Comparison by Type

8.3 Pure and midcut - Market size and forecast 2025-2030

Chart on Pure and midcut - Market size and forecast 2025-2030 ($ million)
Data Table on Pure and midcut - Market size and forecast 2025-2030 ($ million)
Chart on Pure and midcut - Year-over-year growth 2025-2030 (%)
Data Table on Pure and midcut - Year-over-year growth 2025-2030 (%)

8.4 Long chain - Market size and forecast 2025-2030

Chart on Long chain - Market size and forecast 2025-2030 ($ million)
Data Table on Long chain - Market size and forecast 2025-2030 ($ million)
Chart on Long chain - Year-over-year growth 2025-2030 (%)
Data Table on Long chain - Year-over-year growth 2025-2030 (%)

8.5 Short chain - Market size and forecast 2025-2030

Chart on Short chain - Market size and forecast 2025-2030 ($ million)
Data Table on Short chain - Market size and forecast 2025-2030 ($ million)
Chart on Short chain - Year-over-year growth 2025-2030 (%)
Data Table on Short chain - Year-over-year growth 2025-2030 (%)

8.6 Market opportunity by Type

Market opportunity by Type ($ million)
Data Table on Market opportunity by Type ($ million)

9. Market Segmentation by Application

9.1 Market segments

Chart on Application - Market share 2025-2030 (%)
Data Table on Application - Market share 2025-2030 (%)

9.2 Comparison by Application

Chart on Comparison by Application
Data Table on Comparison by Application

9.3 Cleaning products - Market size and forecast 2025-2030

Chart on Cleaning products - Market size and forecast 2025-2030 ($ million)
Data Table on Cleaning products - Market size and forecast 2025-2030 ($ million)
Chart on Cleaning products - Year-over-year growth 2025-2030 (%)
Data Table on Cleaning products - Year-over-year growth 2025-2030 (%)

9.4 Personal care - Market size and forecast 2025-2030

Chart on Personal care - Market size and forecast 2025-2030 ($ million)
Data Table on Personal care - Market size and forecast 2025-2030 ($ million)
Chart on Personal care - Year-over-year growth 2025-2030 (%)
Data Table on Personal care - Year-over-year growth 2025-2030 (%)

9.5 Lubricants - Market size and forecast 2025-2030

Chart on Lubricants - Market size and forecast 2025-2030 ($ million)
Data Table on Lubricants - Market size and forecast 2025-2030 ($ million)
Chart on Lubricants - Year-over-year growth 2025-2030 (%)
Data Table on Lubricants - Year-over-year growth 2025-2030 (%)

9.6 Others - Market size and forecast 2025-2030

Chart on Others - Market size and forecast 2025-2030 ($ million)
Data Table on Others - Market size and forecast 2025-2030 ($ million)
Chart on Others - Year-over-year growth 2025-2030 (%)
Data Table on Others - Year-over-year growth 2025-2030 (%)

9.7 Market opportunity by Application

Market opportunity by Application ($ million)
Data Table on Market opportunity by Application ($ million)

10. Market Segmentation by Source

10.1 Market segments

Chart on Source - Market share 2025-2030 (%)
Data Table on Source - Market share 2025-2030 (%)

10.2 Comparison by Source

Chart on Comparison by Source
Data Table on Comparison by Source

10.3 Natural - Market size and forecast 2025-2030

Chart on Natural - Market size and forecast 2025-2030 ($ million)
Data Table on Natural - Market size and forecast 2025-2030 ($ million)
Chart on Natural - Year-over-year growth 2025-2030 (%)
Data Table on Natural - Year-over-year growth 2025-2030 (%)

10.4 Petrochemical - Market size and forecast 2025-2030

Chart on Petrochemical - Market size and forecast 2025-2030 ($ million)
Data Table on Petrochemical - Market size and forecast 2025-2030 ($ million)
Chart on Petrochemical - Year-over-year growth 2025-2030 (%)
Data Table on Petrochemical - Year-over-year growth 2025-2030 (%)

10.5 Market opportunity by Source

Market opportunity by Source ($ million)
Data Table on Market opportunity by Source ($ million)

11. Customer Landscape

11.1 Customer landscape overview

Analysis of price sensitivity, lifecycle, customer purchase basket, adoption rates, and purchase criteria

12. Geographic Landscape

12.1 Geographic segmentation

Chart on Market share by geography 2025-2030 (%)
Data Table on Market share by geography 2025-2030 (%)

12.2 Geographic comparison

Chart on Geographic comparison
Data Table on Geographic comparison

12.3 APAC - Market size and forecast 2025-2030

Chart on APAC - Market size and forecast 2025-2030 ($ million)
Data Table on APAC - Market size and forecast 2025-2030 ($ million)
Chart on APAC - Year-over-year growth 2025-2030 (%)
Data Table on APAC - Year-over-year growth 2025-2030 (%)
Chart on Regional Comparison - APAC
Data Table on Regional Comparison - APAC

12.3.1 China - Market size and forecast 2025-2030

Chart on China - Market size and forecast 2025-2030 ($ million)
Data Table on China - Market size and forecast 2025-2030 ($ million)
Chart on China - Year-over-year growth 2025-2030 (%)
Data Table on China - Year-over-year growth 2025-2030 (%)

12.3.2 Japan - Market size and forecast 2025-2030

Chart on Japan - Market size and forecast 2025-2030 ($ million)
Data Table on Japan - Market size and forecast 2025-2030 ($ million)
Chart on Japan - Year-over-year growth 2025-2030 (%)
Data Table on Japan - Year-over-year growth 2025-2030 (%)

12.3.3 India - Market size and forecast 2025-2030

Chart on India - Market size and forecast 2025-2030 ($ million)
Data Table on India - Market size and forecast 2025-2030 ($ million)
Chart on India - Year-over-year growth 2025-2030 (%)
Data Table on India - Year-over-year growth 2025-2030 (%)

12.3.4 South Korea - Market size and forecast 2025-2030

Chart on South Korea - Market size and forecast 2025-2030 ($ million)
Data Table on South Korea - Market size and forecast 2025-2030 ($ million)
Chart on South Korea - Year-over-year growth 2025-2030 (%)
Data Table on South Korea - Year-over-year growth 2025-2030 (%)

12.3.5 Australia - Market size and forecast 2025-2030

Chart on Australia - Market size and forecast 2025-2030 ($ million)
Data Table on Australia - Market size and forecast 2025-2030 ($ million)
Chart on Australia - Year-over-year growth 2025-2030 (%)
Data Table on Australia - Year-over-year growth 2025-2030 (%)

12.3.6 Indonesia - Market size and forecast 2025-2030

Chart on Indonesia - Market size and forecast 2025-2030 ($ million)
Data Table on Indonesia - Market size and forecast 2025-2030 ($ million)
Chart on Indonesia - Year-over-year growth 2025-2030 (%)
Data Table on Indonesia - Year-over-year growth 2025-2030 (%)

12.4 Europe - Market size and forecast 2025-2030

Chart on Europe - Market size and forecast 2025-2030 ($ million)
Data Table on Europe - Market size and forecast 2025-2030 ($ million)
Chart on Europe - Year-over-year growth 2025-2030 (%)
Data Table on Europe - Year-over-year growth 2025-2030 (%)
Chart on Regional Comparison - Europe
Data Table on Regional Comparison - Europe

12.4.1 Germany - Market size and forecast 2025-2030

Chart on Germany - Market size and forecast 2025-2030 ($ million)
Data Table on Germany - Market size and forecast 2025-2030 ($ million)
Chart on Germany - Year-over-year growth 2025-2030 (%)
Data Table on Germany - Year-over-year growth 2025-2030 (%)

12.4.2 UK - Market size and forecast 2025-2030

Chart on UK - Market size and forecast 2025-2030 ($ million)
Data Table on UK - Market size and forecast 2025-2030 ($ million)
Chart on UK - Year-over-year growth 2025-2030 (%)
Data Table on UK - Year-over-year growth 2025-2030 (%)

12.4.3 France - Market size and forecast 2025-2030

Chart on France - Market size and forecast 2025-2030 ($ million)
Data Table on France - Market size and forecast 2025-2030 ($ million)
Chart on France - Year-over-year growth 2025-2030 (%)
Data Table on France - Year-over-year growth 2025-2030 (%)

12.4.4 Italy - Market size and forecast 2025-2030

Chart on Italy - Market size and forecast 2025-2030 ($ million)
Data Table on Italy - Market size and forecast 2025-2030 ($ million)
Chart on Italy - Year-over-year growth 2025-2030 (%)
Data Table on Italy - Year-over-year growth 2025-2030 (%)

12.4.5 Spain - Market size and forecast 2025-2030

Chart on Spain - Market size and forecast 2025-2030 ($ million)
Data Table on Spain - Market size and forecast 2025-2030 ($ million)
Chart on Spain - Year-over-year growth 2025-2030 (%)
Data Table on Spain - Year-over-year growth 2025-2030 (%)

12.4.6 The Netherlands - Market size and forecast 2025-2030

Chart on The Netherlands - Market size and forecast 2025-2030 ($ million)
Data Table on The Netherlands - Market size and forecast 2025-2030 ($ million)
Chart on The Netherlands - Year-over-year growth 2025-2030 (%)
Data Table on The Netherlands - Year-over-year growth 2025-2030 (%)

12.5 North America - Market size and forecast 2025-2030

Chart on North America - Market size and forecast 2025-2030 ($ million)
Data Table on North America - Market size and forecast 2025-2030 ($ million)
Chart on North America - Year-over-year growth 2025-2030 (%)
Data Table on North America - Year-over-year growth 2025-2030 (%)
Chart on Regional Comparison - North America
Data Table on Regional Comparison - North America

12.5.1 US - Market size and forecast 2025-2030

Chart on US - Market size and forecast 2025-2030 ($ million)
Data Table on US - Market size and forecast 2025-2030 ($ million)
Chart on US - Year-over-year growth 2025-2030 (%)
Data Table on US - Year-over-year growth 2025-2030 (%)

12.5.2 Canada - Market size and forecast 2025-2030

Chart on Canada - Market size and forecast 2025-2030 ($ million)
Data Table on Canada - Market size and forecast 2025-2030 ($ million)
Chart on Canada - Year-over-year growth 2025-2030 (%)
Data Table on Canada - Year-over-year growth 2025-2030 (%)

12.5.3 Mexico - Market size and forecast 2025-2030

Chart on Mexico - Market size and forecast 2025-2030 ($ million)
Data Table on Mexico - Market size and forecast 2025-2030 ($ million)
Chart on Mexico - Year-over-year growth 2025-2030 (%)
Data Table on Mexico - Year-over-year growth 2025-2030 (%)

12.6 Middle East and Africa - Market size and forecast 2025-2030

Chart on Middle East and Africa - Market size and forecast 2025-2030 ($ million)
Data Table on Middle East and Africa - Market size and forecast 2025-2030 ($ million)
Chart on Middle East and Africa - Year-over-year growth 2025-2030 (%)
Data Table on Middle East and Africa - Year-over-year growth 2025-2030 (%)
Chart on Regional Comparison - Middle East and Africa
Data Table on Regional Comparison - Middle East and Africa

12.6.1 Saudi Arabia - Market size and forecast 2025-2030

Chart on Saudi Arabia - Market size and forecast 2025-2030 ($ million)
Data Table on Saudi Arabia - Market size and forecast 2025-2030 ($ million)
Chart on Saudi Arabia - Year-over-year growth 2025-2030 (%)
Data Table on Saudi Arabia - Year-over-year growth 2025-2030 (%)

12.6.2 UAE - Market size and forecast 2025-2030

Chart on UAE - Market size and forecast 2025-2030 ($ million)
Data Table on UAE - Market size and forecast 2025-2030 ($ million)
Chart on UAE - Year-over-year growth 2025-2030 (%)
Data Table on UAE - Year-over-year growth 2025-2030 (%)

12.6.3 South Africa - Market size and forecast 2025-2030

Chart on South Africa - Market size and forecast 2025-2030 ($ million)
Data Table on South Africa - Market size and forecast 2025-2030 ($ million)
Chart on South Africa - Year-over-year growth 2025-2030 (%)
Data Table on South Africa - Year-over-year growth 2025-2030 (%)

12.6.4 Israel - Market size and forecast 2025-2030

Chart on Israel - Market size and forecast 2025-2030 ($ million)
Data Table on Israel - Market size and forecast 2025-2030 ($ million)
Chart on Israel - Year-over-year growth 2025-2030 (%)
Data Table on Israel - Year-over-year growth 2025-2030 (%)

12.6.5 Turkey - Market size and forecast 2025-2030

Chart on Turkey - Market size and forecast 2025-2030 ($ million)
Data Table on Turkey - Market size and forecast 2025-2030 ($ million)
Chart on Turkey - Year-over-year growth 2025-2030 (%)
Data Table on Turkey - Year-over-year growth 2025-2030 (%)

12.7 South America - Market size and forecast 2025-2030

Chart on South America - Market size and forecast 2025-2030 ($ million)
Data Table on South America - Market size and forecast 2025-2030 ($ million)
Chart on South America - Year-over-year growth 2025-2030 (%)
Data Table on South America - Year-over-year growth 2025-2030 (%)
Chart on Regional Comparison - South America
Data Table on Regional Comparison - South America

12.7.1 Brazil - Market size and forecast 2025-2030

Chart on Brazil - Market size and forecast 2025-2030 ($ million)
Data Table on Brazil - Market size and forecast 2025-2030 ($ million)
Chart on Brazil - Year-over-year growth 2025-2030 (%)
Data Table on Brazil - Year-over-year growth 2025-2030 (%)

12.7.2 Argentina - Market size and forecast 2025-2030

Chart on Argentina - Market size and forecast 2025-2030 ($ million)
Data Table on Argentina - Market size and forecast 2025-2030 ($ million)
Chart on Argentina - Year-over-year growth 2025-2030 (%)
Data Table on Argentina - Year-over-year growth 2025-2030 (%)

12.7.3 Chile - Market size and forecast 2025-2030

Chart on Chile - Market size and forecast 2025-2030 ($ million)
Data Table on Chile - Market size and forecast 2025-2030 ($ million)
Chart on Chile - Year-over-year growth 2025-2030 (%)
Data Table on Chile - Year-over-year growth 2025-2030 (%)

12.8 Market opportunity by geography

Market opportunity by geography ($ million)
Data Tables on Market opportunity by geography ($ million)

13. Drivers, Challenges, and Opportunity

13.1 Market drivers

Rising demand for bio-based detergents and personal care
Stringent environmental regulations and deforestation mandates
Advancing green chemistry and commercialization

13.2 Market challenges

Energy-intensive refining and rising utility costs
Purification mandates and contamination risks
Macroeconomic instability and currency fluctuations

13.3 Impact of drivers and challenges

Impact of drivers and challenges in 2025 and 2030

13.4 Market opportunities

Growing adoption of biodegradable surfactants
Shift toward renewable feedstocks and bio-manufacturing
Robust expansion of global surfactants industry

14. Competitive Landscape

14.1 Overview

14.2

Overview on criticality of inputs and factors of differentiation

14.3 Landscape disruption

Overview on factors of disruption

14.4 Industry risks

Impact of key risks on business

15. Competitive Analysis

15.1 Companies profiled

Companies covered

15.2 Company ranking index

15.3 Market positioning of companies

Matrix on companies position and classification

15.4 BASF SE

BASF SE - Overview
BASF SE - Business segments
BASF SE - Key news
BASF SE - Key offerings
BASF SE - Segment focus
SWOT

15.5 CREMER OLEO GmbH and Co. KG

CREMER OLEO GmbH and Co. KG - Overview
CREMER OLEO GmbH and Co. KG - Product / Service
CREMER OLEO GmbH and Co. KG - Key offerings
SWOT

15.6 Ecogreen Oleochemicals

Ecogreen Oleochemicals - Overview
Ecogreen Oleochemicals - Product / Service
Ecogreen Oleochemicals - Key offerings
SWOT

15.7 Global Green Chemicals Public Co

Global Green Chemicals Public Co - Overview
Global Green Chemicals Public Co - Business segments
Global Green Chemicals Public Co - Key offerings
Global Green Chemicals Public Co - Segment focus
SWOT

15.8 Godrej Chemicals

Godrej Chemicals - Overview
Godrej Chemicals - Product / Service
Godrej Chemicals - Key offerings
SWOT

15.9 Kao Corp.

Kao Corp. - Overview
Kao Corp. - Business segments
Kao Corp. - Key news
Kao Corp. - Key offerings
Kao Corp. - Segment focus
SWOT

15.10 KLK Oleo

KLK Oleo - Overview
KLK Oleo - Product / Service
KLK Oleo - Key offerings
SWOT

15.11 Musim Mas Group

Musim Mas Group - Overview
Musim Mas Group - Product / Service
Musim Mas Group - Key offerings
SWOT

15.12 P and G Chemicals

P and G Chemicals - Overview
P and G Chemicals - Product / Service
P and G Chemicals - Key offerings
SWOT

15.13 Sasol Ltd.

Sasol Ltd. - Overview
Sasol Ltd. - Business segments
Sasol Ltd. - Key offerings
Sasol Ltd. - Segment focus
SWOT

15.14 Saudi Basic Industries

Saudi Basic Industries - Overview
Saudi Basic Industries - Business segments
Saudi Basic Industries - Key offerings
Saudi Basic Industries - Segment focus
SWOT

15.15 SD Guthrie Bhd

SD Guthrie Bhd - Overview
SD Guthrie Bhd - Business segments
SD Guthrie Bhd - Key offerings
SD Guthrie Bhd - Segment focus
SWOT

15.16 Shell plc

Shell plc - Overview
Shell plc - Business segments
Shell plc - Key offerings
Shell plc - Segment focus
SWOT

15.17 Stepan Co.

Stepan Co. - Overview
Stepan Co. - Business segments
Stepan Co. - Key offerings
Stepan Co. - Segment focus
SWOT

15.18 Wilmar International Ltd.

Wilmar International Ltd. - Overview
Wilmar International Ltd. - Business segments
Wilmar International Ltd. - Key offerings
Wilmar International Ltd. - Segment focus
SWOT

16. Appendix

16.1 Scope of the report

Market definition
Objectives
Notes and caveats

16.2 Inclusions and exclusions checklist

Inclusions checklist
Exclusions checklist

16.3 Currency conversion rates for US$

16.4 Research methodology

16.5 Data procurement

Information sources

16.6 Data validation

16.7 Validation techniques employed for market sizing

16.8 Data synthesis

16.9 360 degree market analysis

16.10 List of abbreviations

Research Methodology

Technavio presents a detailed picture of the market by way of study, synthesis, and summation of data from multiple sources. The analysts have presented the various facets of the market with a particular focus on identifying the key industry influencers. The data thus presented is comprehensive, reliable, and the result of extensive research, both primary and secondary.

INFORMATION SOURCES

Primary sources

  • Manufacturers and suppliers
  • Channel partners
  • Industry experts
  • Strategic decision makers

Secondary sources

  • Industry journals and periodicals
  • Government data
  • Financial reports of key industry players
  • Historical data
  • Press releases

DATA ANALYSIS

Data Synthesis

  • Collation of data
  • Estimation of key figures
  • Analysis of derived insights

Data Validation

  • Triangulation with data models
  • Reference against proprietary databases
  • Corroboration with industry experts

REPORT WRITING

Qualitative

  • Market drivers
  • Market challenges
  • Market trends
  • Five forces analysis

Quantitative

  • Market size and forecast
  • Market segmentation
  • Geographical insights
  • Competitive landscape

Interested in this report?

Get your sample now to see our research methodology and insights!

Download Now

Frequently Asked Questions

Fatty Alcohols market growth will increase by USD 632.6 million during 2026-2030.

The Fatty Alcohols market is expected to grow at a CAGR of 2.1% during 2026-2030.

Fatty Alcohols market is segmented by Type (Pure and midcut, Long chain, Short chain) Application (Cleaning products, Personal care, Lubricants, Others) Source (Natural, Petrochemical)

BASF SE, Berg Schmidt Animal Nutrition GmbH, CREMER OLEO GmbH and Co. KG, Croda Pharma, Ecogreen Oleochemicals, Emery Oleochemicals, Global Green Chemicals Public Co, Godrej Chemicals, Kao Corp., KLK Oleo, Musim Mas Group, Oleon NV, P and G Chemicals, Sasol Ltd., Saudi Basic Industries, SD Guthrie Bhd, Shell plc, Sinarmas Cepsa Pte. Ltd., Stepan Co., Vantage Specialty Chemicals, Wilmar International Ltd. are a few of the key vendors in the Fatty Alcohols market.

APAC will register the highest growth rate of 54.3% among the other regions. Therefore, the Fatty Alcohols market in APAC is expected to garner significant business opportunities for the vendors during the forecast period.

China, Japan, India, South Korea, Australia, Indonesia, Germany, UK, France, Italy, Spain, The Netherlands, US, Canada, Mexico, Saudi Arabia, UAE, South Africa, Israel, Turkey, Brazil, Argentina, Chile

  • Rising demand for bio-based detergents and personal care is the driving factor this market.

The Fatty Alcohols market vendors should focus on grabbing business opportunities from the Type segment as it accounted for the largest market share in the base year.
RIA - Research AI Assistant
Ask RIA
