Ferroalloys Market Analysis, Size, and Forecast 2026-2030: APAC (China, India, and Japan), Europe (Germany, France, and Italy), North America (US, Canada, and Mexico), Middle East and Africa (South Africa, Saudi Arabia, and UAE), South America (Brazil, Argentina, and Colombia), and Rest of World (ROW)

Ferroalloys Market Analysis, Size, and Forecast 2026-2030:
APAC (China, India, and Japan), Europe (Germany, France, and Italy), North America (US, Canada, and Mexico), Middle East and Africa (South Africa, Saudi Arabia, and UAE), South America (Brazil, Argentina, and Colombia), and Rest of World (ROW)

Published: Oct 2026 307 Pages SKU: IRTNTR81696

Market Overview at a Glance

$19.29 B
Market Opportunity
5.6%
CAGR 2025 - 2030
58.6%
APAC Growth
$19.44 B
Ferrochrome segment 2024

Ferroalloys Market Size 2026-2030

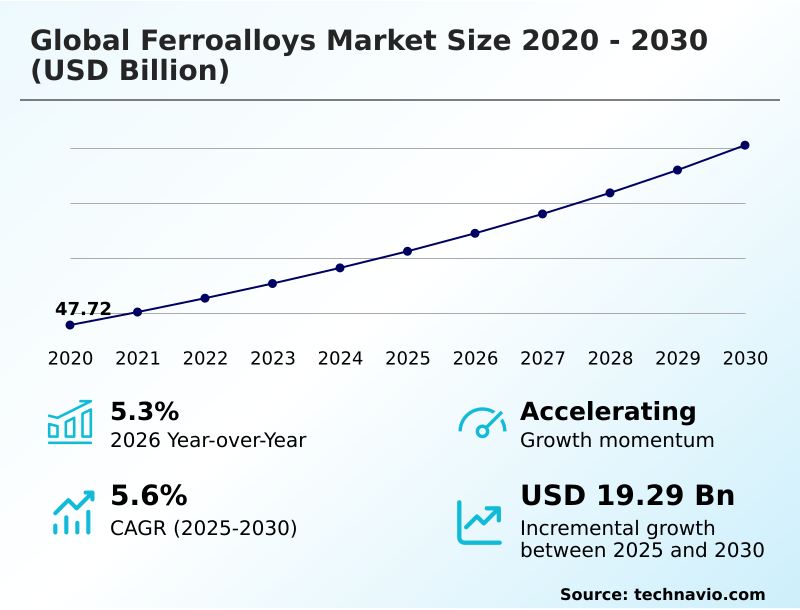
The ferroalloys market size is valued to increase by USD 19.29 billion, at a CAGR of 5.6% from 2025 to 2030. Rapid infrastructure development and urbanization in emerging economies will drive the ferroalloys market.

Major Market Trends & Insights

  • APAC dominated the market and accounted for a 58.6% growth during the forecast period.
  • By Type - Ferrochrome segment was valued at USD 19.44 billion in 2024
  • By Technology - Electric arc furnace segment accounted for the largest market revenue share in 2024

Market Size & Forecast

  • Market Opportunities: USD 32.71 billion
  • Market Future Opportunities: USD 19.29 billion
  • CAGR from 2025 to 2030 : 5.6%

Market Summary

  • The Ferroalloys Market demonstrates continuous expansion driven by the critical need for metallurgical additives in heavy industrial manufacturing. As primary deoxidizing agent components, these materials fundamentally alter the chemical composition of molten metal to enhance tensile strength and durability. In modern automotive manufacturing, the transition toward lightweighting requires specific high-strength low-alloy steel formulations.
  • By incorporating precise ratios of ferrovanadium, engineers reduce total vehicle frame mass by up to 22% without compromising structural integrity. This transition acts as a primary market driver, compelling producers to refine their operations to meet precise material specifications.
  • Conversely, stringent emission trading schemes present a severe structural challenge, forcing smelters to implement costly hydrogen-based reduction methods to maintain regulatory compliance. Facilities that fail to upgrade legacy equipment often experience compliance-related downtimes and severe profit margin erosion. The integration of real-time thermal management ensures that operations optimize power usage, stabilizing supply chains against geopolitical raw material concentration.

What will be the Size of the Ferroalloys Market during the forecast period?
Get Key Insights on Market Forecast (PDF) Get Free Sample

How is the Ferroalloys Market Segmented?

The ferroalloys industry research report provides comprehensive data (region-wise segment analysis), with forecasts and estimates in "USD million" for the period 2026-2030, as well as historical data from 2020-2024 for the following segments.

  • Type
    • Ferrochrome
    • Ferromanganese
    • Ferrosilicon
    • Ferronickel
    • Others
  • Technology
    • Electric arc furnace
    • Blast furnace
  • Application
    • Steel manufacturing
    • Cast iron
    • Others
  • Geography
    • APAC
      • China
      • India
      • Japan
      • South Korea
      • Indonesia
      • Vietnam
    • Europe
      • Germany
      • France
      • Italy
      • Norway
      • Finland
    • North America
      • US
      • Canada
      • Mexico
    • Middle East and Africa
      • South Africa
      • Saudi Arabia
      • UAE
      • Oman
    • South America
      • Brazil
      • Argentina
      • Colombia

By Type Insights

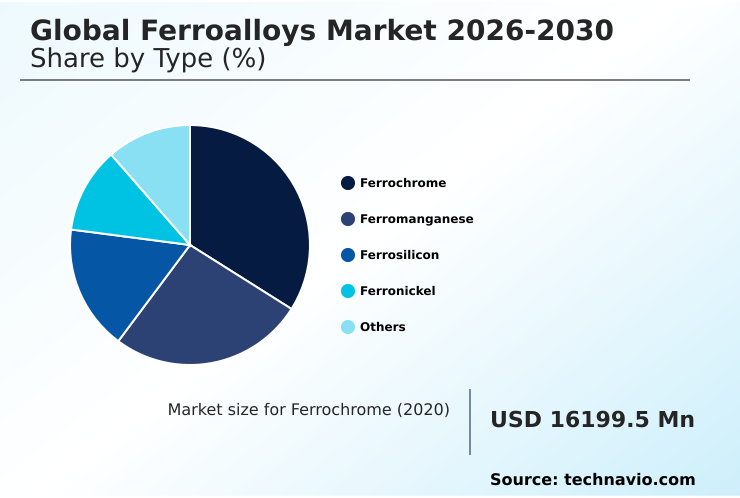
The ferrochrome segment is estimated to witness significant growth during the forecast period.

The ferrochrome segment serves as a foundational component within the metallurgical sector, primarily functioning as a critical alloying additive for corrosion-resistant alloys and advanced steel manufacturing.

Processing operations rely heavily on the continuous optimization of the submerged arc furnace to convert raw chromite ore into high-grade alloy materials.

Advanced facilities now utilize digital twin platform architectures to monitor furnace sensor data, resulting in a 14% improvement in thermal efficiency and a corresponding decrease in energy waste.

This technological integration directly enhances the yield of low-carbon ferrochrome, meeting the strict specifications required by modern aerospace structural components.

The continuous refinement of the electrode positioning algorithm further minimizes operational downtime, allowing processing plants to maintain consistent output volumes and support the demanding performance criteria of industrial applications.
Get Free Sample

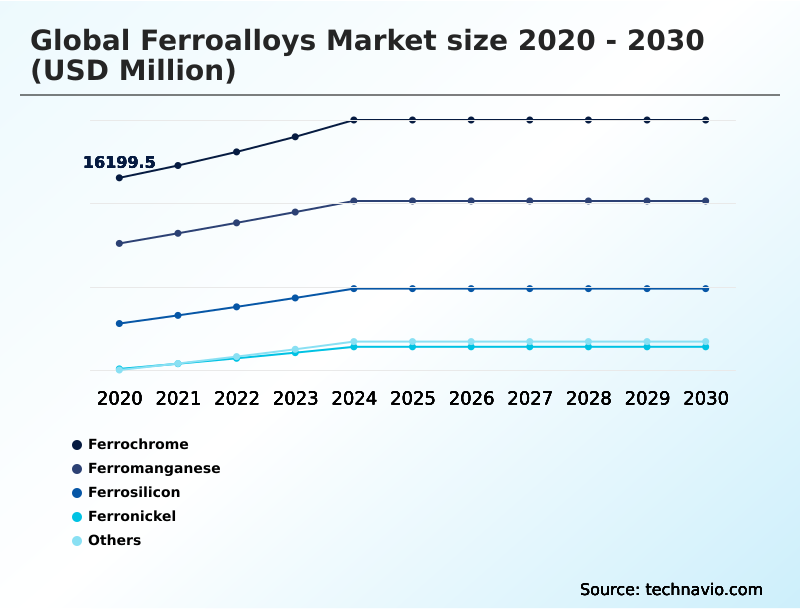
The Ferrochrome segment was valued at USD 19.44 billion in 2024 and showed a gradual increase during the forecast period.
Get Free Sample

Regional Analysis

APAC is estimated to contribute 58.6% to the growth of the global market during the forecast period.Technavio’s analysts have elaborately explained the regional trends and drivers that shape the market during the forecast period.
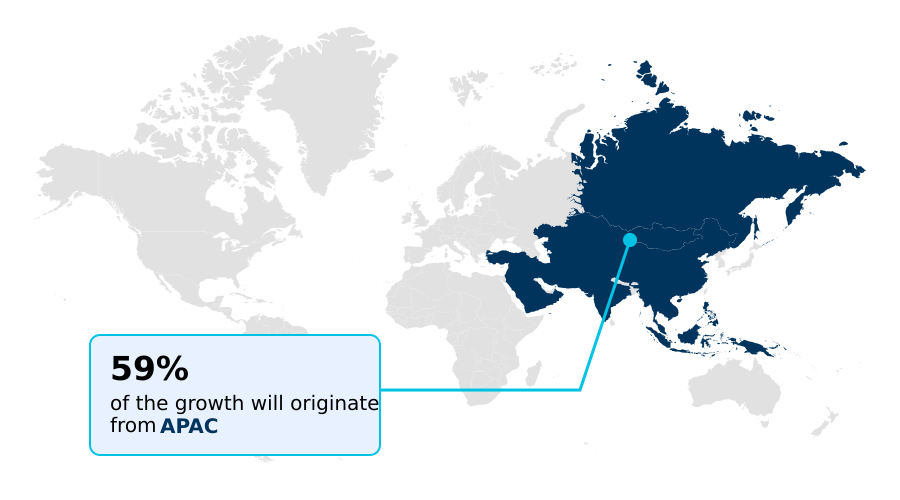
See How Ferroalloys Market Demand is Rising in APAC Get Free Sample

The geographic distribution of the Ferroalloys sector highlights a stark operational contrast between the infrastructure urbanization demand in APAC and the regulatory-driven environment in Europe.

Facilities in APAC process massive volumes of silicomanganese production to support aggressive building initiatives, achieving an 18% higher daily throughput compared to European counterparts.

Conversely, European smelters prioritize compliance with strict emission trading schemes, utilizing green hydrogen smelting and renewable energy infrastructure to lower their operational carbon footprint by up to 25%.

This divergence forces businesses in Europe to absorb higher initial capital expenditures to maintain market access under new environmental frameworks. Meanwhile, producers in APAC leverage economies of scale and localized raw material access to mitigate power grid load restructuring costs.

Consequently, the adoption of centrifugal separation technology for secondary metal recovery is accelerating 12% faster in Europe to offset the geopolitical raw material concentration risks associated with imported ores.

Market Dynamics

Our researchers analyzed the data with 2025 as the base year, along with the key drivers, trends, and challenges. A holistic analysis of drivers will help companies refine their marketing strategies to gain a competitive advantage.

  • The optimization of metallurgical processes requires a continuous commitment to precision engineering and sustainable material sourcing. As heavy manufacturing sectors prioritize environmental compliance, the deployment of electric arc furnace emission control systems has become a mandatory operational standard, successfully reducing airborne particulate discharge by over 28% compared to legacy blast furnace configurations.
  • This transition fundamentally supports the growing reliance on scrap steel secondary alloy recovery, which allows facilities to reclaim valuable elements from industrial waste streams and significantly lower the energy intensity of their operations.
  • To meet the stringent performance metrics of modern transportation, manufacturers are refining their high strength low alloy formulation processes, integrating precise ratios of noble metals to achieve optimal tensile properties.
  • Furthermore, the integration of digital analytics enables submerged arc furnace thermal optimization, allowing operators to monitor heat distribution in real-time and decrease power consumption by nearly 15% during peak load periods.
  • These efficiency gains are especially critical in the automotive sector, where an advanced automotive chassis lightweighting steel composition is required to improve fuel economy and vehicle range without sacrificing passenger safety.
  • By leveraging these sophisticated formulations and recovery mechanisms, supply chains achieve greater resilience against raw material volatility while ensuring that final products meet the exacting mechanical tolerances demanded by global industrial consumers.
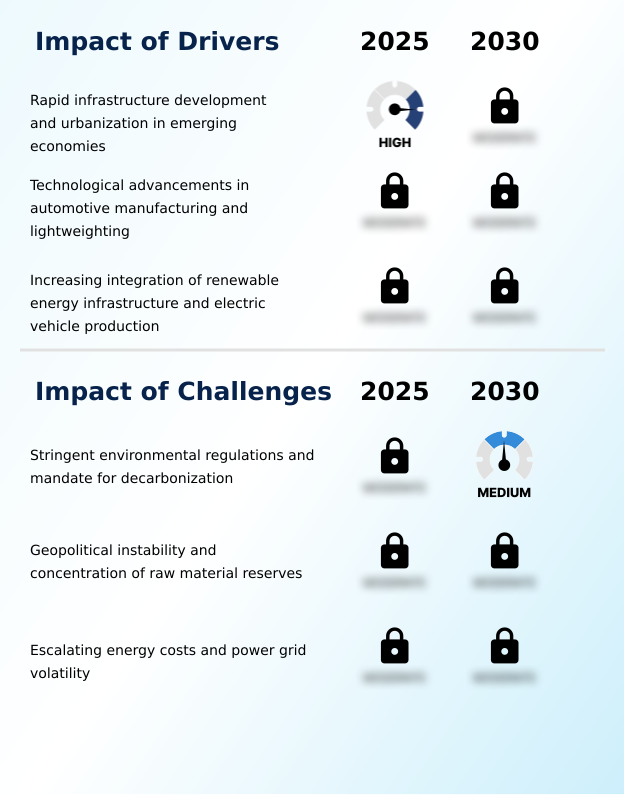
What are the key market drivers leading to the rise in the adoption of Ferroalloys Industry?

  • Rapid infrastructure development and widespread urbanization across emerging economies function as the primary drivers propelling the sustained consumption of high-strength structural materials.

  • The aggressive expansion of renewable energy networks serves as a dominant catalyst driving the demand for specialized metallurgical formulations within the Ferroalloys sector.
  • The construction of massive offshore installations requires vast quantities of corrosion-resistant alloys, triggering a 22% increase in the localized consumption of refined chromium additives.
  • Furthermore, the transition toward electrified transport necessitates superior magnetic properties in electrical steel, prompting manufacturers to utilize high-grade deoxidizing agent and precise grain refiner materials to reduce energy transmission losses by nearly 12%.
  • This functional requirement directly accelerates the deployment of rotary kiln-electric furnace technologies capable of executing continuous ferromanganese smelting with maximum thermal efficiency.
  • By securing a reliable flow of these critical inputs, industrial producers can successfully execute large-scale infrastructure projects while maintaining the mechanical integrity required for long-term sustainable power generation.

What are the market trends shaping the Ferroalloys Industry?

  • The implementation of circular economy frameworks and the enhancement of secondary recovery processes represent a defining trend reshaping material supply chains. These strategic shifts toward advanced recycling prioritize resource efficiency and minimize the environmental footprint of high-temperature metallurgical operations.

  • The widespread integration of automated diagnostic systems and secondary recovery protocols represents a definitive operational trend within the Ferroalloys ecosystem. To combat rising energy costs, manufacturers are deploying laser-induced breakdown spectroscopy for the precise sorting of metallic scrap, improving the reclamation efficiency of valuable elements by up to 24%.
  • This shift toward circular material usage directly reduces the dependency on carbonaceous reductant inputs, subsequently lowering specific greenhouse gas emissions by 18% per metric ton of output. The adoption of centrifugal separation technology further enhances the extraction of noble alloys from complex industrial waste streams. Consequently, processing facilities can generate premium additive manufacturing flux materials with exceptional purity.
  • Businesses leveraging these advanced recovery frameworks achieve greater supply chain resilience while simultaneously satisfying stringent environmental compliance mandates across global operating hubs.

What challenges does the Ferroalloys Industry face during its growth?

  • Stringent environmental regulations and escalating mandates for industrial decarbonization constitute a formidable challenge, requiring massive capital investments in clean-energy smelting technologies.

  • Extreme volatility in global energy markets and escalating carbon compliance mandates impose severe operational constraints on the Ferroalloys sector. The energy-intensive nature of silicomanganese production renders facilities highly susceptible to grid instability, where sudden power tariff hikes can inflate total manufacturing expenses by over 25%.
  • Furthermore, the strict enforcement of new environmental policies limits the traditional use of metallurgical coke, forcing companies to retrofit legacy infrastructure with expensive alternative reduction technologies. This capital-intensive transition often delays the processing of saprolite nickel ore and specialized desulfurizing addition materials, resulting in a 14% reduction in quarterly output across major refining hubs.
  • Consequently, the reliance on nickel pig iron as a low-cost substitute is hindered, severely challenging the ability of producers to maintain competitive pricing margins while satisfying international decarbonization standards.

Exclusive Technavio Analysis on Customer Landscape

The ferroalloys market forecasting report includes the adoption lifecycle of the market, covering from the innovator’s stage to the laggard’s stage. It focuses on adoption rates in different regions based on penetration. Furthermore, the ferroalloys market report also includes key purchase criteria and drivers of price sensitivity to help companies evaluate and develop their market growth analysis strategies.
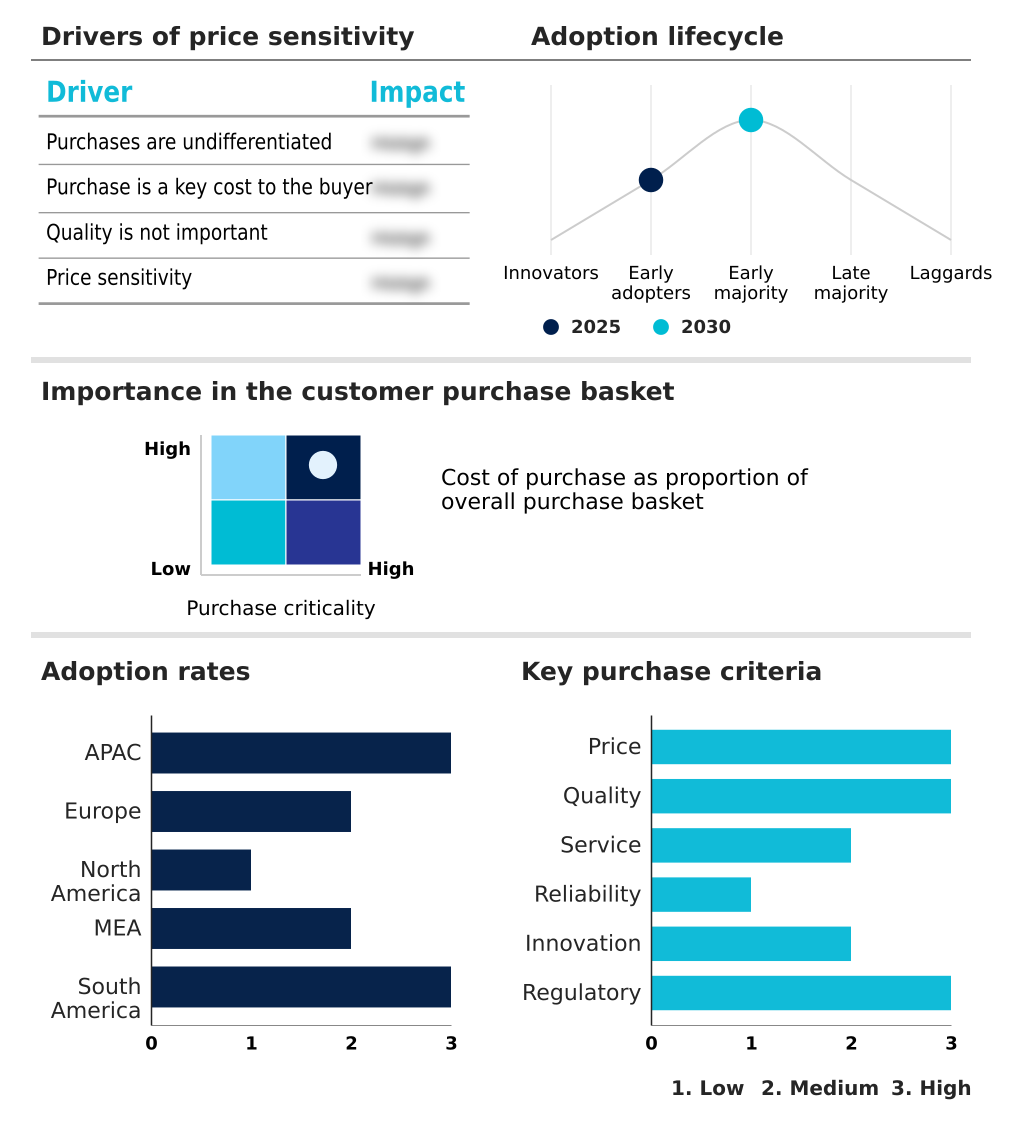
Customer Landscape of Ferroalloys Industry

Competitive Landscape

Companies are implementing various strategies, such as strategic alliances, ferroalloys market forecast, partnerships, mergers and acquisitions, geographical expansion, and product/service launches, to enhance their presence in the industry.

Afarak Group SE - Core solutions encompass the production and distribution of specialized ferrochrome and charge chrome formulations, designed strictly to enhance the durability and thermal resistance of advanced metallurgical applications.

The industry research and growth report includes detailed analyses of the competitive landscape of the market and information about key companies, including:

  • Afarak Group SE
  • AMG Advanced Metallurgical
  • ArcelorMittal S.A.
  • Assore Ltd.
  • China Minmetals Corp.
  • Elkem ASA
  • Eramet SA
  • Ferroglobe Plc
  • Glencore Plc
  • Gulf Ferro Alloys Co.
  • Jindal Steel Ltd.
  • Maithan Alloys Ltd.
  • Nava Ltd.
  • OM Holdings Ltd.
  • Outokumpu Oyj
  • Samancor Chrome
  • South32 Ltd.
  • Tata Steel Ltd.
  • Tsingshan Holding Group
  • Yildirim Group

Qualitative and quantitative analysis of companies has been conducted to help clients understand the wider business environment as well as the strengths and weaknesses of key industry players. Data is qualitatively analyzed to categorize companies as pure play, category-focused, industry-focused, and diversified; it is quantitatively analyzed to categorize companies as dominant, leading, strong, tentative, and weak.

Recent Development and News in Ferroalloys market

  • In the Steel industry, the rapid expansion of offshore wind turbine towers has mandated the use of advanced structural materials, directly impacting Ferroalloys demand by increasing the required volumes of specialized chromium inputs by up to 18% per project.
  • The accelerating automotive lightweighting transition has forced manufacturers to adopt advanced material configurations, driving the localized consumption of precision alloy formulations to achieve a 20% reduction in vehicle chassis weight across major assembly hubs.
  • Stringent enforcement of carbon border adjustment taxes has accelerated the deployment of green hydrogen smelting technologies across primary metal production hubs, restructuring the Ferroalloys supply chain by favoring suppliers capable of delivering a 30% reduction in embedded carbon.
  • Implementation of a comprehensive circular economy framework has incentivized the widespread adoption of industrial waste stream reclamation systems, effectively substituting 15% of virgin alloy requirements with high-grade secondary metal recovery from processed industrial scrap.

Dive into Technavio’s robust research methodology, blending expert interviews, extensive data synthesis, and validated models for unparalleled Ferroalloys Market insights. See full methodology.

Market Scope
Page number 307
Base year 2025
Historic period 2020-2024
Forecast period 2026-2030
Growth momentum & CAGR Accelerate at a CAGR of 5.6%
Market growth 2026-2030 USD 19291.1 million
Market structure Fragmented
YoY growth 2025-2026(%) 5.3%
Key countries China, India, Japan, South Korea, Indonesia, Vietnam, Germany, France, Italy, Russia, Norway, Finland, US, Canada, Mexico, South Africa, Iran, Saudi Arabia, UAE, Oman, Brazil, Argentina and Colombia
Competitive landscape Leading Companies, Market Positioning of Companies, Competitive Strategies, and Industry Risks

Request Free Sample

Research Analyst Overview

  • The Ferroalloys sector is undergoing a profound structural evolution characterized by the rapid adoption of digital intelligence and sustainable processing frameworks. Boardroom executives are increasingly prioritizing investments in digital twin platform architectures to optimize submerged arc furnace operations, directly influencing corporate budgeting and long-term compliance strategies.
  • By implementing advanced electrode positioning algorithm systems, facilities have successfully reduced unplanned operational downtime by up to 17% compared to traditional manual oversight models. This technological integration is crucial for the efficient generation of low-carbon ferrochrome and other high-purity specialty alloys utilized in critical engineering sectors.
  • Furthermore, the strategic shift toward utilizing hydrogen-based reduction methods mitigates the financial risks associated with incoming carbon taxation, ensuring that products remain viable in highly regulated markets. Operators are also deploying x-ray fluorescence sorting mechanisms to enhance the precision of material recovery, driving a more resilient closed-loop supply chain.
  • Ultimately, the ability to control slag generation mitigation empowers industry leaders to maintain strict quality control while safeguarding their operational margins against volatile energy constraints.

What are the Key Data Covered in this Ferroalloys Market Research and Growth Report?

  • What is the expected growth of the Ferroalloys Market between 2026 and 2030?

    • USD 19.29 billion, at a CAGR of 5.6%

  • What segmentation does the market report cover?

    • The report is segmented by Type (Ferrochrome, Ferromanganese, Ferrosilicon, Ferronickel, and Others), Technology (Electric arc furnace, and Blast furnace), Application (Steel manufacturing, Cast iron, and Others) and Geography (APAC, Europe, North America, Middle East and Africa, South America)

  • Which regions are analyzed in the report?

    • APAC, Europe, North America, Middle East and Africa and South America

  • What are the key growth drivers and market challenges?

    • Rapid infrastructure development and urbanization in emerging economies, Stringent environmental regulations and mandate for decarbonization

  • Who are the major players in the Ferroalloys Market?

    • Afarak Group SE, AMG Advanced Metallurgical, ArcelorMittal S.A., Assore Ltd., China Minmetals Corp., Elkem ASA, Eramet SA, Ferroglobe Plc, Glencore Plc, Gulf Ferro Alloys Co., Jindal Steel Ltd., Maithan Alloys Ltd., Nava Ltd., OM Holdings Ltd., Outokumpu Oyj, Samancor Chrome, South32 Ltd., Tata Steel Ltd., Tsingshan Holding Group and Yildirim Group

Market Research Insights

  • The Ferroalloys sector operates as a critical enabler for advanced industrial manufacturing and widespread infrastructure urbanization demand. Processing facilities are rapidly transitioning toward decarbonized power grids, utilizing advanced sensor networks to increase energy efficiency by up to 18% during peak smelting cycles.
  • This modernization directly supports the production of critical components, where the integration of high-purity inputs reduces material failure rates by 22%. Furthermore, the adoption of automated off-peak production scheduling allows plant operators to navigate energy volatility, successfully lowering overall electricity expenditures by nearly 15%.
  • As environmental regulations tighten, the reliance on secondary reclamation provides a vital buffer, stabilizing supply networks and ensuring consistent output for high-performance metallurgical applications.

We can help! Our analysts can customize this ferroalloys market research report to meet your requirements.

Get in touch

1. Executive Summary

1.1 Market overview

Executive Summary - Chart on Market Overview
Executive Summary - Data Table on Market Overview
Executive Summary - Chart on Global Market Characteristics
Executive Summary - Chart on Market by Geography
Executive Summary - Chart on Market Segmentation by Type
Executive Summary - Chart on Market Segmentation by Technology
Executive Summary - Chart on Market Segmentation by Application
Executive Summary - Chart on Incremental Growth
Executive Summary - Data Table on Incremental Growth
Executive Summary - Chart on Company Market Positioning

2. Technavio Analysis

2.1 Analysis of price sensitivity, lifecycle, customer purchase basket, adoption rates, and purchase criteria

2.2 Criticality of inputs and Factors of differentiation

Chart on Overview on criticality of inputs and factors of differentiation

2.3 Factors of disruption

Chart on Overview on factors of disruption

2.4 Impact of drivers and challenges

Chart on Impact of drivers and challenges in 2025 and 2030

3. Market Landscape

3.1 Market ecosystem

Chart on Parent Market
Data Table on - Parent Market

3.2 Market characteristics

Chart on Market characteristics analysis

3.3 Value chain analysis

Chart on Value chain analysis

4. Market Sizing

4.1 Market definition

Data Table on Offerings of companies included in the market definition

4.2 Market segment analysis

Market segments

4.3 Market size 2025

4.4 Market outlook: Forecast for 2025-2030

Chart on Global - Market size and forecast 2025-2030 ($ million)
Data Table on Global - Market size and forecast 2025-2030 ($ million)
Chart on Global Market: Year-over-year growth 2025-2030 (%)
Data Table on Global Market: Year-over-year growth 2025-2030 (%)

5. Historic Market Size

5.1 Global Ferroalloys Market 2020 - 2024

Historic Market Size - Data Table on Global Ferroalloys Market 2020 - 2024 ($ million)

5.2 Type segment analysis 2020 - 2024

Historic Market Size - Type Segment 2020 - 2024 ($ million)

5.3 Technology segment analysis 2020 - 2024

Historic Market Size - Technology Segment 2020 - 2024 ($ million)

5.4 Application segment analysis 2020 - 2024

Historic Market Size - Application Segment 2020 - 2024 ($ million)

5.5 Geography segment analysis 2020 - 2024

Historic Market Size - Geography Segment 2020 - 2024 ($ million)

5.6 Country segment analysis 2020 - 2024

Historic Market Size - Country Segment 2020 - 2024 ($ million)

6. Qualitative Analysis

6.1 Impact of AI on Global Ferroalloys Market

6.2 Impact of geopolitical conflicts on Global Ferroalloys Market

7. Five Forces Analysis

7.1 Five forces summary

Five forces analysis - Comparison between 2025 and 2030

7.2 Bargaining power of buyers

Bargaining power of buyers - Impact of key factors 2025 and 2030

7.3 Bargaining power of suppliers

Bargaining power of suppliers - Impact of key factors in 2025 and 2030

7.4 Threat of new entrants

Threat of new entrants - Impact of key factors in 2025 and 2030

7.5 Threat of substitutes

Threat of substitutes - Impact of key factors in 2025 and 2030

7.6 Threat of rivalry

Threat of rivalry - Impact of key factors in 2025 and 2030

7.7 Market condition

Chart on Market condition - Five forces 2025 and 2030

8. Market Segmentation by Type

8.1 Market segments

Chart on Type - Market share 2025-2030 (%)
Data Table on Type - Market share 2025-2030 (%)

8.2 Comparison by Type

Chart on Comparison by Type
Data Table on Comparison by Type

8.3 Ferrochrome - Market size and forecast 2025-2030

Chart on Ferrochrome - Market size and forecast 2025-2030 ($ million)
Data Table on Ferrochrome - Market size and forecast 2025-2030 ($ million)
Chart on Ferrochrome - Year-over-year growth 2025-2030 (%)
Data Table on Ferrochrome - Year-over-year growth 2025-2030 (%)

8.4 Ferromanganese - Market size and forecast 2025-2030

Chart on Ferromanganese - Market size and forecast 2025-2030 ($ million)
Data Table on Ferromanganese - Market size and forecast 2025-2030 ($ million)
Chart on Ferromanganese - Year-over-year growth 2025-2030 (%)
Data Table on Ferromanganese - Year-over-year growth 2025-2030 (%)

8.5 Ferrosilicon - Market size and forecast 2025-2030

Chart on Ferrosilicon - Market size and forecast 2025-2030 ($ million)
Data Table on Ferrosilicon - Market size and forecast 2025-2030 ($ million)
Chart on Ferrosilicon - Year-over-year growth 2025-2030 (%)
Data Table on Ferrosilicon - Year-over-year growth 2025-2030 (%)

8.6 Ferronickel - Market size and forecast 2025-2030

Chart on Ferronickel - Market size and forecast 2025-2030 ($ million)
Data Table on Ferronickel - Market size and forecast 2025-2030 ($ million)
Chart on Ferronickel - Year-over-year growth 2025-2030 (%)
Data Table on Ferronickel - Year-over-year growth 2025-2030 (%)

8.7 Others - Market size and forecast 2025-2030

Chart on Others - Market size and forecast 2025-2030 ($ million)
Data Table on Others - Market size and forecast 2025-2030 ($ million)
Chart on Others - Year-over-year growth 2025-2030 (%)
Data Table on Others - Year-over-year growth 2025-2030 (%)

8.8 Market opportunity by Type

Market opportunity by Type ($ million)
Data Table on Market opportunity by Type ($ million)

9. Market Segmentation by Technology

9.1 Market segments

Chart on Technology - Market share 2025-2030 (%)
Data Table on Technology - Market share 2025-2030 (%)

9.2 Comparison by Technology

Chart on Comparison by Technology
Data Table on Comparison by Technology

9.3 Electric arc furnace - Market size and forecast 2025-2030

Chart on Electric arc furnace - Market size and forecast 2025-2030 ($ million)
Data Table on Electric arc furnace - Market size and forecast 2025-2030 ($ million)
Chart on Electric arc furnace - Year-over-year growth 2025-2030 (%)
Data Table on Electric arc furnace - Year-over-year growth 2025-2030 (%)

9.4 Blast furnace - Market size and forecast 2025-2030

Chart on Blast furnace - Market size and forecast 2025-2030 ($ million)
Data Table on Blast furnace - Market size and forecast 2025-2030 ($ million)
Chart on Blast furnace - Year-over-year growth 2025-2030 (%)
Data Table on Blast furnace - Year-over-year growth 2025-2030 (%)

9.5 Market opportunity by Technology

Market opportunity by Technology ($ million)
Data Table on Market opportunity by Technology ($ million)

10. Market Segmentation by Application

10.1 Market segments

Chart on Application - Market share 2025-2030 (%)
Data Table on Application - Market share 2025-2030 (%)

10.2 Comparison by Application

Chart on Comparison by Application
Data Table on Comparison by Application

10.3 Steel manufacturing - Market size and forecast 2025-2030

Chart on Steel manufacturing - Market size and forecast 2025-2030 ($ million)
Data Table on Steel manufacturing - Market size and forecast 2025-2030 ($ million)
Chart on Steel manufacturing - Year-over-year growth 2025-2030 (%)
Data Table on Steel manufacturing - Year-over-year growth 2025-2030 (%)

10.4 Cast iron - Market size and forecast 2025-2030

Chart on Cast iron - Market size and forecast 2025-2030 ($ million)
Data Table on Cast iron - Market size and forecast 2025-2030 ($ million)
Chart on Cast iron - Year-over-year growth 2025-2030 (%)
Data Table on Cast iron - Year-over-year growth 2025-2030 (%)

10.5 Others - Market size and forecast 2025-2030

Chart on Others - Market size and forecast 2025-2030 ($ million)
Data Table on Others - Market size and forecast 2025-2030 ($ million)
Chart on Others - Year-over-year growth 2025-2030 (%)
Data Table on Others - Year-over-year growth 2025-2030 (%)

10.6 Market opportunity by Application

Market opportunity by Application ($ million)
Data Table on Market opportunity by Application ($ million)

11. Customer Landscape

11.1 Customer landscape overview

Analysis of price sensitivity, lifecycle, customer purchase basket, adoption rates, and purchase criteria

12. Geographic Landscape

12.1 Geographic segmentation

Chart on Market share by geography 2025-2030 (%)
Data Table on Market share by geography 2025-2030 (%)

12.2 Geographic comparison

Chart on Geographic comparison
Data Table on Geographic comparison

12.3 APAC - Market size and forecast 2025-2030

Chart on APAC - Market size and forecast 2025-2030 ($ million)
Data Table on APAC - Market size and forecast 2025-2030 ($ million)
Chart on APAC - Year-over-year growth 2025-2030 (%)
Data Table on APAC - Year-over-year growth 2025-2030 (%)
Chart on Regional Comparison - APAC
Data Table on Regional Comparison - APAC

12.3.1 China - Market size and forecast 2025-2030

Chart on China - Market size and forecast 2025-2030 ($ million)
Data Table on China - Market size and forecast 2025-2030 ($ million)
Chart on China - Year-over-year growth 2025-2030 (%)
Data Table on China - Year-over-year growth 2025-2030 (%)

12.3.2 India - Market size and forecast 2025-2030

Chart on India - Market size and forecast 2025-2030 ($ million)
Data Table on India - Market size and forecast 2025-2030 ($ million)
Chart on India - Year-over-year growth 2025-2030 (%)
Data Table on India - Year-over-year growth 2025-2030 (%)

12.3.3 Japan - Market size and forecast 2025-2030

Chart on Japan - Market size and forecast 2025-2030 ($ million)
Data Table on Japan - Market size and forecast 2025-2030 ($ million)
Chart on Japan - Year-over-year growth 2025-2030 (%)
Data Table on Japan - Year-over-year growth 2025-2030 (%)

12.3.4 South Korea - Market size and forecast 2025-2030

Chart on South Korea - Market size and forecast 2025-2030 ($ million)
Data Table on South Korea - Market size and forecast 2025-2030 ($ million)
Chart on South Korea - Year-over-year growth 2025-2030 (%)
Data Table on South Korea - Year-over-year growth 2025-2030 (%)

12.3.5 Indonesia - Market size and forecast 2025-2030

Chart on Indonesia - Market size and forecast 2025-2030 ($ million)
Data Table on Indonesia - Market size and forecast 2025-2030 ($ million)
Chart on Indonesia - Year-over-year growth 2025-2030 (%)
Data Table on Indonesia - Year-over-year growth 2025-2030 (%)

12.3.6 Vietnam - Market size and forecast 2025-2030

Chart on Vietnam - Market size and forecast 2025-2030 ($ million)
Data Table on Vietnam - Market size and forecast 2025-2030 ($ million)
Chart on Vietnam - Year-over-year growth 2025-2030 (%)
Data Table on Vietnam - Year-over-year growth 2025-2030 (%)

12.4 Europe - Market size and forecast 2025-2030

Chart on Europe - Market size and forecast 2025-2030 ($ million)
Data Table on Europe - Market size and forecast 2025-2030 ($ million)
Chart on Europe - Year-over-year growth 2025-2030 (%)
Data Table on Europe - Year-over-year growth 2025-2030 (%)
Chart on Regional Comparison - Europe
Data Table on Regional Comparison - Europe

12.4.1 Germany - Market size and forecast 2025-2030

Chart on Germany - Market size and forecast 2025-2030 ($ million)
Data Table on Germany - Market size and forecast 2025-2030 ($ million)
Chart on Germany - Year-over-year growth 2025-2030 (%)
Data Table on Germany - Year-over-year growth 2025-2030 (%)

12.4.2 France - Market size and forecast 2025-2030

Chart on France - Market size and forecast 2025-2030 ($ million)
Data Table on France - Market size and forecast 2025-2030 ($ million)
Chart on France - Year-over-year growth 2025-2030 (%)
Data Table on France - Year-over-year growth 2025-2030 (%)

12.4.3 Italy - Market size and forecast 2025-2030

Chart on Italy - Market size and forecast 2025-2030 ($ million)
Data Table on Italy - Market size and forecast 2025-2030 ($ million)
Chart on Italy - Year-over-year growth 2025-2030 (%)
Data Table on Italy - Year-over-year growth 2025-2030 (%)

12.4.4 Russia - Market size and forecast 2025-2030

Chart on Russia - Market size and forecast 2025-2030 ($ million)
Data Table on Russia - Market size and forecast 2025-2030 ($ million)
Chart on Russia - Year-over-year growth 2025-2030 (%)
Data Table on Russia - Year-over-year growth 2025-2030 (%)

12.4.5 Norway - Market size and forecast 2025-2030

Chart on Norway - Market size and forecast 2025-2030 ($ million)
Data Table on Norway - Market size and forecast 2025-2030 ($ million)
Chart on Norway - Year-over-year growth 2025-2030 (%)
Data Table on Norway - Year-over-year growth 2025-2030 (%)

12.4.6 Finland - Market size and forecast 2025-2030

Chart on Finland - Market size and forecast 2025-2030 ($ million)
Data Table on Finland - Market size and forecast 2025-2030 ($ million)
Chart on Finland - Year-over-year growth 2025-2030 (%)
Data Table on Finland - Year-over-year growth 2025-2030 (%)

12.5 North America - Market size and forecast 2025-2030

Chart on North America - Market size and forecast 2025-2030 ($ million)
Data Table on North America - Market size and forecast 2025-2030 ($ million)
Chart on North America - Year-over-year growth 2025-2030 (%)
Data Table on North America - Year-over-year growth 2025-2030 (%)
Chart on Regional Comparison - North America
Data Table on Regional Comparison - North America

12.5.1 US - Market size and forecast 2025-2030

Chart on US - Market size and forecast 2025-2030 ($ million)
Data Table on US - Market size and forecast 2025-2030 ($ million)
Chart on US - Year-over-year growth 2025-2030 (%)
Data Table on US - Year-over-year growth 2025-2030 (%)

12.5.2 Canada - Market size and forecast 2025-2030

Chart on Canada - Market size and forecast 2025-2030 ($ million)
Data Table on Canada - Market size and forecast 2025-2030 ($ million)
Chart on Canada - Year-over-year growth 2025-2030 (%)
Data Table on Canada - Year-over-year growth 2025-2030 (%)

12.5.3 Mexico - Market size and forecast 2025-2030

Chart on Mexico - Market size and forecast 2025-2030 ($ million)
Data Table on Mexico - Market size and forecast 2025-2030 ($ million)
Chart on Mexico - Year-over-year growth 2025-2030 (%)
Data Table on Mexico - Year-over-year growth 2025-2030 (%)

12.6 Middle East and Africa - Market size and forecast 2025-2030

Chart on Middle East and Africa - Market size and forecast 2025-2030 ($ million)
Data Table on Middle East and Africa - Market size and forecast 2025-2030 ($ million)
Chart on Middle East and Africa - Year-over-year growth 2025-2030 (%)
Data Table on Middle East and Africa - Year-over-year growth 2025-2030 (%)
Chart on Regional Comparison - Middle East and Africa
Data Table on Regional Comparison - Middle East and Africa

12.6.1 South Africa - Market size and forecast 2025-2030

Chart on South Africa - Market size and forecast 2025-2030 ($ million)
Data Table on South Africa - Market size and forecast 2025-2030 ($ million)
Chart on South Africa - Year-over-year growth 2025-2030 (%)
Data Table on South Africa - Year-over-year growth 2025-2030 (%)

12.6.2 Iran - Market size and forecast 2025-2030

Chart on Iran - Market size and forecast 2025-2030 ($ million)
Data Table on Iran - Market size and forecast 2025-2030 ($ million)
Chart on Iran - Year-over-year growth 2025-2030 (%)
Data Table on Iran - Year-over-year growth 2025-2030 (%)

12.6.3 Saudi Arabia - Market size and forecast 2025-2030

Chart on Saudi Arabia - Market size and forecast 2025-2030 ($ million)
Data Table on Saudi Arabia - Market size and forecast 2025-2030 ($ million)
Chart on Saudi Arabia - Year-over-year growth 2025-2030 (%)
Data Table on Saudi Arabia - Year-over-year growth 2025-2030 (%)

12.6.4 UAE - Market size and forecast 2025-2030

Chart on UAE - Market size and forecast 2025-2030 ($ million)
Data Table on UAE - Market size and forecast 2025-2030 ($ million)
Chart on UAE - Year-over-year growth 2025-2030 (%)
Data Table on UAE - Year-over-year growth 2025-2030 (%)

12.6.5 Oman - Market size and forecast 2025-2030

Chart on Oman - Market size and forecast 2025-2030 ($ million)
Data Table on Oman - Market size and forecast 2025-2030 ($ million)
Chart on Oman - Year-over-year growth 2025-2030 (%)
Data Table on Oman - Year-over-year growth 2025-2030 (%)

12.7 South America - Market size and forecast 2025-2030

Chart on South America - Market size and forecast 2025-2030 ($ million)
Data Table on South America - Market size and forecast 2025-2030 ($ million)
Chart on South America - Year-over-year growth 2025-2030 (%)
Data Table on South America - Year-over-year growth 2025-2030 (%)
Chart on Regional Comparison - South America
Data Table on Regional Comparison - South America

12.7.1 Brazil - Market size and forecast 2025-2030

Chart on Brazil - Market size and forecast 2025-2030 ($ million)
Data Table on Brazil - Market size and forecast 2025-2030 ($ million)
Chart on Brazil - Year-over-year growth 2025-2030 (%)
Data Table on Brazil - Year-over-year growth 2025-2030 (%)

12.7.2 Argentina - Market size and forecast 2025-2030

Chart on Argentina - Market size and forecast 2025-2030 ($ million)
Data Table on Argentina - Market size and forecast 2025-2030 ($ million)
Chart on Argentina - Year-over-year growth 2025-2030 (%)
Data Table on Argentina - Year-over-year growth 2025-2030 (%)

12.7.3 Colombia - Market size and forecast 2025-2030

Chart on Colombia - Market size and forecast 2025-2030 ($ million)
Data Table on Colombia - Market size and forecast 2025-2030 ($ million)
Chart on Colombia - Year-over-year growth 2025-2030 (%)
Data Table on Colombia - Year-over-year growth 2025-2030 (%)

12.8 Market opportunity by geography

Market opportunity by geography ($ million)
Data Tables on Market opportunity by geography ($ million)

13. Drivers, Challenges, and Opportunity

13.1 Market drivers

Rapid infrastructure development and urbanization in emerging economies
Technological advancements in automotive manufacturing and lightweighting
Increasing integration of renewable energy infrastructure and electric vehicle production

13.2 Market challenges

Stringent environmental regulations and mandate for decarbonization
Geopolitical instability and concentration of raw material reserves
Escalating energy costs and power grid volatility

13.3 Impact of drivers and challenges

Impact of drivers and challenges in 2025 and 2030

13.4 Market opportunities

Implementation of circular economy frameworks and enhanced secondary recovery
Digital transformation and AI-driven optimization of smelting processes
Proliferation of high-purity specialty alloys for aerospace and defense sectors

14. Competitive Landscape

14.1 Overview

14.2

Overview on criticality of inputs and factors of differentiation

14.3 Landscape disruption

Overview on factors of disruption

14.4 Industry risks

Impact of key risks on business

15. Competitive Analysis

15.1 Companies profiled

Companies covered

15.2 Company ranking index

15.3 Market positioning of companies

Matrix on companies position and classification

15.4 Afarak Group SE

Afarak Group SE - Overview
Afarak Group SE - Product / Service
Afarak Group SE - Key offerings
SWOT

15.5 AMG Advanced Metallurgical

AMG Advanced Metallurgical - Overview
AMG Advanced Metallurgical - Business segments
AMG Advanced Metallurgical - Key offerings
AMG Advanced Metallurgical - Segment focus
SWOT

15.6 ArcelorMittal S.A.

ArcelorMittal S.A. - Overview
ArcelorMittal S.A. - Business segments
ArcelorMittal S.A. - Key offerings
ArcelorMittal S.A. - Segment focus
SWOT

15.7 Assore Ltd.

Assore Ltd. - Overview
Assore Ltd. - Product / Service
Assore Ltd. - Key offerings
SWOT

15.8 China Minmetals Corp.

China Minmetals Corp. - Overview
China Minmetals Corp. - Product / Service
China Minmetals Corp. - Key offerings
SWOT

15.9 Elkem ASA

Elkem ASA - Overview
Elkem ASA - Business segments
Elkem ASA - Key offerings
Elkem ASA - Segment focus
SWOT

15.10 Eramet SA

Eramet SA - Overview
Eramet SA - Business segments
Eramet SA - Key offerings
Eramet SA - Segment focus
SWOT

15.11 Ferroglobe Plc

Ferroglobe Plc - Overview
Ferroglobe Plc - Business segments
Ferroglobe Plc - Key offerings
Ferroglobe Plc - Segment focus
SWOT

15.12 Glencore Plc

Glencore Plc - Overview
Glencore Plc - Business segments
Glencore Plc - Key offerings
Glencore Plc - Segment focus
SWOT

15.13 Jindal Steel Ltd.

Jindal Steel Ltd. - Overview
Jindal Steel Ltd. - Business segments
Jindal Steel Ltd. - Key offerings
Jindal Steel Ltd. - Segment focus
SWOT

15.14 Maithan Alloys Ltd.

Maithan Alloys Ltd. - Overview
Maithan Alloys Ltd. - Product / Service
Maithan Alloys Ltd. - Key offerings
SWOT

15.15 OM Holdings Ltd.

OM Holdings Ltd. - Overview
OM Holdings Ltd. - Business segments
OM Holdings Ltd. - Key offerings
OM Holdings Ltd. - Segment focus
SWOT

15.16 Outokumpu Oyj

Outokumpu Oyj - Overview
Outokumpu Oyj - Business segments
Outokumpu Oyj - Key offerings
Outokumpu Oyj - Segment focus
SWOT

15.17 South32 Ltd.

South32 Ltd. - Overview
South32 Ltd. - Product / Service
South32 Ltd. - Key offerings
SWOT

15.18 Tata Steel Ltd.

Tata Steel Ltd. - Overview
Tata Steel Ltd. - Business segments
Tata Steel Ltd. - Key offerings
Tata Steel Ltd. - Segment focus
SWOT

16. Appendix

16.1 Scope of the report

Market definition
Objectives
Notes and caveats

16.2 Inclusions and exclusions checklist

Inclusions checklist
Exclusions checklist

16.3 Currency conversion rates for US$

16.4 Research methodology

16.5 Data procurement

Information sources

16.6 Data validation

16.7 Validation techniques employed for market sizing

16.8 Data synthesis

16.9 360 degree market analysis

16.10 List of abbreviations

Research Methodology

Technavio presents a detailed picture of the market by way of study, synthesis, and summation of data from multiple sources. The analysts have presented the various facets of the market with a particular focus on identifying the key industry influencers. The data thus presented is comprehensive, reliable, and the result of extensive research, both primary and secondary.

INFORMATION SOURCES

Primary sources

  • Manufacturers and suppliers
  • Channel partners
  • Industry experts
  • Strategic decision makers

Secondary sources

  • Industry journals and periodicals
  • Government data
  • Financial reports of key industry players
  • Historical data
  • Press releases

DATA ANALYSIS

Data Synthesis

  • Collation of data
  • Estimation of key figures
  • Analysis of derived insights

Data Validation

  • Triangulation with data models
  • Reference against proprietary databases
  • Corroboration with industry experts

REPORT WRITING

Qualitative

  • Market drivers
  • Market challenges
  • Market trends
  • Five forces analysis

Quantitative

  • Market size and forecast
  • Market segmentation
  • Geographical insights
  • Competitive landscape

Interested in this report?

Get your sample now to see our research methodology and insights!

Download Now

Frequently Asked Questions

Ferroalloys market growth will increase by USD 19291.1 million during 2026-2030.

The Ferroalloys market is expected to grow at a CAGR of 5.6% during 2026-2030.

Ferroalloys market is segmented by Type (Ferrochrome, Ferromanganese, Ferrosilicon, Ferronickel, Others) Technology (Electric arc furnace, Blast furnace) Application (Steel manufacturing, Cast iron, Others)

Afarak Group SE, AMG Advanced Metallurgical, ArcelorMittal S.A., Assore Ltd., China Minmetals Corp., Elkem ASA, Eramet SA, Ferroglobe Plc, Glencore Plc, Gulf Ferro Alloys Co., Jindal Steel Ltd., Maithan Alloys Ltd., Nava Ltd., OM Holdings Ltd., Outokumpu Oyj, Samancor Chrome, South32 Ltd., Tata Steel Ltd., Tsingshan Holding Group, Yildirim Group are a few of the key vendors in the Ferroalloys market.

APAC will register the highest growth rate of 58.6% among the other regions. Therefore, the Ferroalloys market in APAC is expected to garner significant business opportunities for the vendors during the forecast period.

China, India, Japan, South Korea, Indonesia, Vietnam, Germany, France, Italy, Russia, Norway, Finland, US, Canada, Mexico, South Africa, Iran, Saudi Arabia, UAE, Oman, Brazil, Argentina, Colombia

  • Rapid infrastructure development and urbanization in emerging economies is the driving factor this market.

The Ferroalloys market vendors should focus on grabbing business opportunities from the Type segment as it accounted for the largest market share in the base year.
RIA - Research AI Assistant
Ask RIA
