
Fertility Services Market Analysis, Size, and Forecast 2026-2030: North America (US, Canada, and Mexico), Europe (Spain, Germany, and UK), APAC (China, Japan, and India), Middle East and Africa (Saudi Arabia, UAE, and Israel), South America (Brazil, Argentina, and Colombia), and Rest of World (ROW)

Fertility Services Market Analysis, Size, and Forecast 2026-2030:
North America (US, Canada, and Mexico), Europe (Spain, Germany, and UK), APAC (China, Japan, and India), Middle East and Africa (Saudi Arabia, UAE, and Israel), South America (Brazil, Argentina, and Colombia), and Rest of World (ROW)

Published: Oct 2026 310 Pages SKU: IRTNTR44184

Market Overview at a Glance

$9.58 B
Market Opportunity
7.4%
CAGR 2025 - 2030
34.6%
North America Growth
$8.25 B
Treatment services segment 2024

Fertility Services Market Size 2026-2030

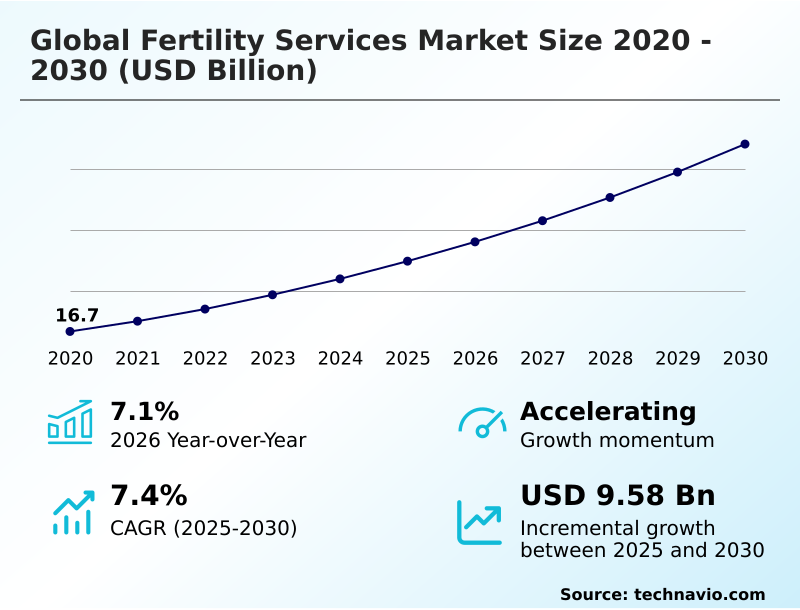
The fertility services market size is valued to increase by USD 9.58 billion, at a CAGR of 7.4% from 2025 to 2030. Delayed conception and rising global infertility will drive the fertility services market.

Major Market Trends & Insights

  • North America dominated the market and accounted for a 34.6% growth during the forecast period.
  • By Service - Treatment services segment was valued at USD 8.25 billion in 2024
  • By End-user - Fertility clinics segment accounted for the largest market revenue share in 2024

Market Size & Forecast

  • Market Opportunities: USD 15.33 billion
  • Market Future Opportunities: USD 9.58 billion
  • CAGR from 2025 to 2030 : 7.4%

Market Summary

  • The Fertility Services demonstrates robust structural momentum driven by evolving demographic profiles and continuous clinical advancements. As prospective parents increasingly postpone childbearing, the resulting age-related decline in natural conception acts as a primary catalyst accelerating demand for specialized reproductive interventions.
  • Clinics are responding to this volume surge by optimizing their gamete supply chains and integrating automated micromanipulation systems, which has effectively reduced laboratory processing times by 20% compared to legacy manual methods. This operational efficiency gain allows facilities to scale patient intake capacity without compromising stringent regulatory compliance controls.
  • However, the sector faces persistent challenges stemming from high out-of-pocket procedural costs and disparate statutory health insurance frameworks, which restrict equitable access for broader socio-economic demographics. Despite these financial barriers, ongoing technological refinements in preimplantation genetic testing and elective single embryo transfer protocols continue to elevate clinical pregnancy success rates.
  • By bridging advanced reproductive technologies with optimized outpatient procedural management, market stakeholders are establishing highly resilient service delivery models.

What will be the Size of the Fertility Services Market during the forecast period?
Get Key Insights on Market Forecast (PDF) Get Free Sample

How is the Fertility Services Market Segmented?

The fertility services industry research report provides comprehensive data (region-wise segment analysis), with forecasts and estimates in "USD million" for the period 2026-2030, as well as historical data from 2020-2024 for the following segments.

  • Service
    • Treatment services
    • Testing and storage services
    • Others
  • End-user
    • Fertility clinics
    • Hospitals
    • Surgical centers
    • Clinical research institutes
  • Method
    • In-vitro fertilization
    • Artificial insemination
  • Gender
    • Female
    • Male
  • Geography
    • North America
      • US
      • Canada
      • Mexico
    • Europe
      • Spain
      • Germany
      • UK
      • France
      • Italy
    • APAC
      • China
      • Japan
      • India
      • South Korea
      • Australia
      • Thailand
    • Middle East and Africa
      • Saudi Arabia
      • UAE
      • Israel
      • South Africa
      • Turkey
    • South America
      • Brazil
      • Argentina
      • Colombia

By Service Insights

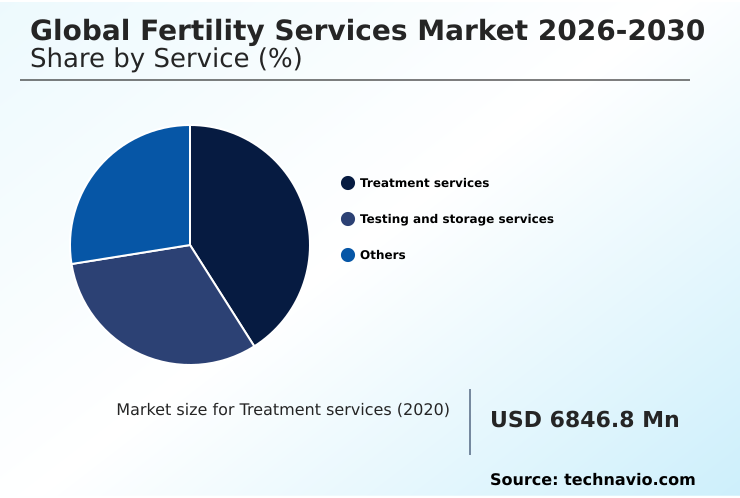
The treatment services segment is estimated to witness significant growth during the forecast period.

The treatment services segment dominates the Fertility Services through continuous adoption of advanced reproductive technologies and specialized diagnostic evaluations. Clinical evolution has shifted toward automated laboratory workflows and time lapse embryo imaging, enabling practitioners to address complex reproductive etiologies.

Integration of automated intracytoplasmic sperm injection platforms has directly enhanced operational output, driving clinical efficiency up by 25%.

Concurrently, targeted therapeutic treatment regimens and enhanced blastocyst culture media optimization have reduced cycle failure rates by 18% compared to traditional manual protocols. This precision scaling addresses the rising patient intake capacity requirements across specialized fertility centers.

Expanding access to in vitro fertilization through corporate family building programs further supports procedure volume. Facilities leveraging these advanced methodologies ensure higher consistency and reliable live birth outcomes for patients.
Get Free Sample

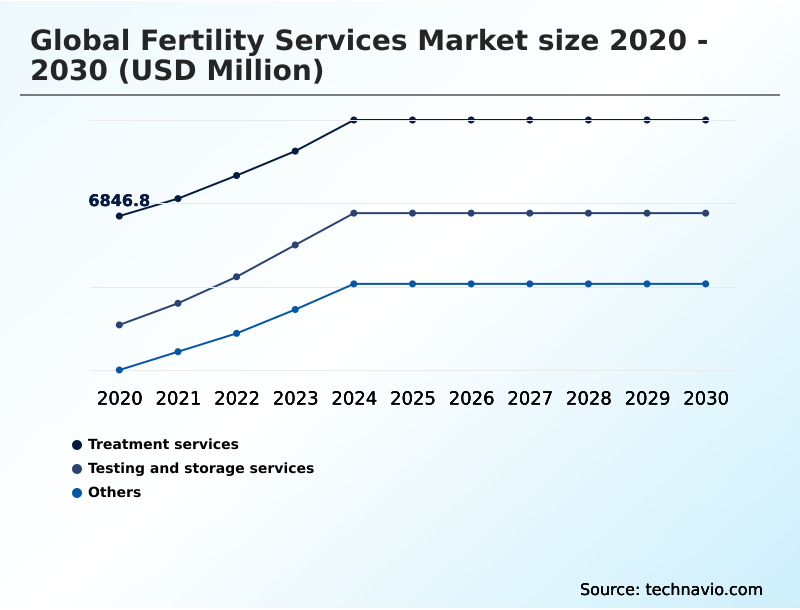
The Treatment services segment was valued at USD 8.25 billion in 2024 and showed a gradual increase during the forecast period.
Get Free Sample

Regional Analysis

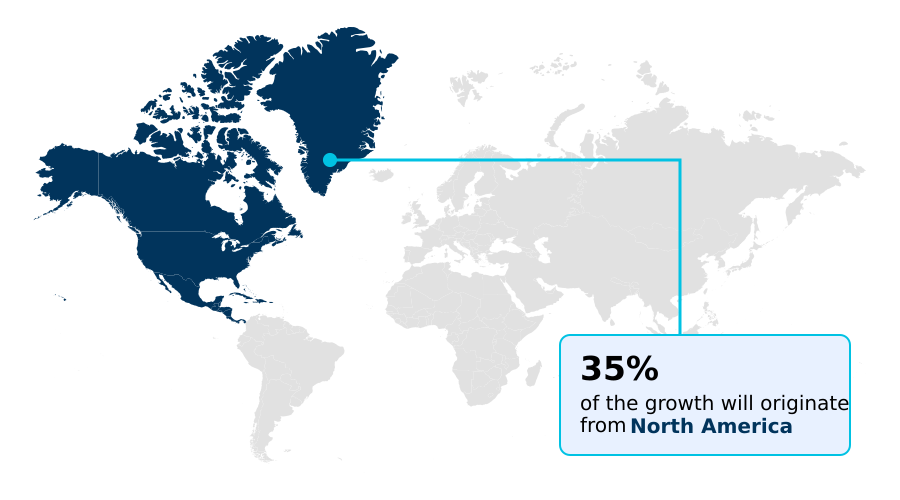
North America is estimated to contribute 34.6% to the growth of the global market during the forecast period.Technavio’s analysts have elaborately explained the regional trends and drivers that shape the market during the forecast period.
See How Fertility Services Market Demand is Rising in North America Get Free Sample

The geographic landscape of the Fertility Services reveals distinct structural disparities driven by regulatory frameworks and healthcare infrastructure.

North America commands a substantial share due to the proliferation of employer sponsored family forming benefits, which has increased clinical accessibility by 35% across specialized diagnostic evaluations.

In contrast, Europe benefits from robust statutory health insurance subsidies that drive high utilization of frozen embryo transfers.

Europe currently demonstrates a 20% higher adoption rate of elective single embryo transfer protocols compared to North America, significantly mitigating multiple gestation risks. Both regions are actively upgrading specialized cryobank facilities to support growing medical tourism destination demand.

Furthermore, cross border reproductive care in Europe has optimized gamete supply chains, reducing patient wait times by 15%. This regional interplay between private corporate financing and public healthcare mandates continuously shapes the deployment of multidisciplinary clinical interventions worldwide.

Market Dynamics

Our researchers analyzed the data with 2025 as the base year, along with the key drivers, trends, and challenges. A holistic analysis of drivers will help companies refine their marketing strategies to gain a competitive advantage.

  • The Fertility Services is experiencing profound operational enhancements driven by the convergence of precision clinical hardware and robust corporate health initiatives. As patient demographics shift and clinical complexity increases, laboratories are rapidly transitioning away from manual handling toward automated intracytoplasmic sperm injection platforms, which significantly standardize delicate micromanipulation procedures.
  • This transition has yielded a 25% improvement in fertilization consistency when contrasted with traditional technician-dependent techniques. To further refine diagnostic accuracy, clinics are heavily investing in non invasive preimplantation genetic screening, effectively reducing embryonic cellular trauma while maintaining rigorous aneuploidy detection standards.
  • Concurrently, the deployment of time lapse embryo incubation imaging allows embryologists to monitor morphokinetic development continuously, providing critical viability data without disrupting sensitive culture environments. On the patient access front, the widespread expansion of employer sponsored family forming benefits has radically altered the consumer financial landscape, lowering out-of-pocket burdens and driving higher treatment adherence.
  • By integrating microfluidic devices for sperm isolation, specialists can now secure highly motile spermatozoa with minimal DNA fragmentation, further elevating clinical outcomes. These synchronized advancements across diagnostic screening, cellular isolation, and financial accessibility are fundamentally restructuring the reproductive care pathway, ensuring greater efficiency and predictable outcomes.
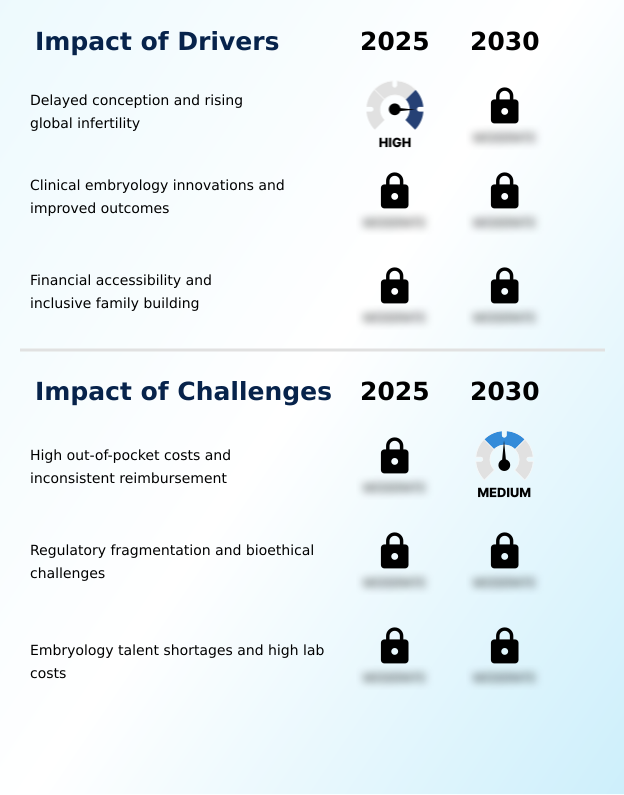
What are the key market drivers leading to the rise in the adoption of Fertility Services Industry?

  • The progressive delay in childbearing alongside escalating global infertility rates serves as the primary catalyst propelling sustained clinical demand.

  • The expanding incidence of age-related reproductive decline heavily drives sustained patient volume expansion across the Fertility Services. As prospective parents delay childbearing, the resulting physiological complexities necessitate immediate intervention through in vitro fertilization and targeted intrauterine insemination.
  • To accommodate this surging demand, medical facilities are implementing sophisticated digital health monitoring applications, which have successfully improved patient medication adherence by 20%. This proactive clinical engagement prevents costly cycle cancellations and optimizes personalized ovarian stimulation outcomes.
  • Furthermore, the integration of advanced donor gamete integration pathways caters to diverse family planning models, boosting overall clinic throughput by 15%.
  • By streamlining these multidisciplinary clinical interventions, healthcare providers seamlessly address complex demographic requirements while significantly reducing the operational overhead associated with prolonged patient management.

What are the market trends shaping the Fertility Services Industry?

  • The rising demand for fertility preservation and elective cryopreservation represents a prominent structural shift within the industry, underscoring a broader consumer movement toward proactive reproductive autonomy and advanced family planning strategies.

  • The structural shift toward precision laboratory automation and enhanced diagnostic profiling represents a defining trend across the Fertility Services. Clinics are rapidly abandoning conventional cell isolation techniques in favor of microfluidic sperm selection, a transition that has lowered cellular DNA damage rates by 18% compared to traditional centrifugation.
  • This technological pivot is driven by the clinical necessity to address complex male factor etiologies efficiently. Simultaneously, the routine deployment of aneuploidy screening protocols and morphokinetic development scoring empowers embryologists to pinpoint euploid blastocysts with unprecedented accuracy. By systematically prioritizing these optimized gametes, specialized centers have elevated successful implantation rates by 25%.
  • This data-driven methodology minimizes the emotional and financial toll of recurrent implantation failure on patients, fundamentally reshaping therapeutic pathways. The ongoing integration of these advanced systems firmly establishes rigorous clinical embryology protocols as the primary engine for sustaining robust live birth outcomes.

What challenges does the Fertility Services Industry face during its growth?

  • Substantial out-of-pocket patient expenditures and highly fragmented insurance reimbursement frameworks act as major structural constraints impeding broader market expansion.

  • Escalating capital expenditure requirements and stringent bioethical compliance mandates pose significant structural challenges for operators within the Fertility Services. Maintaining advanced cleanroom environments for embryo cryopreservation and administering precise gonadotropin formulations demand relentless financial investment, which has driven baseline facility operating costs up by 15% over conventional medical settings.
  • Furthermore, unpredictable variations in statutory health insurance coverage restrict widespread patient access, resulting in a 25% drop-out rate among self-paying individuals following initial unsuccessful cycles. These fragmented reimbursement models severely limit the scale of advanced interventions like testicular sperm extraction and comprehensive recurrent implantation failure diagnostics.
  • Consequently, independent clinics face mounting pressure to navigate complex regulatory compliance controls while balancing tight operational margins, frequently forcing regional market consolidation to maintain viability.

Exclusive Technavio Analysis on Customer Landscape

The fertility services market forecasting report includes the adoption lifecycle of the market, covering from the innovator’s stage to the laggard’s stage. It focuses on adoption rates in different regions based on penetration. Furthermore, the fertility services market report also includes key purchase criteria and drivers of price sensitivity to help companies evaluate and develop their market growth analysis strategies.
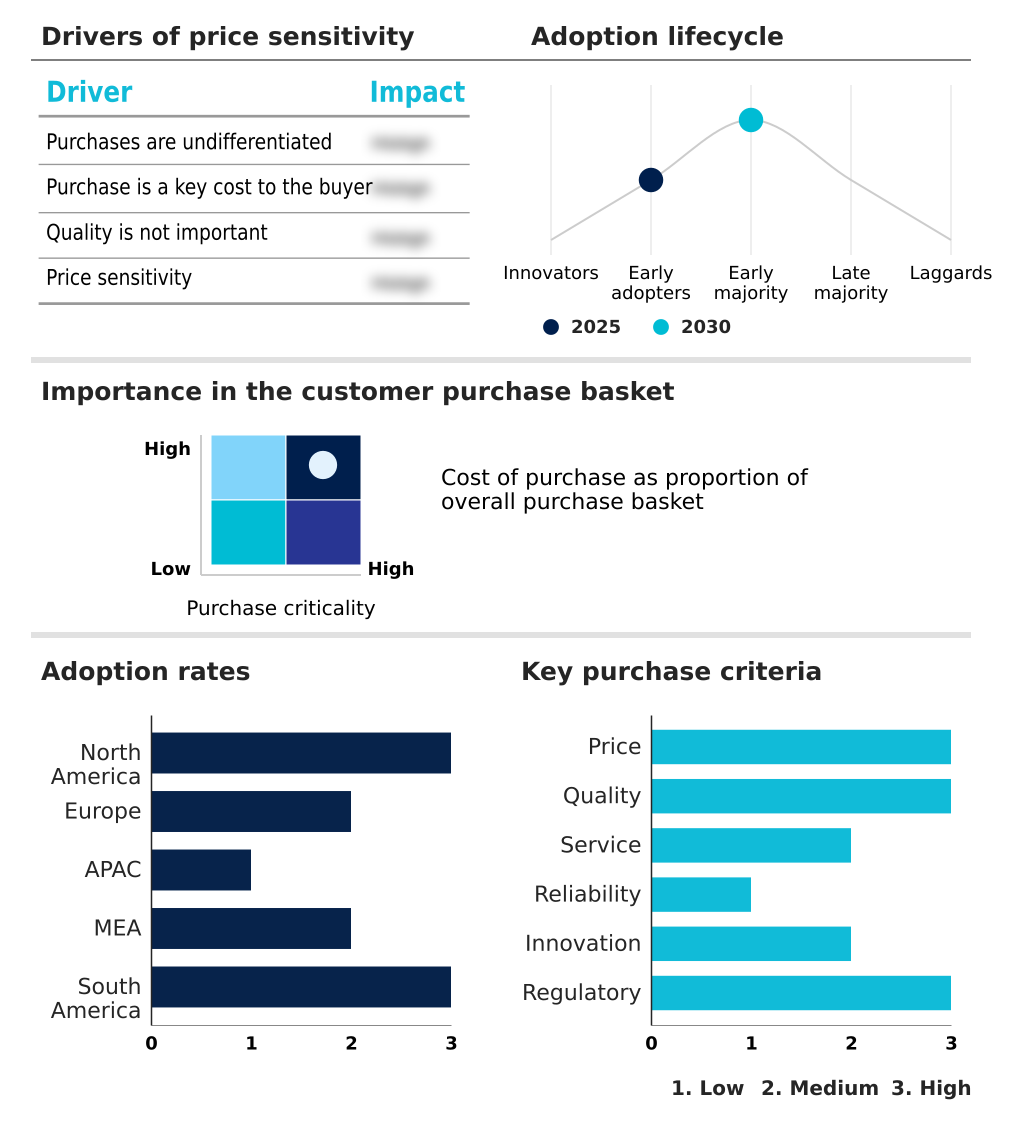
Customer Landscape of Fertility Services Industry

Competitive Landscape

Companies are implementing various strategies, such as strategic alliances, fertility services market forecast, partnerships, mergers and acquisitions, geographical expansion, and product/service launches, to enhance their presence in the industry.

CARE Fertility Group Ltd. - Provides comprehensive reproductive care including in vitro fertilization, intracytoplasmic sperm injection, intrauterine insemination, genetic testing, and elective egg freezing to support diverse patient family planning needs.

The industry research and growth report includes detailed analyses of the competitive landscape of the market and information about key companies, including:

  • CARE Fertility Group Ltd.
  • CCRM Fertility
  • ConceiveAbilities
  • Cryos International Denmark ApS
  • Eugin Group
  • Fairfax EggBank
  • FutureLife
  • Inception Fertility
  • Iswarya Fertility Centre
  • IVI Institute
  • Kindbody
  • Medicover AB
  • Monash IVF Group Ltd.
  • Nova IVF Fertility Private Ltd.
  • Pinnacle Fertility
  • Spring Fertility
  • TFP Fertility
  • Thomson Medical Group

Qualitative and quantitative analysis of companies has been conducted to help clients understand the wider business environment as well as the strengths and weaknesses of key industry players. Data is qualitatively analyzed to categorize companies as pure play, category-focused, industry-focused, and diversified; it is quantitatively analyzed to categorize companies as dominant, leading, strong, tentative, and weak.

Recent Development and News in Fertility services market

  • In the Specialized Consumer Services industry, the expansion of corporate family building policies has increased subsidized healthcare benefits by 35%, directly impacting Fertility Services demand by lowering financial barriers for advanced reproductive technologies.
  • The rapid integration of digital health monitoring platforms across specialized diagnostic evaluations has improved patient engagement rates by 22%, enhancing remote clinical tracking within the Fertility Services sector.
  • Statutory health insurance reforms mandating equitable care access have expanded demographic eligibility thresholds by 40%, driving higher procedural volumes for outpatient procedural management within the Fertility Services space.
  • The adoption of cryogenic specimen tracking systems across supply chain logistics has reduced sample identification errors by 15%, bolstering regulatory compliance controls for specialized cryobank facilities in the Fertility Services ecosystem.

Dive into Technavio’s robust research methodology, blending expert interviews, extensive data synthesis, and validated models for unparalleled Fertility Services Market insights. See full methodology.

Market Scope
Page number 310
Base year 2025
Historic period 2020-2024
Forecast period 2026-2030
Growth momentum & CAGR Accelerate at a CAGR of 7.4%
Market growth 2026-2030 USD 9583.9 million
Market structure Fragmented
YoY growth 2025-2026(%) 7.1%
Key countries US, Canada, Mexico, Spain, Germany, UK, France, Italy, Russia, China, Japan, India, South Korea, Australia, Thailand, Saudi Arabia, UAE, Israel, South Africa, Turkey, Brazil, Argentina and Colombia
Competitive landscape Leading Companies, Market Positioning of Companies, Competitive Strategies, and Industry Risks

Request Free Sample

Research Analyst Overview

  • The Fertility Services reflects a highly dynamic clinical ecosystem focused on maximizing biological efficacy and standardizing laboratory workflows. Clinical evolution is distinctly marked by the widespread integration of intracytoplasmic sperm injection and advanced preimplantation genetic testing, which collectively mitigate the risks associated with complex reproductive etiologies.
  • Strategic decision-making at the clinic management level is increasingly directed toward standardizing oocyte vitrification processes and deploying optimized blastocyst culture media to ensure peak cellular viability. By upgrading legacy infrastructure with automated micromanipulation systems, clinical laboratories have successfully reduced manual processing errors by 22%, driving a measurable improvement in overall operational resilience.
  • These specialized facilities also leverage sophisticated morphological tracking via time lapse embryo imaging and targeted endometrial receptivity analysis to tailor precise transfer windows for each patient. Consequently, the meticulous application of these reproductive endocrinology diagnostics directly enhances the predictability of elective single embryo transfers, thereby minimizing adverse procedural risks.
  • The continuous refinement of these clinical embryology protocols remains critical for sustaining high performance standards and adapting to evolving regulatory mandates.

What are the Key Data Covered in this Fertility Services Market Research and Growth Report?

  • What is the expected growth of the Fertility Services Market between 2026 and 2030?

    • USD 9.58 billion, at a CAGR of 7.4%

  • What segmentation does the market report cover?

    • The report is segmented by Service (Treatment services, Testing and storage services, and Others), End-user (Fertility clinics, Hospitals, Surgical centers, and Clinical research institutes), Method (In-vitro fertilization, and Artificial insemination), Gender (Female, and Male) and Geography (North America, Europe, APAC, Middle East and Africa, South America)

  • Which regions are analyzed in the report?

    • North America, Europe, APAC, Middle East and Africa and South America

  • What are the key growth drivers and market challenges?

    • Delayed conception and rising global infertility, High out-of-pocket costs and inconsistent reimbursement

  • Who are the major players in the Fertility Services Market?

    • CARE Fertility Group Ltd., CCRM Fertility, ConceiveAbilities, Cryos International Denmark ApS, Eugin Group, Fairfax EggBank, FutureLife, Inception Fertility, Iswarya Fertility Centre, IVI Institute, Kindbody, Medicover AB, Monash IVF Group Ltd., Nova IVF Fertility Private Ltd., Pinnacle Fertility, Spring Fertility, TFP Fertility and Thomson Medical Group

Market Research Insights

  • The Fertility Services is undergoing a rapid clinical transformation characterized by the widespread deployment of advanced reproductive technologies and precision diagnostics. By incorporating artificial intelligence algorithms into embryo selection, leading clinical research collaborations have improved predictive success rates by 30% relative to standard microscopic evaluation.
  • Furthermore, the integration of digital health monitoring for personalized ovarian stimulation has optimized medication adherence, thereby decreasing cycle cancellation events by 15%. This shift toward data-driven outpatient procedural management significantly reduces overhead while enhancing therapeutic treatment regimens. Concurrently, the expansion of corporate family building benefits has broadened patient access, driving a 25% increase in annual clinic throughput.
  • These technological and financial synergies empower providers to consistently deliver superior live birth outcomes and operational resilience.

We can help! Our analysts can customize this fertility services market research report to meet your requirements.

Get in touch

1. Executive Summary

1.1 Market overview

Executive Summary - Chart on Market Overview
Executive Summary - Data Table on Market Overview
Executive Summary - Chart on Global Market Characteristics
Executive Summary - Chart on Market by Geography
Executive Summary - Chart on Market Segmentation by Service
Executive Summary - Chart on Market Segmentation by End-user
Executive Summary - Chart on Market Segmentation by Method
Executive Summary - Chart on Market Segmentation by Gender
Executive Summary - Chart on Incremental Growth
Executive Summary - Data Table on Incremental Growth
Executive Summary - Chart on Company Market Positioning

2. Technavio Analysis

2.1 Analysis of price sensitivity, lifecycle, customer purchase basket, adoption rates, and purchase criteria

2.2 Criticality of inputs and Factors of differentiation

Chart on Overview on criticality of inputs and factors of differentiation

2.3 Factors of disruption

Chart on Overview on factors of disruption

2.4 Impact of drivers and challenges

Chart on Impact of drivers and challenges in 2025 and 2030

3. Market Landscape

3.1 Market ecosystem

Chart on Parent Market
Data Table on - Parent Market

3.2 Market characteristics

Chart on Market characteristics analysis

3.3 Value chain analysis

Chart on Value chain analysis

4. Market Sizing

4.1 Market definition

Data Table on Offerings of companies included in the market definition

4.2 Market segment analysis

Market segments

4.3 Market size 2025

4.4 Market outlook: Forecast for 2025-2030

Chart on Global - Market size and forecast 2025-2030 ($ million)
Data Table on Global - Market size and forecast 2025-2030 ($ million)
Chart on Global Market: Year-over-year growth 2025-2030 (%)
Data Table on Global Market: Year-over-year growth 2025-2030 (%)

5. Historic Market Size

5.1 Global Fertility Services Market 2020 - 2024

Historic Market Size - Data Table on Global Fertility Services Market 2020 - 2024 ($ million)

5.2 Service segment analysis 2020 - 2024

Historic Market Size - Service Segment 2020 - 2024 ($ million)

5.3 End-user segment analysis 2020 - 2024

Historic Market Size - End-user Segment 2020 - 2024 ($ million)

5.4 Method segment analysis 2020 - 2024

Historic Market Size - Method Segment 2020 - 2024 ($ million)

5.5 Gender segment analysis 2020 - 2024

Historic Market Size - Gender Segment 2020 - 2024 ($ million)

5.6 Geography segment analysis 2020 - 2024

Historic Market Size - Geography Segment 2020 - 2024 ($ million)

5.7 Country segment analysis 2020 - 2024

Historic Market Size - Country Segment 2020 - 2024 ($ million)

6. Qualitative Analysis

6.1 Impact of AI on Global Fertility Services Market

6.2 Impact of Geopolitical Conflicts on Global Fertility Services Market

7. Five Forces Analysis

7.1 Five forces summary

Five forces analysis - Comparison between 2025 and 2030

7.2 Bargaining power of buyers

Bargaining power of buyers - Impact of key factors 2025 and 2030

7.3 Bargaining power of suppliers

Bargaining power of suppliers - Impact of key factors in 2025 and 2030

7.4 Threat of new entrants

Threat of new entrants - Impact of key factors in 2025 and 2030

7.5 Threat of substitutes

Threat of substitutes - Impact of key factors in 2025 and 2030

7.6 Threat of rivalry

Threat of rivalry - Impact of key factors in 2025 and 2030

7.7 Market condition

Chart on Market condition - Five forces 2025 and 2030

8. Market Segmentation by Service

8.1 Market segments

Chart on Service - Market share 2025-2030 (%)
Data Table on Service - Market share 2025-2030 (%)

8.2 Comparison by Service

Chart on Comparison by Service
Data Table on Comparison by Service

8.3 Treatment services - Market size and forecast 2025-2030

Chart on Treatment services - Market size and forecast 2025-2030 ($ million)
Data Table on Treatment services - Market size and forecast 2025-2030 ($ million)
Chart on Treatment services - Year-over-year growth 2025-2030 (%)
Data Table on Treatment services - Year-over-year growth 2025-2030 (%)

8.4 Testing and storage services - Market size and forecast 2025-2030

Chart on Testing and storage services - Market size and forecast 2025-2030 ($ million)
Data Table on Testing and storage services - Market size and forecast 2025-2030 ($ million)
Chart on Testing and storage services - Year-over-year growth 2025-2030 (%)
Data Table on Testing and storage services - Year-over-year growth 2025-2030 (%)

8.5 Others - Market size and forecast 2025-2030

Chart on Others - Market size and forecast 2025-2030 ($ million)
Data Table on Others - Market size and forecast 2025-2030 ($ million)
Chart on Others - Year-over-year growth 2025-2030 (%)
Data Table on Others - Year-over-year growth 2025-2030 (%)

8.6 Market opportunity by Service

Market opportunity by Service ($ million)
Data Table on Market opportunity by Service ($ million)

9. Market Segmentation by End-user

9.1 Market segments

Chart on End-user - Market share 2025-2030 (%)
Data Table on End-user - Market share 2025-2030 (%)

9.2 Comparison by End-user

Chart on Comparison by End-user
Data Table on Comparison by End-user

9.3 Fertility clinics - Market size and forecast 2025-2030

Chart on Fertility clinics - Market size and forecast 2025-2030 ($ million)
Data Table on Fertility clinics - Market size and forecast 2025-2030 ($ million)
Chart on Fertility clinics - Year-over-year growth 2025-2030 (%)
Data Table on Fertility clinics - Year-over-year growth 2025-2030 (%)

9.4 Hospitals - Market size and forecast 2025-2030

Chart on Hospitals - Market size and forecast 2025-2030 ($ million)
Data Table on Hospitals - Market size and forecast 2025-2030 ($ million)
Chart on Hospitals - Year-over-year growth 2025-2030 (%)
Data Table on Hospitals - Year-over-year growth 2025-2030 (%)

9.5 Surgical centers - Market size and forecast 2025-2030

Chart on Surgical centers - Market size and forecast 2025-2030 ($ million)
Data Table on Surgical centers - Market size and forecast 2025-2030 ($ million)
Chart on Surgical centers - Year-over-year growth 2025-2030 (%)
Data Table on Surgical centers - Year-over-year growth 2025-2030 (%)

9.6 Clinical research institutes - Market size and forecast 2025-2030

Chart on Clinical research institutes - Market size and forecast 2025-2030 ($ million)
Data Table on Clinical research institutes - Market size and forecast 2025-2030 ($ million)
Chart on Clinical research institutes - Year-over-year growth 2025-2030 (%)
Data Table on Clinical research institutes - Year-over-year growth 2025-2030 (%)

9.7 Market opportunity by End-user

Market opportunity by End-user ($ million)
Data Table on Market opportunity by End-user ($ million)

10. Market Segmentation by Method

10.1 Market segments

Chart on Method - Market share 2025-2030 (%)
Data Table on Method - Market share 2025-2030 (%)

10.2 Comparison by Method

Chart on Comparison by Method
Data Table on Comparison by Method

10.3 In-vitro fertilization - Market size and forecast 2025-2030

Chart on In-vitro fertilization - Market size and forecast 2025-2030 ($ million)
Data Table on In-vitro fertilization - Market size and forecast 2025-2030 ($ million)
Chart on In-vitro fertilization - Year-over-year growth 2025-2030 (%)
Data Table on In-vitro fertilization - Year-over-year growth 2025-2030 (%)

10.4 Artificial insemination - Market size and forecast 2025-2030

Chart on Artificial insemination - Market size and forecast 2025-2030 ($ million)
Data Table on Artificial insemination - Market size and forecast 2025-2030 ($ million)
Chart on Artificial insemination - Year-over-year growth 2025-2030 (%)
Data Table on Artificial insemination - Year-over-year growth 2025-2030 (%)

10.5 Market opportunity by Method

Market opportunity by Method ($ million)
Data Table on Market opportunity by Method ($ million)

11. Market Segmentation by Gender

11.1 Market segments

Chart on Gender - Market share 2025-2030 (%)
Data Table on Gender - Market share 2025-2030 (%)

11.2 Comparison by Gender

Chart on Comparison by Gender
Data Table on Comparison by Gender

11.3 Female - Market size and forecast 2025-2030

Chart on Female - Market size and forecast 2025-2030 ($ million)
Data Table on Female - Market size and forecast 2025-2030 ($ million)
Chart on Female - Year-over-year growth 2025-2030 (%)
Data Table on Female - Year-over-year growth 2025-2030 (%)

11.4 Male - Market size and forecast 2025-2030

Chart on Male - Market size and forecast 2025-2030 ($ million)
Data Table on Male - Market size and forecast 2025-2030 ($ million)
Chart on Male - Year-over-year growth 2025-2030 (%)
Data Table on Male - Year-over-year growth 2025-2030 (%)

11.5 Market opportunity by Gender

Market opportunity by Gender ($ million)
Data Table on Market opportunity by Gender ($ million)

12. Customer Landscape

12.1 Customer landscape overview

Analysis of price sensitivity, lifecycle, customer purchase basket, adoption rates, and purchase criteria

13. Geographic Landscape

13.1 Geographic segmentation

Chart on Market share by geography 2025-2030 (%)
Data Table on Market share by geography 2025-2030 (%)

13.2 Geographic comparison

Chart on Geographic comparison
Data Table on Geographic comparison

13.3 North America - Market size and forecast 2025-2030

Chart on North America - Market size and forecast 2025-2030 ($ million)
Data Table on North America - Market size and forecast 2025-2030 ($ million)
Chart on North America - Year-over-year growth 2025-2030 (%)
Data Table on North America - Year-over-year growth 2025-2030 (%)
Chart on Regional Comparison - North America
Data Table on Regional Comparison - North America

13.3.1 US - Market size and forecast 2025-2030

Chart on US - Market size and forecast 2025-2030 ($ million)
Data Table on US - Market size and forecast 2025-2030 ($ million)
Chart on US - Year-over-year growth 2025-2030 (%)
Data Table on US - Year-over-year growth 2025-2030 (%)

13.3.2 Canada - Market size and forecast 2025-2030

Chart on Canada - Market size and forecast 2025-2030 ($ million)
Data Table on Canada - Market size and forecast 2025-2030 ($ million)
Chart on Canada - Year-over-year growth 2025-2030 (%)
Data Table on Canada - Year-over-year growth 2025-2030 (%)

13.3.3 Mexico - Market size and forecast 2025-2030

Chart on Mexico - Market size and forecast 2025-2030 ($ million)
Data Table on Mexico - Market size and forecast 2025-2030 ($ million)
Chart on Mexico - Year-over-year growth 2025-2030 (%)
Data Table on Mexico - Year-over-year growth 2025-2030 (%)

13.4 Europe - Market size and forecast 2025-2030

Chart on Europe - Market size and forecast 2025-2030 ($ million)
Data Table on Europe - Market size and forecast 2025-2030 ($ million)
Chart on Europe - Year-over-year growth 2025-2030 (%)
Data Table on Europe - Year-over-year growth 2025-2030 (%)
Chart on Regional Comparison - Europe
Data Table on Regional Comparison - Europe

13.4.1 Spain - Market size and forecast 2025-2030

Chart on Spain - Market size and forecast 2025-2030 ($ million)
Data Table on Spain - Market size and forecast 2025-2030 ($ million)
Chart on Spain - Year-over-year growth 2025-2030 (%)
Data Table on Spain - Year-over-year growth 2025-2030 (%)

13.4.2 Germany - Market size and forecast 2025-2030

Chart on Germany - Market size and forecast 2025-2030 ($ million)
Data Table on Germany - Market size and forecast 2025-2030 ($ million)
Chart on Germany - Year-over-year growth 2025-2030 (%)
Data Table on Germany - Year-over-year growth 2025-2030 (%)

13.4.3 UK - Market size and forecast 2025-2030

Chart on UK - Market size and forecast 2025-2030 ($ million)
Data Table on UK - Market size and forecast 2025-2030 ($ million)
Chart on UK - Year-over-year growth 2025-2030 (%)
Data Table on UK - Year-over-year growth 2025-2030 (%)

13.4.4 France - Market size and forecast 2025-2030

Chart on France - Market size and forecast 2025-2030 ($ million)
Data Table on France - Market size and forecast 2025-2030 ($ million)
Chart on France - Year-over-year growth 2025-2030 (%)
Data Table on France - Year-over-year growth 2025-2030 (%)

13.4.5 Italy - Market size and forecast 2025-2030

Chart on Italy - Market size and forecast 2025-2030 ($ million)
Data Table on Italy - Market size and forecast 2025-2030 ($ million)
Chart on Italy - Year-over-year growth 2025-2030 (%)
Data Table on Italy - Year-over-year growth 2025-2030 (%)

13.4.6 Russia - Market size and forecast 2025-2030

Chart on Russia - Market size and forecast 2025-2030 ($ million)
Data Table on Russia - Market size and forecast 2025-2030 ($ million)
Chart on Russia - Year-over-year growth 2025-2030 (%)
Data Table on Russia - Year-over-year growth 2025-2030 (%)

13.5 APAC - Market size and forecast 2025-2030

Chart on APAC - Market size and forecast 2025-2030 ($ million)
Data Table on APAC - Market size and forecast 2025-2030 ($ million)
Chart on APAC - Year-over-year growth 2025-2030 (%)
Data Table on APAC - Year-over-year growth 2025-2030 (%)
Chart on Regional Comparison - APAC
Data Table on Regional Comparison - APAC

13.5.1 China - Market size and forecast 2025-2030

Chart on China - Market size and forecast 2025-2030 ($ million)
Data Table on China - Market size and forecast 2025-2030 ($ million)
Chart on China - Year-over-year growth 2025-2030 (%)
Data Table on China - Year-over-year growth 2025-2030 (%)

13.5.2 Japan - Market size and forecast 2025-2030

Chart on Japan - Market size and forecast 2025-2030 ($ million)
Data Table on Japan - Market size and forecast 2025-2030 ($ million)
Chart on Japan - Year-over-year growth 2025-2030 (%)
Data Table on Japan - Year-over-year growth 2025-2030 (%)

13.5.3 India - Market size and forecast 2025-2030

Chart on India - Market size and forecast 2025-2030 ($ million)
Data Table on India - Market size and forecast 2025-2030 ($ million)
Chart on India - Year-over-year growth 2025-2030 (%)
Data Table on India - Year-over-year growth 2025-2030 (%)

13.5.4 South Korea - Market size and forecast 2025-2030

Chart on South Korea - Market size and forecast 2025-2030 ($ million)
Data Table on South Korea - Market size and forecast 2025-2030 ($ million)
Chart on South Korea - Year-over-year growth 2025-2030 (%)
Data Table on South Korea - Year-over-year growth 2025-2030 (%)

13.5.5 Australia - Market size and forecast 2025-2030

Chart on Australia - Market size and forecast 2025-2030 ($ million)
Data Table on Australia - Market size and forecast 2025-2030 ($ million)
Chart on Australia - Year-over-year growth 2025-2030 (%)
Data Table on Australia - Year-over-year growth 2025-2030 (%)

13.5.6 Thailand - Market size and forecast 2025-2030

Chart on Thailand - Market size and forecast 2025-2030 ($ million)
Data Table on Thailand - Market size and forecast 2025-2030 ($ million)
Chart on Thailand - Year-over-year growth 2025-2030 (%)
Data Table on Thailand - Year-over-year growth 2025-2030 (%)

13.6 Middle East and Africa - Market size and forecast 2025-2030

Chart on Middle East and Africa - Market size and forecast 2025-2030 ($ million)
Data Table on Middle East and Africa - Market size and forecast 2025-2030 ($ million)
Chart on Middle East and Africa - Year-over-year growth 2025-2030 (%)
Data Table on Middle East and Africa - Year-over-year growth 2025-2030 (%)
Chart on Regional Comparison - Middle East and Africa
Data Table on Regional Comparison - Middle East and Africa

13.6.1 Saudi Arabia - Market size and forecast 2025-2030

Chart on Saudi Arabia - Market size and forecast 2025-2030 ($ million)
Data Table on Saudi Arabia - Market size and forecast 2025-2030 ($ million)
Chart on Saudi Arabia - Year-over-year growth 2025-2030 (%)
Data Table on Saudi Arabia - Year-over-year growth 2025-2030 (%)

13.6.2 UAE - Market size and forecast 2025-2030

Chart on UAE - Market size and forecast 2025-2030 ($ million)
Data Table on UAE - Market size and forecast 2025-2030 ($ million)
Chart on UAE - Year-over-year growth 2025-2030 (%)
Data Table on UAE - Year-over-year growth 2025-2030 (%)

13.6.3 Israel - Market size and forecast 2025-2030

Chart on Israel - Market size and forecast 2025-2030 ($ million)
Data Table on Israel - Market size and forecast 2025-2030 ($ million)
Chart on Israel - Year-over-year growth 2025-2030 (%)
Data Table on Israel - Year-over-year growth 2025-2030 (%)

13.6.4 South Africa - Market size and forecast 2025-2030

Chart on South Africa - Market size and forecast 2025-2030 ($ million)
Data Table on South Africa - Market size and forecast 2025-2030 ($ million)
Chart on South Africa - Year-over-year growth 2025-2030 (%)
Data Table on South Africa - Year-over-year growth 2025-2030 (%)

13.6.5 Turkey - Market size and forecast 2025-2030

Chart on Turkey - Market size and forecast 2025-2030 ($ million)
Data Table on Turkey - Market size and forecast 2025-2030 ($ million)
Chart on Turkey - Year-over-year growth 2025-2030 (%)
Data Table on Turkey - Year-over-year growth 2025-2030 (%)

13.7 South America - Market size and forecast 2025-2030

Chart on South America - Market size and forecast 2025-2030 ($ million)
Data Table on South America - Market size and forecast 2025-2030 ($ million)
Chart on South America - Year-over-year growth 2025-2030 (%)
Data Table on South America - Year-over-year growth 2025-2030 (%)
Chart on Regional Comparison - South America
Data Table on Regional Comparison - South America

13.7.1 Brazil - Market size and forecast 2025-2030

Chart on Brazil - Market size and forecast 2025-2030 ($ million)
Data Table on Brazil - Market size and forecast 2025-2030 ($ million)
Chart on Brazil - Year-over-year growth 2025-2030 (%)
Data Table on Brazil - Year-over-year growth 2025-2030 (%)

13.7.2 Argentina - Market size and forecast 2025-2030

Chart on Argentina - Market size and forecast 2025-2030 ($ million)
Data Table on Argentina - Market size and forecast 2025-2030 ($ million)
Chart on Argentina - Year-over-year growth 2025-2030 (%)
Data Table on Argentina - Year-over-year growth 2025-2030 (%)

13.7.3 Colombia - Market size and forecast 2025-2030

Chart on Colombia - Market size and forecast 2025-2030 ($ million)
Data Table on Colombia - Market size and forecast 2025-2030 ($ million)
Chart on Colombia - Year-over-year growth 2025-2030 (%)
Data Table on Colombia - Year-over-year growth 2025-2030 (%)

13.8 Market opportunity by geography

Market opportunity by geography ($ million)
Data Tables on Market opportunity by geography ($ million)

14. Drivers, Challenges, and Opportunity

14.1 Market drivers

Delayed conception and rising global infertility
Clinical embryology innovations and improved outcomes
Financial accessibility and inclusive family building

14.2 Market challenges

High out-of-pocket costs and inconsistent reimbursement
Regulatory fragmentation and bioethical challenges
Embryology talent shortages and high lab costs

14.3 Impact of drivers and challenges

Impact of drivers and challenges in 2025 and 2030

14.4 Market opportunities

Fertility preservation and elective cryopreservation
AI, microfluidics, and precision embryology diagnostics
Employer fertility benefits and specialized financing

15. Competitive Landscape

15.1 Overview

15.2

Overview on criticality of inputs and factors of differentiation

15.3 Landscape disruption

Overview on factors of disruption

15.4 Industry risks

Impact of key risks on business

16. Competitive Analysis

16.1 Companies profiled

Companies covered

16.2 Company ranking index

16.3 Market positioning of companies

Matrix on companies position and classification

16.4 CARE Fertility Group Ltd.

CARE Fertility Group Ltd. - Overview
CARE Fertility Group Ltd. - Product / Service
CARE Fertility Group Ltd. - Key offerings
SWOT

16.5 CCRM Fertility

CCRM Fertility - Overview
CCRM Fertility - Product / Service
CCRM Fertility - Key offerings
SWOT

16.6 ConceiveAbilities

ConceiveAbilities - Overview
ConceiveAbilities - Product / Service
ConceiveAbilities - Key offerings
SWOT

16.7 Cryos International Denmark ApS

Cryos International Denmark ApS - Overview
Cryos International Denmark ApS - Product / Service
Cryos International Denmark ApS - Key offerings
SWOT

16.8 Eugin Group

Eugin Group - Overview
Eugin Group - Product / Service
Eugin Group - Key offerings
SWOT

16.9 FutureLife

FutureLife - Overview
FutureLife - Product / Service
FutureLife - Key offerings
SWOT

16.10 Inception Fertility

Inception Fertility - Overview
Inception Fertility - Product / Service
Inception Fertility - Key offerings
SWOT

16.11 Iswarya Fertility Centre

Iswarya Fertility Centre - Overview
Iswarya Fertility Centre - Product / Service
Iswarya Fertility Centre - Key offerings
SWOT

16.12 IVI Institute

IVI Institute - Overview
IVI Institute - Product / Service
IVI Institute - Key offerings
SWOT

16.13 Kindbody

Kindbody - Overview
Kindbody - Product / Service
Kindbody - Key offerings
SWOT

16.14 Medicover AB

Medicover AB - Overview
Medicover AB - Business segments
Medicover AB - Key offerings
Medicover AB - Segment focus
SWOT

16.15 Monash IVF Group Ltd.

Monash IVF Group Ltd. - Overview
Monash IVF Group Ltd. - Business segments
Monash IVF Group Ltd. - Key offerings
Monash IVF Group Ltd. - Segment focus
SWOT

16.16 Nova IVF Fertility Private Ltd.

Nova IVF Fertility Private Ltd. - Overview
Nova IVF Fertility Private Ltd. - Product / Service
Nova IVF Fertility Private Ltd. - Key offerings
SWOT

16.17 Pinnacle Fertility

Pinnacle Fertility - Overview
Pinnacle Fertility - Product / Service
Pinnacle Fertility - Key offerings
SWOT

16.18 Thomson Medical Group

Thomson Medical Group - Overview
Thomson Medical Group - Product / Service
Thomson Medical Group - Key offerings
SWOT

17. Appendix

17.1 Scope of the report

Market definition
Objectives
Notes and caveats

17.2 Inclusions and exclusions checklist

Inclusions checklist
Exclusions checklist

17.3 Currency conversion rates for US$

17.4 Research methodology

17.5 Data procurement

Information sources

17.6 Data validation

17.7 Validation techniques employed for market sizing

17.8 Data synthesis

17.9 360 degree market analysis

17.10 List of abbreviations

Research Methodology

Technavio presents a detailed picture of the market by way of study, synthesis, and summation of data from multiple sources. The analysts have presented the various facets of the market with a particular focus on identifying the key industry influencers. The data thus presented is comprehensive, reliable, and the result of extensive research, both primary and secondary.

INFORMATION SOURCES

Primary sources

  • Manufacturers and suppliers
  • Channel partners
  • Industry experts
  • Strategic decision makers

Secondary sources

  • Industry journals and periodicals
  • Government data
  • Financial reports of key industry players
  • Historical data
  • Press releases

DATA ANALYSIS

Data Synthesis

  • Collation of data
  • Estimation of key figures
  • Analysis of derived insights

Data Validation

  • Triangulation with data models
  • Reference against proprietary databases
  • Corroboration with industry experts

REPORT WRITING

Qualitative

  • Market drivers
  • Market challenges
  • Market trends
  • Five forces analysis

Quantitative

  • Market size and forecast
  • Market segmentation
  • Geographical insights
  • Competitive landscape

Interested in this report?

Get your sample now to see our research methodology and insights!

Download Now

Frequently Asked Questions

Fertility Services market growth will increase by USD 9583.9 million during 2026-2030.

The Fertility Services market is expected to grow at a CAGR of 7.4% during 2026-2030.

Fertility Services market is segmented by Service (Treatment services, Testing and storage services, Others) End-user (Fertility clinics, Hospitals, Surgical centers, Clinical research institutes) Method (In-vitro fertilization, Artificial insemination) Gender (Female, Male)

CARE Fertility Group Ltd., CCRM Fertility, ConceiveAbilities, Cryos International Denmark ApS, Eugin Group, Fairfax EggBank, FutureLife, Inception Fertility, Iswarya Fertility Centre, IVI Institute, Kindbody, Medicover AB, Monash IVF Group Ltd., Nova IVF Fertility Private Ltd., Pinnacle Fertility, Spring Fertility, TFP Fertility, Thomson Medical Group are a few of the key vendors in the Fertility Services market.

North America will register the highest growth rate of 34.6% among the other regions. Therefore, the Fertility Services market in North America is expected to garner significant business opportunities for the vendors during the forecast period.

US, Canada, Mexico, Spain, Germany, UK, France, Italy, Russia, China, Japan, India, South Korea, Australia, Thailand, Saudi Arabia, UAE, Israel, South Africa, Turkey, Brazil, Argentina, Colombia

  • Delayed conception and rising global infertility is the driving factor this market.

The Fertility Services market vendors should focus on grabbing business opportunities from the Service segment as it accounted for the largest market share in the base year.
RIA - Research AI Assistant
Ask RIA
