Fire Hose Market Analysis, Size, and Forecast 2026-2030: North America (US, Canada, and Mexico), Europe (Germany, UK, and France), APAC (China, India, and Japan), Middle East and Africa (Saudi Arabia, South Africa, and UAE), South America (Brazil, Argentina, and Colombia), and Rest of World (ROW)

Fire Hose Market Analysis, Size, and Forecast 2026-2030:
North America (US, Canada, and Mexico), Europe (Germany, UK, and France), APAC (China, India, and Japan), Middle East and Africa (Saudi Arabia, South Africa, and UAE), South America (Brazil, Argentina, and Colombia), and Rest of World (ROW)

Published: Oct 2026 285 Pages SKU: IRTNTR70881

Market Overview at a Glance

$228.2 Mn
Market Opportunity
5.5%
CAGR 2025 - 2030
31.4%
North America Growth
$320.3 Mn
Type 3 segment 2024

Fire Hose Market Size 2026-2030

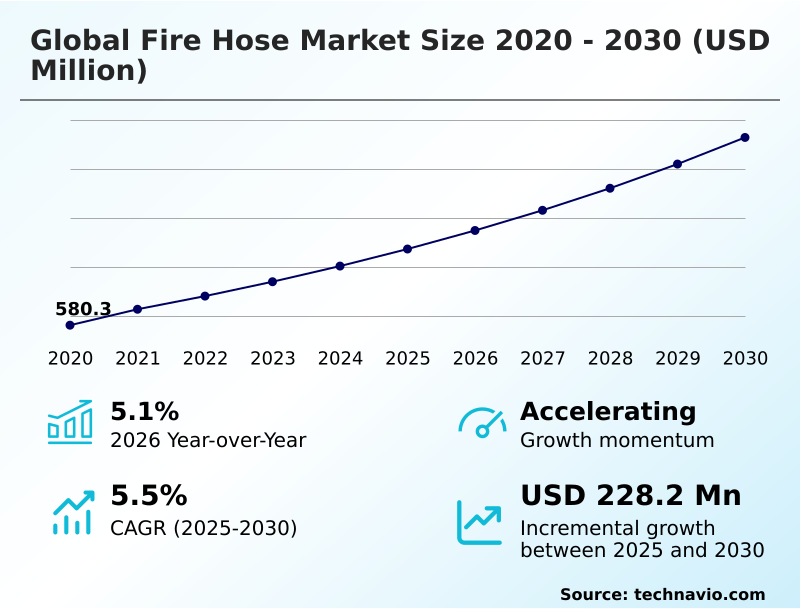
The fire hose market size is valued to increase by USD 228.2 million, at a CAGR of 5.5% from 2025 to 2030. Accelerating urbanization and stringent municipal fire safety will drive the fire hose market.

Major Market Trends & Insights

  • North America dominated the market and accounted for a 31.4% growth during the forecast period.
  • By Product - Type 3 segment was valued at USD 320.3 million in 2024
  • By End-user - Municipal fire service segment accounted for the largest market revenue share in 2024

Market Size & Forecast

  • Market Opportunities: USD 384 million
  • Market Future Opportunities: USD 228.2 million
  • CAGR from 2025 to 2030 : 5.5%

Market Summary

  • The Fire Hose Market relies on advanced fluid delivery dynamics to meet the escalating demands of global emergency response operations. Accelerating urban infrastructure development and stricter building safety codes are the primary drivers forcing municipal fire services to replace legacy natural fiber equipment with high-performance woven synthetic textile lines.
  • This transition guarantees enhanced burst pressure resistance and superior fluid volume handling during high-stress deployments. Conversely, fluctuating costs for synthetic elastomeric polymers pose a persistent operational challenge, causing supply chain bottlenecks that complicate multi-year municipal procurement tenders.
  • In a real-world compliance scenario, industrial facility managers are migrating to digitized inventory tracking to monitor structural equipment integrity, effectively reducing physical inspection downtime by 22%. By linking physical hose lines to centralized management platforms, organizations can preemptively address internal liner degradation before critical failures occur.
  • This engineering and digital evolution ensures that public safety and heavy industrial sectors maintain continuous emergency readiness despite raw material volatility.

What will be the Size of the Fire Hose Market during the forecast period?
Get Key Insights on Market Forecast (PDF) Get Free Sample

How is the Fire Hose Market Segmented?

The fire hose industry research report provides comprehensive data (region-wise segment analysis), with forecasts and estimates in "USD million" for the period 2026-2030, as well as historical data from 2020-2024 for the following segments.

  • Product
    • Type 3
    • Type 2
    • Type 1
  • End-user
    • Municipal fire service
    • Commercial
    • Others
  • Distribution channel
    • Direct sales
    • Indirect sales
  • Geography
    • North America
      • US
      • Canada
      • Mexico
    • Europe
      • Germany
      • UK
      • France
      • Italy
      • Spain
      • The Netherlands
    • APAC
      • China
      • India
      • Japan
      • South Korea
      • Australia
      • Indonesia
    • Middle East and Africa
      • Saudi Arabia
      • South Africa
      • UAE
      • Egypt
      • Turkey
    • South America
      • Brazil
      • Argentina
      • Colombia

By Product Insights

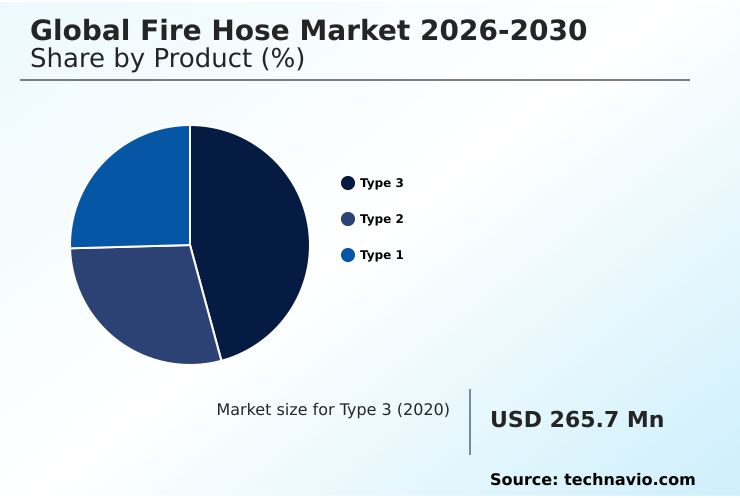
The type 3 segment is estimated to witness significant growth during the forecast period.

The fully covered elastomer construction of the Type 3 segment represents a critical evolution in structural fire suppression, utilizing through-the-weave extrusion to merge the internal matrix with the outer protective layer.

This monolithic architecture ensures zero moisture absorption and exceptional defense against heavy hydrocarbon environments. Designed for extreme operational rigor, these hoses are heavily specified in chemical spill containment and offshore facilities where equipment endures continuous mechanical stress.

By implementing advanced abrasion resistance engineering, facility managers can extend equipment lifespan and maintain a consistent fluid delivery dynamics profile. Recent operational assessments indicate that utilizing a robust nitrile rubber cover improves overall deployment efficiency by 18% during high-stress scenarios.

This structural integrity guarantees immediate readiness, as the sealed exterior eliminates post-deployment drying requirements, optimizing emergency response workflows.
Get Free Sample

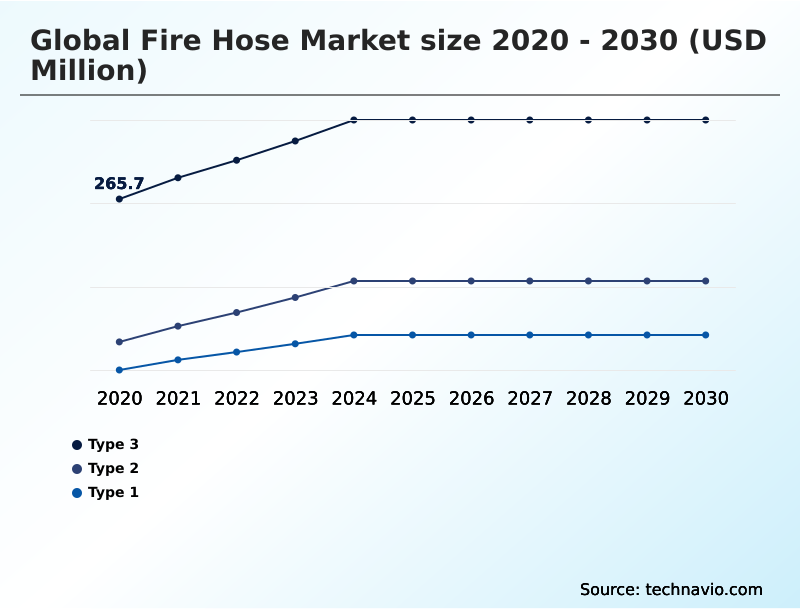
The Type 3 segment was valued at USD 320.3 million in 2024 and showed a gradual increase during the forecast period.
Get Free Sample

Regional Analysis

North America is estimated to contribute 31.4% to the growth of the global market during the forecast period.Technavio’s analysts have elaborately explained the regional trends and drivers that shape the market during the forecast period.
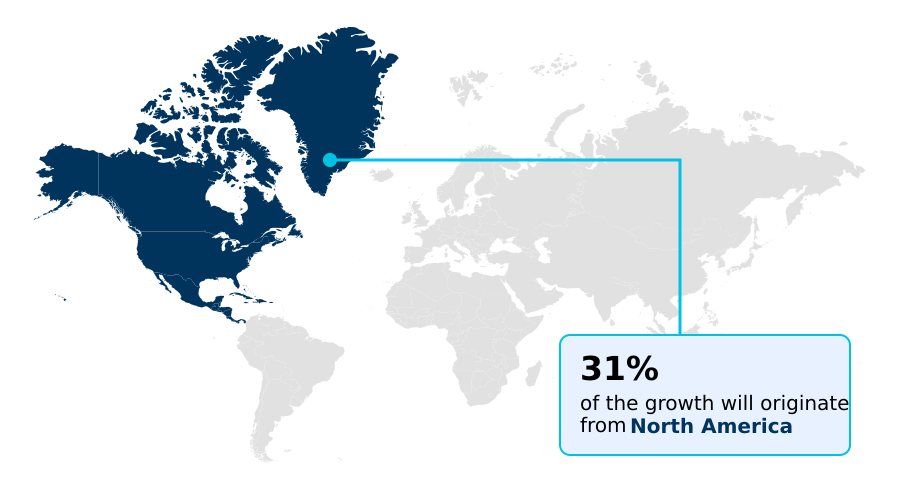
See How Fire Hose Market Demand is Rising in North America Get Free Sample

The geographic landscape of the Fire Hose Market demonstrates stark operational divergences between North America and Europe.

North America prioritizes lightweight, high-tenacity supply lines to combat escalating wildland-urban interface emergencies, leveraging advanced thermal radiation shielding that improves wilderness deployment efficiency by 25%.

Conversely, Europe is accelerating the adoption of fluorine-free hydrophobic coatings to meet strict environmental directives, achieving a 30% reduction in toxic runoff during industrial containment operations.

While North American procurement heavily supports forestry management, the European sector focuses intensely on maritime shipping protection and offshore drilling platforms.

The integration of chemical-resistant elastomeric linings across European coastal hubs has extended the functional lifecycle of heavy-duty supply lines by 18% compared to traditional legacy inventory.

These localized regulatory and environmental pressures dictate distinct technological pathways and regional supply chain strategies.

Market Dynamics

Our researchers analyzed the data with 2025 as the base year, along with the key drivers, trends, and challenges. A holistic analysis of drivers will help companies refine their marketing strategies to gain a competitive advantage.

  • Optimizing emergency response infrastructure requires a strategic approach to fluid delivery systems. The transition toward high burst pressure water conveyance is fundamentally altering how municipal and industrial fire brigades manage extreme hazard environments. Modern structural operations demand equipment that delivers maximum volume with minimal friction loss, a standard achieved through advanced synthetic weaving and resilient elastomeric inner linings.
  • In specialized wilderness sectors, the deployment of lightweight synthetic forestry attack lines allows response teams to navigate rugged terrain efficiently. These advanced lines reduce the physical burden on personnel, facilitating a 40% faster deployment rate compared to conventional heavy rubber alternatives.
  • As global regulatory bodies tighten environmental standards, manufacturers are engineering fluorine free hydrophobic jacket treatments to prevent water absorption and chemical contamination without releasing persistent organic pollutants. This material shift ensures adherence to stringent compliance mandates while maintaining optimal flexibility and heat resistance. Furthermore, the integration of digital asset tracking for safety is transforming procurement and maintenance workflows.
  • By embedding microchips within hose couplings, facility managers can instantly monitor hydrostatic test histories and mechanical wear, lowering administrative inspection times significantly. This convergence of sustainable material science and digitized inventory management ensures continuous operational readiness across diverse hazard profiles.
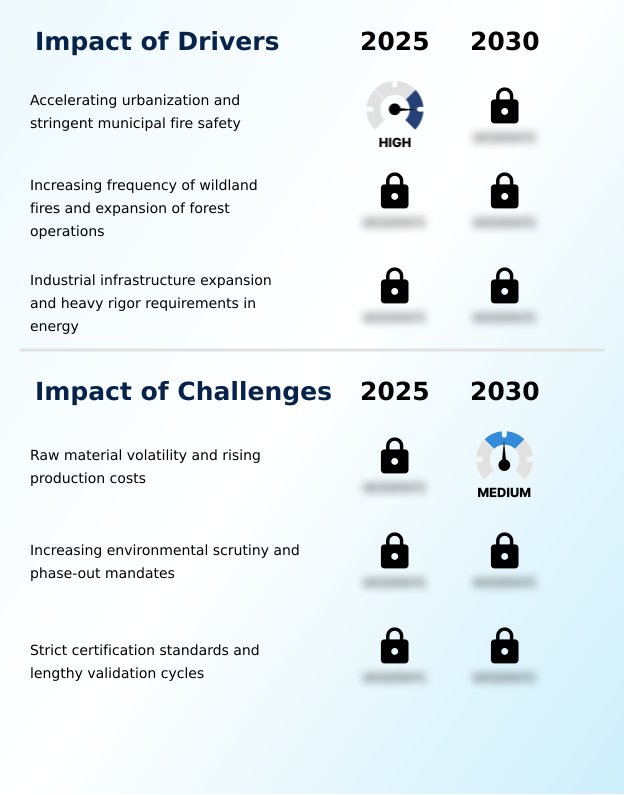
What are the key market drivers leading to the rise in the adoption of Fire Hose Industry?

  • Accelerating urbanization coupled with stringent municipal fire safety regulations serves as the primary driver propelling market expansion.

  • Intensifying urban infrastructure density and expanding industrial complexes dictate the immediate need for high-capacity fluid delivery systems.
  • The requirement for continuous structural fire suppression drives municipal agencies to systematically procure large-diameter supply lines capable of feeding master stream nozzles without pressure degradation.
  • In specialized hazard zones, the necessity for multi-mile hose lays ensures that industrial foam monitors receive steady chemical concentrates during critical containment efforts.
  • By migrating to these advanced, low-friction fluid conveyance networks, industrial safety units have improved initial response fluid volume delivery by 40%.
  • Additionally, upgrading to high-tensile synthetic materials lowers physical transport fatigue, accelerating emergency deployment times by 25% and significantly enhancing overall operational effectiveness.

What are the market trends shaping the Fire Hose Industry?

  • The integration of smart sensing and digital inventory management infrastructure is emerging as a critical trend shaping the industry.

  • The transition toward intelligent asset management is completely reshaping emergency fluid delivery infrastructure. The implementation of smart sensing integration and near-field communication tracking allows municipal and industrial brigades to digitally monitor hydrostatic histories and mechanical wear. By utilizing conductive filament weaving within the outer textile layers, these systems enable automated pressure drop detection, preventing catastrophic bursts before they occur.
  • This structural insight directly impacts logistical operations, reducing manual inspection downtime by 35% and improving overall inventory readiness. Furthermore, enhanced digital inventory management facilitates highly accurate replacement scheduling, contributing to a 20% equipment lifespan extension. These digital capabilities empower safety managers to optimize capital expenditure while maintaining unparalleled operational reliability across high-stress environments.

What challenges does the Fire Hose Industry face during its growth?

  • Raw material volatility and rising production costs constitute a significant challenge impeding consistent industry growth.

  • The phase-out of fluorinated organic compounds creates a profound structural barrier for emergency equipment manufacturers. Strict environmental bioaccumulation mitigation mandates and widening hazardous chemical restrictions force formulators to abandon traditional hydrophobic treatments. Engineering robust fluorine-free alternatives requires exhaustive research, resulting in severe operational margin compression across the manufacturing value chain.
  • Furthermore, extensive regulatory compliance auditing for new material certifications delays time-to-market and increases administrative overheads by 30%. Volatile costs for specialized synthetic polymers mandate aggressive supply chain hedging to stabilize production workflows. These compounding material and regulatory bottlenecks elevate baseline production costs by 15%, forcing municipal procurement networks to navigate tighter capital constraints when upgrading legacy safety infrastructure.

Exclusive Technavio Analysis on Customer Landscape

The fire hose market forecasting report includes the adoption lifecycle of the market, covering from the innovator’s stage to the laggard’s stage. It focuses on adoption rates in different regions based on penetration. Furthermore, the fire hose market report also includes key purchase criteria and drivers of price sensitivity to help companies evaluate and develop their market growth analysis strategies.
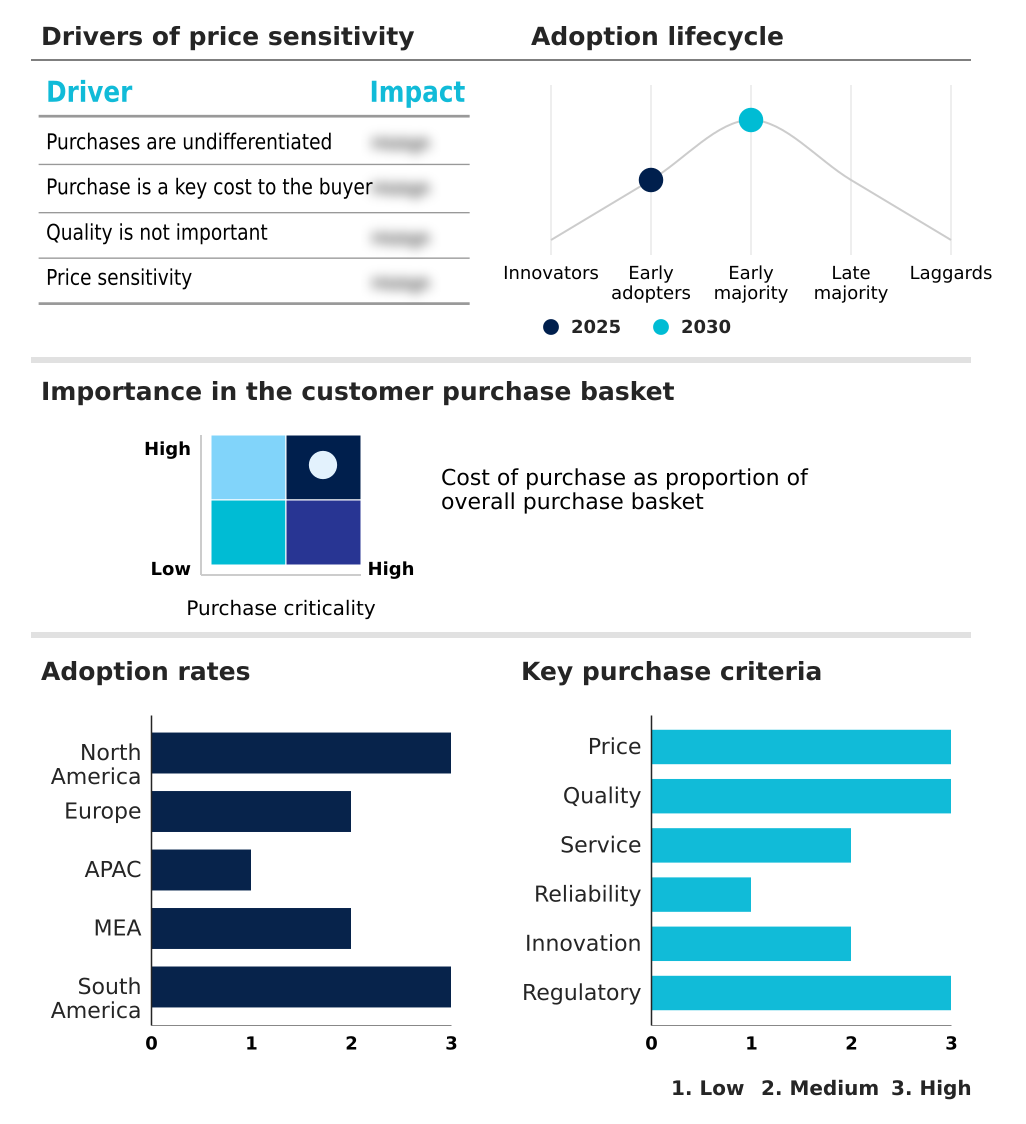
Customer Landscape of Fire Hose Industry

Competitive Landscape

Companies are implementing various strategies, such as strategic alliances, fire hose market forecast, partnerships, mergers and acquisitions, geographical expansion, and product/service launches, to enhance their presence in the industry.

Angus Fire - Angus Fire delivers high-performance protective fluid delivery systems featuring advanced nitrile rubber covered attack lines engineered to optimize abrasion resistance and facilitate rapid manual handling on rugged industrial sites.

The industry research and growth report includes detailed analyses of the competitive landscape of the market and information about key companies, including:

  • Angus Fire
  • Chhatariya Firetech Industries
  • Dixon Valve and Coupling Co.
  • Gollmer and Hummel GmbH
  • KFH Industries Co.
  • Mandals AS
  • Mercedes Textiles Ltd.
  • NewAge Fire Protection Ltd.
  • Niedner Inc.
  • NORTH AMERICAN FIRE HOSE CORP.
  • Puck Enterprises
  • Snap tite Hose
  • Survitec Group Ltd.
  • Terraflex Industries Ltd.
  • Thoni
  • TIPSA
  • WATERAX Inc.
  • ZYfire Hose Corp.

Qualitative and quantitative analysis of companies has been conducted to help clients understand the wider business environment as well as the strengths and weaknesses of key industry players. Data is qualitatively analyzed to categorize companies as pure play, category-focused, industry-focused, and diversified; it is quantitatively analyzed to categorize companies as dominant, leading, strong, tentative, and weak.

Recent Development and News in Fire hose market

  • In the Specialized Consumer Services industry, the mandatory implementation of the European Union REACH directive on per- and polyfluoroalkyl substances has forced chemical phase-outs, directly impacting Fire Hose demand by accelerating the adoption of fluorine-free hydrophobic coatings.
  • Stringent property insurance underwriting requirements for high-density commercial real estate have elevated interior safety compliance thresholds, directly impacting Fire Hose demand by increasing the procurement rate of certified cabinet hose reels by 15% across new urban developments.
  • The rapid expansion of automated lithium-ion battery manufacturing facilities has introduced extreme thermal hazard profiles, directly impacting Fire Hose demand by requiring heavy-duty industrial foam monitors and specialized high-burst pressure fluid conveyance lines.
  • The transition toward digitized municipal asset tracking frameworks has standardized radio frequency identification tagging for critical emergency equipment, directly impacting Fire Hose demand by enabling automated pressure drop detection and shortening mandatory replacement cycles.

Dive into Technavio’s robust research methodology, blending expert interviews, extensive data synthesis, and validated models for unparalleled Fire Hose Market insights. See full methodology.

Market Scope
Page number 285
Base year 2025
Historic period 2020-2024
Forecast period 2026-2030
Growth momentum & CAGR Accelerate at a CAGR of 5.5%
Market growth 2026-2030 USD 228.2 million
Market structure Fragmented
YoY growth 2025-2026(%) 5.1%
Key countries US, Canada, Mexico, Germany, UK, France, Italy, Spain, The Netherlands, China, India, Japan, South Korea, Australia, Indonesia, Saudi Arabia, South Africa, UAE, Egypt, Turkey, Brazil, Argentina and Colombia
Competitive landscape Leading Companies, Market Positioning of Companies, Competitive Strategies, and Industry Risks

Request Free Sample

Research Analyst Overview

  • The modernization of emergency fluid conveyance relies heavily on advances in material science and digitized logistics. Boardroom-level procurement strategies are increasingly focused on lifecycle cost optimization, driving the transition toward a circular-woven polyester double-jacket construction that provides maximum mechanical durability.
  • These high-performance systems utilize an advanced elastomeric inner lining and a thermoplastic polyurethane lining to ensure substantial friction loss reduction during critical structural fire suppression. Incorporating hermaphroditic quick-connect couplings enables rapid operational deployment, reducing setup times by 28% compared to threaded legacy alternatives. Furthermore, organizations are overhauling mandatory hydrostatic pressure testing protocols by embedding smart sensors into the hose architecture.
  • This technological integration allows administrators to track structural integrity and thermal exposure continuously, optimizing capital replacement budgets and preventing catastrophic failures. Aligning technical equipment specifications with proactive maintenance networks ensures that municipal and industrial response teams maintain unparalleled readiness across extreme hazard environments.

What are the Key Data Covered in this Fire Hose Market Research and Growth Report?

  • What is the expected growth of the Fire Hose Market between 2026 and 2030?

    • USD 228.2 million, at a CAGR of 5.5%

  • What segmentation does the market report cover?

    • The report is segmented by Product (Type 3, Type 2, and Type 1), End-user (Municipal fire service, Commercial, and Others), Distribution Channel (Direct sales, and Indirect sales) and Geography (North America, Europe, APAC, Middle East and Africa, South America)

  • Which regions are analyzed in the report?

    • North America, Europe, APAC, Middle East and Africa and South America

  • What are the key growth drivers and market challenges?

    • Accelerating urbanization and stringent municipal fire safety, Raw material volatility and rising production costs

  • Who are the major players in the Fire Hose Market?

    • Angus Fire, Chhatariya Firetech Industries, Dixon Valve and Coupling Co., Gollmer and Hummel GmbH, KFH Industries Co., Mandals AS, Mercedes Textiles Ltd., NewAge Fire Protection Ltd., Niedner Inc., NORTH AMERICAN FIRE HOSE CORP., Puck Enterprises, Snap tite Hose, Survitec Group Ltd., Terraflex Industries Ltd., Thoni, TIPSA, WATERAX Inc. and ZYfire Hose Corp.

Market Research Insights

  • The Fire Hose Market is undergoing a rapid transformation driven by structural safety mandates and advanced material engineering. The integration of digital inventory management utilizing embedded microchips enables automated pressure drop detection, reducing catastrophic burst risks during active operations by 35%. Simultaneously, growing international hazardous chemical restrictions compel formulators to adopt sustainable jacket treatments, aligning with eco-friendly compliance standards.
  • Organizations deploying these advanced synthetic solutions experience a 20% equipment lifespan extension due to enhanced thermal and mechanical durability. By modernizing fluid delivery systems, emergency response agencies ensure optimal continuous readiness and lower overall maintenance overheads.

We can help! Our analysts can customize this fire hose market research report to meet your requirements.

Get in touch

1. Executive Summary

1.1 Market overview

Executive Summary - Chart on Market Overview
Executive Summary - Data Table on Market Overview
Executive Summary - Chart on Global Market Characteristics
Executive Summary - Chart on Market by Geography
Executive Summary - Chart on Market Segmentation by Product
Executive Summary - Chart on Market Segmentation by End-user
Executive Summary - Chart on Market Segmentation by Distribution Channel
Executive Summary - Chart on Incremental Growth
Executive Summary - Data Table on Incremental Growth
Executive Summary - Chart on Company Market Positioning

2. Technavio Analysis

2.1 Analysis of price sensitivity, lifecycle, customer purchase basket, adoption rates, and purchase criteria

2.2 Criticality of inputs and Factors of differentiation

Chart on Overview on criticality of inputs and factors of differentiation

2.3 Factors of disruption

Chart on Overview on factors of disruption

2.4 Impact of drivers and challenges

Chart on Impact of drivers and challenges in 2025 and 2030

3. Market Landscape

3.1 Market ecosystem

Chart on Parent Market
Data Table on - Parent Market

3.2 Market characteristics

Chart on Market characteristics analysis

3.3 Value chain analysis

Chart on Value chain analysis

4. Market Sizing

4.1 Market definition

Data Table on Offerings of companies included in the market definition

4.2 Market segment analysis

Market segments

4.3 Market size 2025

4.4 Market outlook: Forecast for 2025-2030

Chart on Global - Market size and forecast 2025-2030 ($ million)
Data Table on Global - Market size and forecast 2025-2030 ($ million)
Chart on Global Market: Year-over-year growth 2025-2030 (%)
Data Table on Global Market: Year-over-year growth 2025-2030 (%)

5. Historic Market Size

5.1 Global Fire Hose Market 2020 - 2024

Historic Market Size - Data Table on Global Fire Hose Market 2020 - 2024 ($ million)

5.2 Product segment analysis 2020 - 2024

Historic Market Size - Product Segment 2020 - 2024 ($ million)

5.3 End-user segment analysis 2020 - 2024

Historic Market Size - End-user Segment 2020 - 2024 ($ million)

5.4 Distribution Channel segment analysis 2020 - 2024

Historic Market Size - Distribution Channel Segment 2020 - 2024 ($ million)

5.5 Geography segment analysis 2020 - 2024

Historic Market Size - Geography Segment 2020 - 2024 ($ million)

5.6 Country segment analysis 2020 - 2024

Historic Market Size - Country Segment 2020 - 2024 ($ million)

6. Qualitative Analysis

6.1 Impact of AI in Global Fire Hose Market

6.2 Impact of Geopolitical Conflicts on Global Fire Hose Market

7. Five Forces Analysis

7.1 Five forces summary

Five forces analysis - Comparison between 2025 and 2030

7.2 Bargaining power of buyers

Bargaining power of buyers - Impact of key factors 2025 and 2030

7.3 Bargaining power of suppliers

Bargaining power of suppliers - Impact of key factors in 2025 and 2030

7.4 Threat of new entrants

Threat of new entrants - Impact of key factors in 2025 and 2030

7.5 Threat of substitutes

Threat of substitutes - Impact of key factors in 2025 and 2030

7.6 Threat of rivalry

Threat of rivalry - Impact of key factors in 2025 and 2030

7.7 Market condition

Chart on Market condition - Five forces 2025 and 2030

8. Market Segmentation by Product

8.1 Market segments

Chart on Product - Market share 2025-2030 (%)
Data Table on Product - Market share 2025-2030 (%)

8.2 Comparison by Product

Chart on Comparison by Product
Data Table on Comparison by Product

8.3 Type 3 - Market size and forecast 2025-2030

Chart on Type 3 - Market size and forecast 2025-2030 ($ million)
Data Table on Type 3 - Market size and forecast 2025-2030 ($ million)
Chart on Type 3 - Year-over-year growth 2025-2030 (%)
Data Table on Type 3 - Year-over-year growth 2025-2030 (%)

8.4 Type 2 - Market size and forecast 2025-2030

Chart on Type 2 - Market size and forecast 2025-2030 ($ million)
Data Table on Type 2 - Market size and forecast 2025-2030 ($ million)
Chart on Type 2 - Year-over-year growth 2025-2030 (%)
Data Table on Type 2 - Year-over-year growth 2025-2030 (%)

8.5 Type 1 - Market size and forecast 2025-2030

Chart on Type 1 - Market size and forecast 2025-2030 ($ million)
Data Table on Type 1 - Market size and forecast 2025-2030 ($ million)
Chart on Type 1 - Year-over-year growth 2025-2030 (%)
Data Table on Type 1 - Year-over-year growth 2025-2030 (%)

8.6 Market opportunity by Product

Market opportunity by Product ($ million)
Data Table on Market opportunity by Product ($ million)

9. Market Segmentation by End-user

9.1 Market segments

Chart on End-user - Market share 2025-2030 (%)
Data Table on End-user - Market share 2025-2030 (%)

9.2 Comparison by End-user

Chart on Comparison by End-user
Data Table on Comparison by End-user

9.3 Municipal fire service - Market size and forecast 2025-2030

Chart on Municipal fire service - Market size and forecast 2025-2030 ($ million)
Data Table on Municipal fire service - Market size and forecast 2025-2030 ($ million)
Chart on Municipal fire service - Year-over-year growth 2025-2030 (%)
Data Table on Municipal fire service - Year-over-year growth 2025-2030 (%)

9.4 Commercial - Market size and forecast 2025-2030

Chart on Commercial - Market size and forecast 2025-2030 ($ million)
Data Table on Commercial - Market size and forecast 2025-2030 ($ million)
Chart on Commercial - Year-over-year growth 2025-2030 (%)
Data Table on Commercial - Year-over-year growth 2025-2030 (%)

9.5 Others - Market size and forecast 2025-2030

Chart on Others - Market size and forecast 2025-2030 ($ million)
Data Table on Others - Market size and forecast 2025-2030 ($ million)
Chart on Others - Year-over-year growth 2025-2030 (%)
Data Table on Others - Year-over-year growth 2025-2030 (%)

9.6 Market opportunity by End-user

Market opportunity by End-user ($ million)
Data Table on Market opportunity by End-user ($ million)

10. Market Segmentation by Distribution Channel

10.1 Market segments

Chart on Distribution Channel - Market share 2025-2030 (%)
Data Table on Distribution Channel - Market share 2025-2030 (%)

10.2 Comparison by Distribution Channel

Chart on Comparison by Distribution Channel
Data Table on Comparison by Distribution Channel

10.3 Direct sales - Market size and forecast 2025-2030

Chart on Direct sales - Market size and forecast 2025-2030 ($ million)
Data Table on Direct sales - Market size and forecast 2025-2030 ($ million)
Chart on Direct sales - Year-over-year growth 2025-2030 (%)
Data Table on Direct sales - Year-over-year growth 2025-2030 (%)

10.4 Indirect sales - Market size and forecast 2025-2030

Chart on Indirect sales - Market size and forecast 2025-2030 ($ million)
Data Table on Indirect sales - Market size and forecast 2025-2030 ($ million)
Chart on Indirect sales - Year-over-year growth 2025-2030 (%)
Data Table on Indirect sales - Year-over-year growth 2025-2030 (%)

10.5 Market opportunity by Distribution Channel

Market opportunity by Distribution Channel ($ million)
Data Table on Market opportunity by Distribution Channel ($ million)

11. Customer Landscape

11.1 Customer landscape overview

Analysis of price sensitivity, lifecycle, customer purchase basket, adoption rates, and purchase criteria

12. Geographic Landscape

12.1 Geographic segmentation

Chart on Market share by geography 2025-2030 (%)
Data Table on Market share by geography 2025-2030 (%)

12.2 Geographic comparison

Chart on Geographic comparison
Data Table on Geographic comparison

12.3 North America - Market size and forecast 2025-2030

Chart on North America - Market size and forecast 2025-2030 ($ million)
Data Table on North America - Market size and forecast 2025-2030 ($ million)
Chart on North America - Year-over-year growth 2025-2030 (%)
Data Table on North America - Year-over-year growth 2025-2030 (%)
Chart on Regional Comparison - North America
Data Table on Regional Comparison - North America

12.3.1 US - Market size and forecast 2025-2030

Chart on US - Market size and forecast 2025-2030 ($ million)
Data Table on US - Market size and forecast 2025-2030 ($ million)
Chart on US - Year-over-year growth 2025-2030 (%)
Data Table on US - Year-over-year growth 2025-2030 (%)

12.3.2 Canada - Market size and forecast 2025-2030

Chart on Canada - Market size and forecast 2025-2030 ($ million)
Data Table on Canada - Market size and forecast 2025-2030 ($ million)
Chart on Canada - Year-over-year growth 2025-2030 (%)
Data Table on Canada - Year-over-year growth 2025-2030 (%)

12.3.3 Mexico - Market size and forecast 2025-2030

Chart on Mexico - Market size and forecast 2025-2030 ($ million)
Data Table on Mexico - Market size and forecast 2025-2030 ($ million)
Chart on Mexico - Year-over-year growth 2025-2030 (%)
Data Table on Mexico - Year-over-year growth 2025-2030 (%)

12.4 Europe - Market size and forecast 2025-2030

Chart on Europe - Market size and forecast 2025-2030 ($ million)
Data Table on Europe - Market size and forecast 2025-2030 ($ million)
Chart on Europe - Year-over-year growth 2025-2030 (%)
Data Table on Europe - Year-over-year growth 2025-2030 (%)
Chart on Regional Comparison - Europe
Data Table on Regional Comparison - Europe

12.4.1 Germany - Market size and forecast 2025-2030

Chart on Germany - Market size and forecast 2025-2030 ($ million)
Data Table on Germany - Market size and forecast 2025-2030 ($ million)
Chart on Germany - Year-over-year growth 2025-2030 (%)
Data Table on Germany - Year-over-year growth 2025-2030 (%)

12.4.2 UK - Market size and forecast 2025-2030

Chart on UK - Market size and forecast 2025-2030 ($ million)
Data Table on UK - Market size and forecast 2025-2030 ($ million)
Chart on UK - Year-over-year growth 2025-2030 (%)
Data Table on UK - Year-over-year growth 2025-2030 (%)

12.4.3 France - Market size and forecast 2025-2030

Chart on France - Market size and forecast 2025-2030 ($ million)
Data Table on France - Market size and forecast 2025-2030 ($ million)
Chart on France - Year-over-year growth 2025-2030 (%)
Data Table on France - Year-over-year growth 2025-2030 (%)

12.4.4 Italy - Market size and forecast 2025-2030

Chart on Italy - Market size and forecast 2025-2030 ($ million)
Data Table on Italy - Market size and forecast 2025-2030 ($ million)
Chart on Italy - Year-over-year growth 2025-2030 (%)
Data Table on Italy - Year-over-year growth 2025-2030 (%)

12.4.5 Spain - Market size and forecast 2025-2030

Chart on Spain - Market size and forecast 2025-2030 ($ million)
Data Table on Spain - Market size and forecast 2025-2030 ($ million)
Chart on Spain - Year-over-year growth 2025-2030 (%)
Data Table on Spain - Year-over-year growth 2025-2030 (%)

12.4.6 The Netherlands - Market size and forecast 2025-2030

Chart on The Netherlands - Market size and forecast 2025-2030 ($ million)
Data Table on The Netherlands - Market size and forecast 2025-2030 ($ million)
Chart on The Netherlands - Year-over-year growth 2025-2030 (%)
Data Table on The Netherlands - Year-over-year growth 2025-2030 (%)

12.5 APAC - Market size and forecast 2025-2030

Chart on APAC - Market size and forecast 2025-2030 ($ million)
Data Table on APAC - Market size and forecast 2025-2030 ($ million)
Chart on APAC - Year-over-year growth 2025-2030 (%)
Data Table on APAC - Year-over-year growth 2025-2030 (%)
Chart on Regional Comparison - APAC
Data Table on Regional Comparison - APAC

12.5.1 China - Market size and forecast 2025-2030

Chart on China - Market size and forecast 2025-2030 ($ million)
Data Table on China - Market size and forecast 2025-2030 ($ million)
Chart on China - Year-over-year growth 2025-2030 (%)
Data Table on China - Year-over-year growth 2025-2030 (%)

12.5.2 India - Market size and forecast 2025-2030

Chart on India - Market size and forecast 2025-2030 ($ million)
Data Table on India - Market size and forecast 2025-2030 ($ million)
Chart on India - Year-over-year growth 2025-2030 (%)
Data Table on India - Year-over-year growth 2025-2030 (%)

12.5.3 Japan - Market size and forecast 2025-2030

Chart on Japan - Market size and forecast 2025-2030 ($ million)
Data Table on Japan - Market size and forecast 2025-2030 ($ million)
Chart on Japan - Year-over-year growth 2025-2030 (%)
Data Table on Japan - Year-over-year growth 2025-2030 (%)

12.5.4 South Korea - Market size and forecast 2025-2030

Chart on South Korea - Market size and forecast 2025-2030 ($ million)
Data Table on South Korea - Market size and forecast 2025-2030 ($ million)
Chart on South Korea - Year-over-year growth 2025-2030 (%)
Data Table on South Korea - Year-over-year growth 2025-2030 (%)

12.5.5 Australia - Market size and forecast 2025-2030

Chart on Australia - Market size and forecast 2025-2030 ($ million)
Data Table on Australia - Market size and forecast 2025-2030 ($ million)
Chart on Australia - Year-over-year growth 2025-2030 (%)
Data Table on Australia - Year-over-year growth 2025-2030 (%)

12.5.6 Indonesia - Market size and forecast 2025-2030

Chart on Indonesia - Market size and forecast 2025-2030 ($ million)
Data Table on Indonesia - Market size and forecast 2025-2030 ($ million)
Chart on Indonesia - Year-over-year growth 2025-2030 (%)
Data Table on Indonesia - Year-over-year growth 2025-2030 (%)

12.6 Middle East and Africa - Market size and forecast 2025-2030

Chart on Middle East and Africa - Market size and forecast 2025-2030 ($ million)
Data Table on Middle East and Africa - Market size and forecast 2025-2030 ($ million)
Chart on Middle East and Africa - Year-over-year growth 2025-2030 (%)
Data Table on Middle East and Africa - Year-over-year growth 2025-2030 (%)
Chart on Regional Comparison - Middle East and Africa
Data Table on Regional Comparison - Middle East and Africa

12.6.1 Saudi Arabia - Market size and forecast 2025-2030

Chart on Saudi Arabia - Market size and forecast 2025-2030 ($ million)
Data Table on Saudi Arabia - Market size and forecast 2025-2030 ($ million)
Chart on Saudi Arabia - Year-over-year growth 2025-2030 (%)
Data Table on Saudi Arabia - Year-over-year growth 2025-2030 (%)

12.6.2 South Africa - Market size and forecast 2025-2030

Chart on South Africa - Market size and forecast 2025-2030 ($ million)
Data Table on South Africa - Market size and forecast 2025-2030 ($ million)
Chart on South Africa - Year-over-year growth 2025-2030 (%)
Data Table on South Africa - Year-over-year growth 2025-2030 (%)

12.6.3 UAE - Market size and forecast 2025-2030

Chart on UAE - Market size and forecast 2025-2030 ($ million)
Data Table on UAE - Market size and forecast 2025-2030 ($ million)
Chart on UAE - Year-over-year growth 2025-2030 (%)
Data Table on UAE - Year-over-year growth 2025-2030 (%)

12.6.4 Egypt - Market size and forecast 2025-2030

Chart on Egypt - Market size and forecast 2025-2030 ($ million)
Data Table on Egypt - Market size and forecast 2025-2030 ($ million)
Chart on Egypt - Year-over-year growth 2025-2030 (%)
Data Table on Egypt - Year-over-year growth 2025-2030 (%)

12.6.5 Turkey - Market size and forecast 2025-2030

Chart on Turkey - Market size and forecast 2025-2030 ($ million)
Data Table on Turkey - Market size and forecast 2025-2030 ($ million)
Chart on Turkey - Year-over-year growth 2025-2030 (%)
Data Table on Turkey - Year-over-year growth 2025-2030 (%)

12.7 South America - Market size and forecast 2025-2030

Chart on South America - Market size and forecast 2025-2030 ($ million)
Data Table on South America - Market size and forecast 2025-2030 ($ million)
Chart on South America - Year-over-year growth 2025-2030 (%)
Data Table on South America - Year-over-year growth 2025-2030 (%)
Chart on Regional Comparison - South America
Data Table on Regional Comparison - South America

12.7.1 Brazil - Market size and forecast 2025-2030

Chart on Brazil - Market size and forecast 2025-2030 ($ million)
Data Table on Brazil - Market size and forecast 2025-2030 ($ million)
Chart on Brazil - Year-over-year growth 2025-2030 (%)
Data Table on Brazil - Year-over-year growth 2025-2030 (%)

12.7.2 Argentina - Market size and forecast 2025-2030

Chart on Argentina - Market size and forecast 2025-2030 ($ million)
Data Table on Argentina - Market size and forecast 2025-2030 ($ million)
Chart on Argentina - Year-over-year growth 2025-2030 (%)
Data Table on Argentina - Year-over-year growth 2025-2030 (%)

12.7.3 Colombia - Market size and forecast 2025-2030

Chart on Colombia - Market size and forecast 2025-2030 ($ million)
Data Table on Colombia - Market size and forecast 2025-2030 ($ million)
Chart on Colombia - Year-over-year growth 2025-2030 (%)
Data Table on Colombia - Year-over-year growth 2025-2030 (%)

12.8 Market opportunity by geography

Market opportunity by geography ($ million)
Data Tables on Market opportunity by geography ($ million)

13. Drivers, Challenges, and Opportunity

13.1 Market drivers

Accelerating urbanization and stringent municipal fire safety
Increasing frequency of wildland fires and expansion of forest operations
Industrial infrastructure expansion and heavy rigor requirements in energy

13.2 Market challenges

Raw material volatility and rising production costs
Increasing environmental scrutiny and phase-out mandates
Strict certification standards and lengthy validation cycles

13.3 Impact of drivers and challenges

Impact of drivers and challenges in 2025 and 2030

13.4 Market opportunities

Integration of smart sensing and digital inventory management infrastructure
Transition toward low-friction fluorine-free inner liners
Shift toward modular, large-diameter hose systems for water relay

14. Competitive Landscape

14.1 Overview

14.2

Overview on criticality of inputs and factors of differentiation

14.3 Landscape disruption

Overview on factors of disruption

14.4 Industry risks

Impact of key risks on business

15. Competitive Analysis

15.1 Companies profiled

Companies covered

15.2 Company ranking index

15.3 Market positioning of companies

Matrix on companies position and classification

15.4 Angus Fire

Angus Fire - Overview
Angus Fire - Product / Service
Angus Fire - Key offerings
SWOT

15.5 Chhatariya Firetech Industries

Chhatariya Firetech Industries - Overview
Chhatariya Firetech Industries - Product / Service
Chhatariya Firetech Industries - Key offerings
SWOT

15.6 Dixon Valve and Coupling Co.

Dixon Valve and Coupling Co. - Overview
Dixon Valve and Coupling Co. - Product / Service
Dixon Valve and Coupling Co. - Key offerings
SWOT

15.7 Gollmer and Hummel GmbH

Gollmer and Hummel GmbH - Overview
Gollmer and Hummel GmbH - Product / Service
Gollmer and Hummel GmbH - Key offerings
SWOT

15.8 KFH Industries Co.

KFH Industries Co. - Overview
KFH Industries Co. - Product / Service
KFH Industries Co. - Key offerings
SWOT

15.9 Mandals AS

Mandals AS - Overview
Mandals AS - Product / Service
Mandals AS - Key offerings
SWOT

15.10 Mercedes Textiles Ltd.

Mercedes Textiles Ltd. - Overview
Mercedes Textiles Ltd. - Product / Service
Mercedes Textiles Ltd. - Key offerings
SWOT

15.11 NewAge Fire Protection Ltd.

NewAge Fire Protection Ltd. - Overview
NewAge Fire Protection Ltd. - Product / Service
NewAge Fire Protection Ltd. - Key offerings
SWOT

15.12 Niedner Inc.

Niedner Inc. - Overview
Niedner Inc. - Product / Service
Niedner Inc. - Key offerings
SWOT

15.13 NORTH AMERICAN FIRE HOSE CORP.

NORTH AMERICAN FIRE HOSE CORP. - Overview
NORTH AMERICAN FIRE HOSE CORP. - Product / Service
NORTH AMERICAN FIRE HOSE CORP. - Key offerings
SWOT

15.14 Puck Enterprises

Puck Enterprises - Overview
Puck Enterprises - Product / Service
Puck Enterprises - Key offerings
SWOT

15.15 Snap tite Hose

Snap tite Hose - Overview
Snap tite Hose - Product / Service
Snap tite Hose - Key offerings
SWOT

15.16 Survitec Group Ltd.

Survitec Group Ltd. - Overview
Survitec Group Ltd. - Product / Service
Survitec Group Ltd. - Key offerings
SWOT

15.17 Terraflex Industries Ltd.

Terraflex Industries Ltd. - Overview
Terraflex Industries Ltd. - Product / Service
Terraflex Industries Ltd. - Key offerings
SWOT

15.18 WATERAX Inc.

WATERAX Inc. - Overview
WATERAX Inc. - Product / Service
WATERAX Inc. - Key offerings
SWOT

16. Appendix

16.1 Scope of the report

Market definition
Objectives
Notes and caveats

16.2 Inclusions and exclusions checklist

Inclusions checklist
Exclusions checklist

16.3 Currency conversion rates for US$

16.4 Research methodology

16.5 Data procurement

Information sources

16.6 Data validation

16.7 Validation techniques employed for market sizing

16.8 Data synthesis

16.9 360 degree market analysis

16.10 List of abbreviations

Research Methodology

Technavio presents a detailed picture of the market by way of study, synthesis, and summation of data from multiple sources. The analysts have presented the various facets of the market with a particular focus on identifying the key industry influencers. The data thus presented is comprehensive, reliable, and the result of extensive research, both primary and secondary.

INFORMATION SOURCES

Primary sources

  • Manufacturers and suppliers
  • Channel partners
  • Industry experts
  • Strategic decision makers

Secondary sources

  • Industry journals and periodicals
  • Government data
  • Financial reports of key industry players
  • Historical data
  • Press releases

DATA ANALYSIS

Data Synthesis

  • Collation of data
  • Estimation of key figures
  • Analysis of derived insights

Data Validation

  • Triangulation with data models
  • Reference against proprietary databases
  • Corroboration with industry experts

REPORT WRITING

Qualitative

  • Market drivers
  • Market challenges
  • Market trends
  • Five forces analysis

Quantitative

  • Market size and forecast
  • Market segmentation
  • Geographical insights
  • Competitive landscape

Interested in this report?

Get your sample now to see our research methodology and insights!

Download Now

Frequently Asked Questions

Fire Hose market growth will increase by USD 228.2 million during 2026-2030.

The Fire Hose market is expected to grow at a CAGR of 5.5% during 2026-2030.

Fire Hose market is segmented by Product (Type 3, Type 2, Type 1) End-user (Municipal fire service, Commercial, Others) Distribution channel (Direct sales, Indirect sales)

Angus Fire, Chhatariya Firetech Industries, Dixon Valve and Coupling Co., Gollmer and Hummel GmbH, KFH Industries Co., Mandals AS, Mercedes Textiles Ltd., NewAge Fire Protection Ltd., Niedner Inc., NORTH AMERICAN FIRE HOSE CORP., Puck Enterprises, Snap tite Hose, Survitec Group Ltd., Terraflex Industries Ltd., Thoni, TIPSA, WATERAX Inc., ZYfire Hose Corp. are a few of the key vendors in the Fire Hose market.

North America will register the highest growth rate of 31.4% among the other regions. Therefore, the Fire Hose market in North America is expected to garner significant business opportunities for the vendors during the forecast period.

US, Canada, Mexico, Germany, UK, France, Italy, Spain, The Netherlands, China, India, Japan, South Korea, Australia, Indonesia, Saudi Arabia, South Africa, UAE, Egypt, Turkey, Brazil, Argentina, Colombia

  • Accelerating urbanization and stringent municipal fire safety is the driving factor this market.

The Fire Hose market vendors should focus on grabbing business opportunities from the Product segment as it accounted for the largest market share in the base year.
RIA - Research AI Assistant
Ask RIA
