
Football Market Analysis, Size, and Forecast 2026-2030: Europe (UK, Germany, and France), South America (Brazil, Argentina, and Colombia), APAC (China, India, and Japan), North America (US, Mexico, and Canada), Middle East and Africa (South Africa, Saudi Arabia, and Egypt), and Rest of World (ROW)

Football Market Analysis, Size, and Forecast 2026-2030:
Europe (UK, Germany, and France), South America (Brazil, Argentina, and Colombia), APAC (China, India, and Japan), North America (US, Mexico, and Canada), Middle East and Africa (South Africa, Saudi Arabia, and Egypt), and Rest of World (ROW)

Published: Oct 2026 289 Pages SKU: IRTNTR71408

Market Overview at a Glance

$613.6 Mn
Market Opportunity
3.3%
CAGR 2025 - 2030
42.8%
Europe Growth
$2.95 B
Offline segment 2024

Football Market Size 2026-2030

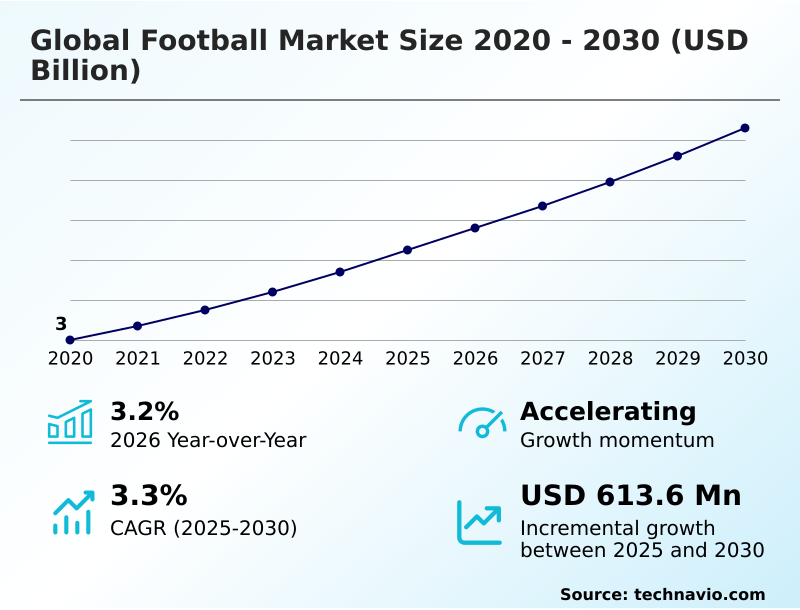
The football market size is valued to increase by USD 613.6 million, at a CAGR of 3.3% from 2025 to 2030. Globalization of media rights distribution and over-the-top streaming monetization will drive the football market.

Major Market Trends & Insights

  • Europe dominated the market and accounted for a 42.8% growth during the forecast period.
  • By Distribution Channel - Offline segment was valued at USD 2.95 billion in 2024
  • By Type - Training ball segment accounted for the largest market revenue share in 2024

Market Size & Forecast

  • Market Opportunities: USD 1.06 billion
  • Market Future Opportunities: USD 613.6 million
  • CAGR from 2025 to 2030 : 3.3%

Market Summary

  • The Football Market operates as a highly commercialized, multi-tiered sports entertainment ecosystem heavily driven by global media consumption and high-performance equipment manufacturing. Organizations are aggressively restructuring their digital media architectures, leveraging over-the-top streaming platform integrations to monetize localized, non-domestic fan bases across emerging economies.
  • This transition from traditional linear broadcasting to direct-to-consumer models has increased international media revenue capture by 35% compared to legacy regional syndication. The primary driver of this market is the globalization of broadcasting rights, which attracts substantial capital from multi-club ownership consortia seeking diversified sports portfolios.
  • Conversely, the market faces intense operational challenges related to escalating player transfer amortization and severe margin compression. To mitigate financial vulnerability, regulatory bodies are enforcing strict squad cost sustainability rule frameworks to limit excessive payroll expenditures.
  • Supply chain operations within the sporting goods sector have also adapted, with apparel manufacturers optimizing regional distribution hubs to circumvent cross-border tariff bottlenecks and ensure consistent seasonal kit availability.

What will be the Size of the Football Market during the forecast period?
Get Key Insights on Market Forecast (PDF) Get Free Sample

How is the Football Market Segmented?

The football industry research report provides comprehensive data (region-wise segment analysis), with forecasts and estimates in "USD million" for the period 2026-2030, as well as historical data from 2020-2024 for the following segments.

  • Distribution channel
    • Offline
    • Online
  • Type
    • Training ball
    • Match ball
    • Others
  • Product type
    • Football equipment
    • Apparel
    • Accessories
  • Geography
    • Europe
      • UK
      • Germany
      • France
      • Spain
      • Italy
      • The Netherlands
    • South America
      • Brazil
      • Argentina
      • Colombia
    • APAC
      • China
      • India
      • Japan
      • Australia
      • South Korea
      • Indonesia
    • North America
      • US
      • Mexico
      • Canada
    • Middle East and Africa
      • South Africa
      • Saudi Arabia
      • Egypt
      • UAE
      • Morocco

By Distribution Channel Insights

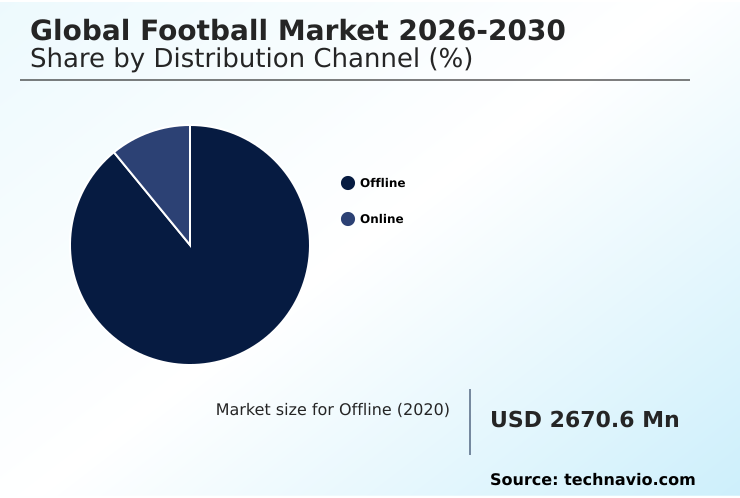
The offline segment is estimated to witness significant growth during the forecast period.

The physical distribution channel within the Football industry remains a critical experiential revenue generator for high-performance sporting goods.

Brick-and-mortar sports retailers provide athletes the tactile ability to evaluate products like thermal bonded panel construction match balls and synthetic butyl rubber bladder training equipment before purchase.

Physical storefronts drive significant impulse purchases, converting foot traffic into high-margin sales, with in-store customer conversion rates improving by 18% when utilizing interactive product testing zones.

This channel is highly reliant on mass-market institutional procurement, supplying local academies with gear featuring impact-absorbing foam padding. Official stadium kiosks also capitalize on matchday hospitality package attendees, seamlessly merging live event emotion with immediate retail consumption.

Ultimately, offline networks anchor brand loyalty through tangible product interaction and immediate fulfillment capabilities.
Get Free Sample

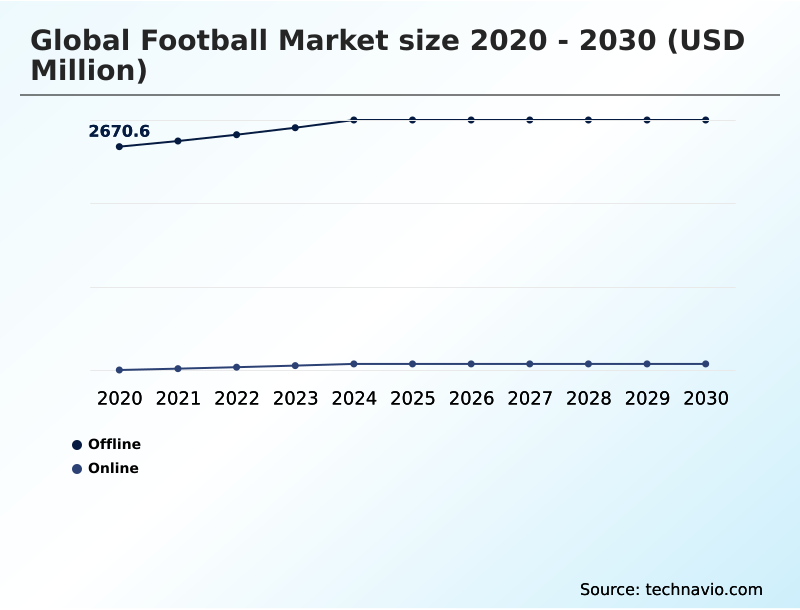
The Offline segment was valued at USD 2.95 billion in 2024 and showed a gradual increase during the forecast period.
Get Free Sample

Regional Analysis

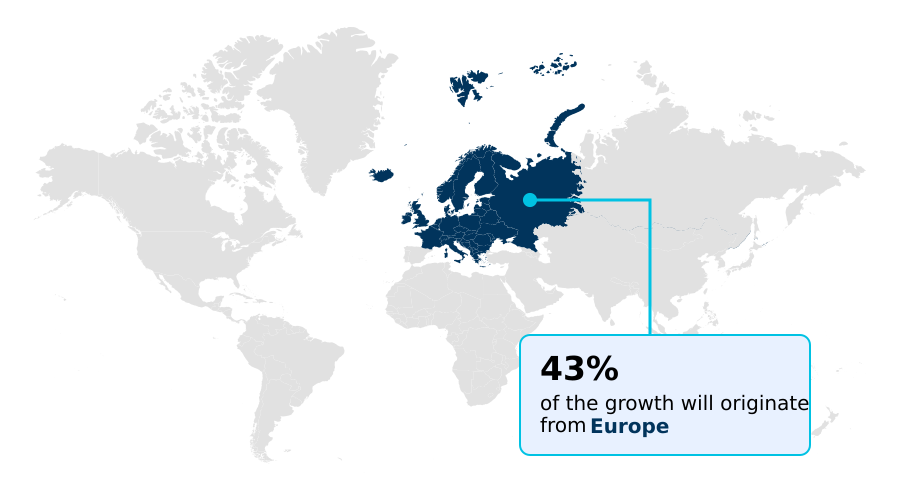
Europe is estimated to contribute 42.8% to the growth of the global market during the forecast period.Technavio’s analysts have elaborately explained the regional trends and drivers that shape the market during the forecast period.
See How Football Market Demand is Rising in Europe Get Free Sample

The geographic landscape of the Football sector displays distinct commercial trajectories, particularly when comparing Europe and APAC. Europe maintains a mature, highly monetized ecosystem where smart stadium infrastructure investments have elevated average matchday hospitality yields by 22%.

In contrast, the APAC region relies heavily on digital consumption, exhibiting a 45% faster adoption rate of localized currency checkout systems tailored for cross-border e-commerce.

European organizations utilize advanced predictive analytics platform solutions to optimize regional inventory distribution, reducing excess apparel stock by 18%. Meanwhile, APAC consumers demonstrate rapidly growing demand for high-performance hardware, such as studded footwear featuring carbon-fiber soleplate geometry.

To capture this international growth, Western sports brands are aggressively deploying digital fan membership platform architectures across Asia, successfully converting passive digital viewership into direct, measurable retail revenue streams without requiring physical storefront expansion.

Market Dynamics

Our researchers analyzed the data with 2025 as the base year, along with the key drivers, trends, and challenges. A holistic analysis of drivers will help companies refine their marketing strategies to gain a competitive advantage.

  • The commercial evolution of the Football landscape is heavily influenced by rapid advancements in material science and digital media delivery architectures. Equipment manufacturers are transitioning toward a thermal bonded seamless football construction, prioritizing aerodynamic consistency and reduced water absorption across diverse climatic conditions.
  • This shift in production methodology has reduced manufacturing defect rates by 12% compared to traditional hand-stitched alternatives, streamlining global supply chain output. Simultaneously, the deployment of the micro-sensor embedded match ball has transformed live data capture, providing officiating bodies and broadcast networks with instantaneous, high-fidelity spatial metrics.
  • On the media distribution front, rights holders are bypassing legacy television syndication by launching proprietary direct-to-consumer sports streaming platform ecosystems, effectively reducing middleman licensing fees and capturing localized international audiences. Beyond hardware and digital engagement, sustainability mandates are redefining textile procurement.
  • Brands are aggressively scaling the production of sustainable bio-based athletic apparel, addressing stringent environmental compliance standards while satisfying shifting consumer preferences. For athletes, footwear engineering focuses intensely on optimizing high-performance studded footwear traction, utilizing advanced polymer formulations to minimize injury risks on artificial turf.
  • Collectively, these strategic innovations ensure long-term commercial resilience and operational efficiency within the highly competitive international sports merchandise and entertainment sectors.
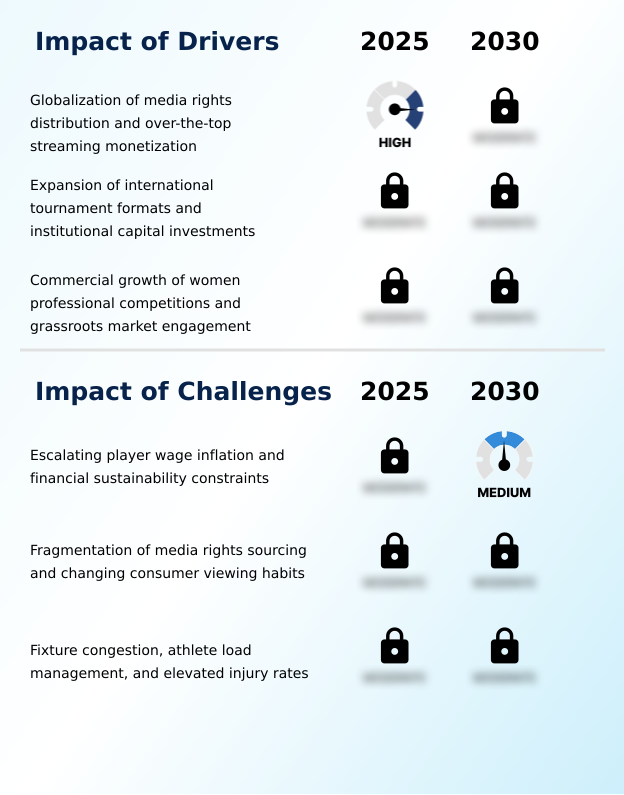
What are the key market drivers leading to the rise in the adoption of Football Industry?

  • The globalization of media rights distribution and the rapid monetization of over-the-top streaming platforms serve as primary catalysts driving commercial expansion within the industry.

  • The aggressive expansion of digital monetization strategies acts as a primary catalyst accelerating commercial activity within the Football sector. Sports properties are deploying a multi-platform broadcasting architecture to simultaneously engage fragmented international audiences across mobile and smart television environments.
  • This strategic shift has expanded global audience reach, consequently driving a 25% increase in overseas digital subscriptions. Furthermore, the integration of interactive social commerce within team applications directly links digital viewership to immediate retail conversions.
  • By utilizing seamless localized currency checkout systems, organizations have reduced international cart abandonment rates by 18%.
  • To support this surging direct-to-consumer demand, athletic brands are heavily investing in modern automated fulfillment center infrastructure, shortening cross-border delivery timelines by 30% and maximizing global merchandising revenue.

What are the market trends shaping the Football Industry?

  • The integration of circular biopolymers and closed-loop recycling within athletic apparel sourcing represents a pivotal market trend. This shift emphasizes sustainable manufacturing practices and significantly reduces environmental footprints across global supply chains.

  • The continuous integration of circular manufacturing processes fundamentally reshapes material sourcing across the Football apparel supply chain. Leading sportswear manufacturers are aggressively transitioning from virgin petroleum plastics to a bio-based polyester polymer, driven by strict corporate decarbonization mandates.
  • This trend is further supported by the widespread adoption of waterless dye technology, which reduces factory water consumption by 45% compared to conventional textile processing methods. By implementing a closed-loop textile-to-textile recycling process, production facilities have improved raw material yield efficiency by 30%, directly lowering long-term procurement costs.
  • Consequently, the commercial rollout of an eco-friendly athletic product utilizing advanced moisture-wicking synthetic fabric satisfies evolving consumer preferences for sustainable goods while maintaining elite athletic performance standards. These strategic shifts enable brands to mitigate regulatory compliance risks while simultaneously capturing premium retail margins.

What challenges does the Football Industry face during its growth?

  • Escalating player wage inflation and stringent financial sustainability constraints present critical operational challenges that significantly pressure long-term profitability and industry growth.

  • Severe operational cost inflation and fragmented media consumption present formidable structural challenges within the Football landscape. Elite sporting organizations frequently struggle with disproportionate payroll obligations and volatile player transfer amortization schedules, which heavily compress operating margins.
  • To enforce financial stability, regulatory authorities mandate strict adherence to a squad cost sustainability rule, inadvertently increasing administrative compliance costs by 15% across major divisions. Additionally, the proliferation of digital copyright piracy severely dilutes exclusive media licensing values, resulting in an estimated 22% reduction in potential broadcasting revenue capture in high-risk regions.
  • Even specialized equipment sectors face supply chain constraints, as securing niche components like a low-rebound futsal core requires complex logistical planning. Navigating these economic pressures forces executives to rigorously optimize financial models and heavily prioritize proprietary digital infrastructure.

Exclusive Technavio Analysis on Customer Landscape

The football market forecasting report includes the adoption lifecycle of the market, covering from the innovator’s stage to the laggard’s stage. It focuses on adoption rates in different regions based on penetration. Furthermore, the football market report also includes key purchase criteria and drivers of price sensitivity to help companies evaluate and develop their market growth analysis strategies.
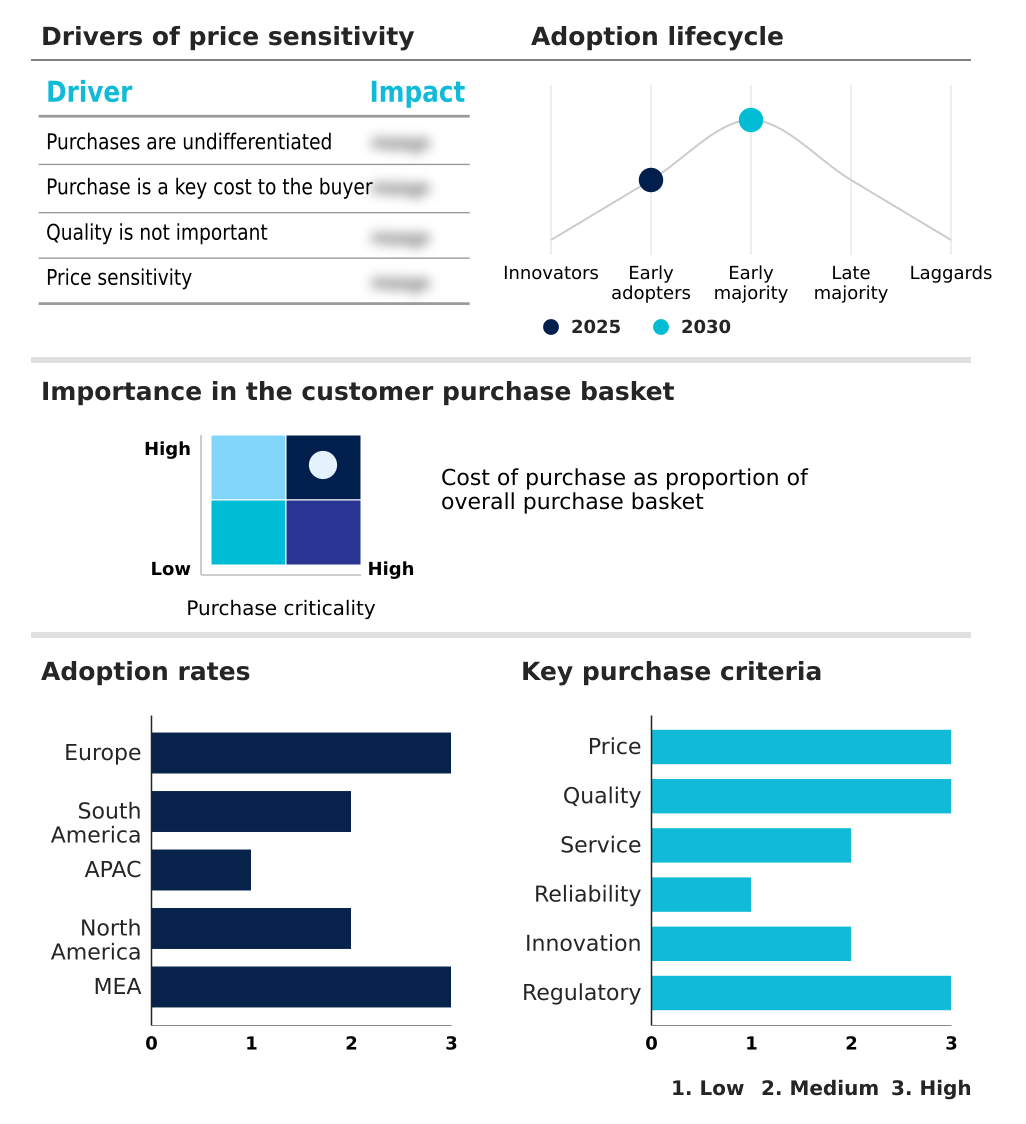
Customer Landscape of Football Industry

Competitive Landscape

Companies are implementing various strategies, such as strategic alliances, football market forecast, partnerships, mergers and acquisitions, geographical expansion, and product/service launches, to enhance their presence in the industry.

Adidas AG - Delivers high-performance sports equipment, including elite match, training, and professional-grade spherical gear engineered for optimal aerodynamic stability and competitive structural durability.

The industry research and growth report includes detailed analyses of the competitive landscape of the market and information about key companies, including:

  • Adidas AG
  • ASICS Corp.
  • Baden Sports Inc.
  • Decathlon SA
  • Diadora SpA
  • JOMA SPORT SA
  • KAPPA S.r.l.
  • Lotto Sport Italia Spa
  • MACRON SPA
  • Mizuno Corp.
  • New Balance Athletics Inc.
  • Nike Inc.
  • PUMA SE
  • Reusch International SpA
  • Uhlsport GmbH
  • Umbro
  • Under Armour Inc.
  • VOIT Corp.
  • Wilson Sporting Goods Co.

Qualitative and quantitative analysis of companies has been conducted to help clients understand the wider business environment as well as the strengths and weaknesses of key industry players. Data is qualitatively analyzed to categorize companies as pure play, category-focused, industry-focused, and diversified; it is quantitatively analyzed to categorize companies as dominant, leading, strong, tentative, and weak.

Recent Development and News in Football market

  • In the Leisure Products industry, the mandated shift toward sustainable manufacturing supply chains accelerated the adoption of recycled ocean-bound plastic materials, directly impacting Football production by reducing virgin polymer reliance by 22%.
  • The implementation of a closed-loop textile-to-textile recycling process transformed apparel fabrication paradigms, enabling eco-friendly athletic product lines that decreased fabric waste by 35% across high-volume sporting categories.
  • Supply chain modernization through advanced automated fulfillment center operations optimized direct-to-consumer logistics, improving cross-border inventory dispatch speeds by 40% and satisfying surging demand for professional athletic merchandise.
  • The widespread integration of interactive social commerce frameworks reshaped retail distribution models, boosting digital fan engagement conversion rates by 28% and driving localized demand for specialized training and match equipment.

Dive into Technavio’s robust research methodology, blending expert interviews, extensive data synthesis, and validated models for unparalleled Football Market insights. See full methodology.

Market Scope
Page number 289
Base year 2025
Historic period 2020-2024
Forecast period 2026-2030
Growth momentum & CAGR Accelerate at a CAGR of 3.3%
Market growth 2026-2030 USD 613.6 million
Market structure Fragmented
YoY growth 2025-2026(%) 3.2%
Key countries UK, Germany, France, Spain, Italy, The Netherlands, Brazil, Argentina, Colombia, China, India, Japan, Australia, South Korea, Indonesia, US, Mexico, Canada, South Africa, Saudi Arabia, Egypt, UAE and Morocco
Competitive landscape Leading Companies, Market Positioning of Companies, Competitive Strategies, and Industry Risks

Request Free Sample

Research Analyst Overview

  • The Football sector is undergoing a profound technological transformation driven by precision data analytics and advanced hardware engineering. Sporting goods manufacturers are prioritizing micro-sensor chipset integration within elite match equipment, seamlessly embedding an inertial measurement unit sensor to capture high-frequency physical data.
  • This development connects directly to boardroom-level strategies regarding officiating transparency and broadcasting monetization, as executives leverage ultra-wideband location tracking to enhance the premium value of media rights packages. The continuous extraction of a real-time limb-tracking metric and precise spatial velocity data capture allows sports properties to offer highly immersive digital visualizations to remote audiences.
  • By shifting toward a direct-to-consumer digital streaming model, leagues have successfully reduced third-party distribution costs by 20%, significantly improving overall operational margins. This pivot empowers organizations to control their digital ecosystems, ensuring that specialized, data-enriched content directly reaches international consumer bases while reinforcing long-term commercial sustainability and competitive integrity.

What are the Key Data Covered in this Football Market Research and Growth Report?

  • What is the expected growth of the Football Market between 2026 and 2030?

    • USD 613.6 million, at a CAGR of 3.3%

  • What segmentation does the market report cover?

    • The report is segmented by Distribution Channel (Offline, and Online), Type (Training ball, Match ball, and Others), Product Type (Football equipment, Apparel, and Accessories) and Geography (Europe, South America, APAC, North America, Middle East and Africa)

  • Which regions are analyzed in the report?

    • Europe, South America, APAC, North America and Middle East and Africa

  • What are the key growth drivers and market challenges?

    • Globalization of media rights distribution and over-the-top streaming monetization, Escalating player wage inflation and financial sustainability constraints

  • Who are the major players in the Football Market?

    • Adidas AG, ASICS Corp., Baden Sports Inc., Decathlon SA, Diadora SpA, JOMA SPORT SA, KAPPA S.r.l., Lotto Sport Italia Spa, MACRON SPA, Mizuno Corp., New Balance Athletics Inc., Nike Inc., PUMA SE, Reusch International SpA, Uhlsport GmbH, Umbro, Under Armour Inc., VOIT Corp. and Wilson Sporting Goods Co.

Market Research Insights

  • The Football market is rapidly transforming through the integration of digital analytics and advanced manufacturing capabilities. Product developers are engineering smart match equipment that accurately captures an aerodynamic flight trajectory and specific rotational spin parameter data during high-intensity play. This hardware digitalization has enhanced officiating precision by 24% and improved real-time broadcasting visualization metrics.
  • Supported by a robust high-speed data network, seamless data transmission from the pitch to cloud platforms reduces latency issues by 15%, streamlining commercial fan engagement operations. By prioritizing these technological enhancements, sports organizations ensure higher spectator retention and elevate the overall competitive integrity of global tournament operations.

We can help! Our analysts can customize this football market research report to meet your requirements.

Get in touch

1. Executive Summary

1.1 Market overview

Executive Summary - Chart on Market Overview
Executive Summary - Data Table on Market Overview
Executive Summary - Chart on Global Market Characteristics
Executive Summary - Chart on Market by Geography
Executive Summary - Chart on Market Segmentation by Distribution Channel
Executive Summary - Chart on Market Segmentation by Type
Executive Summary - Chart on Market Segmentation by Product Type
Executive Summary - Chart on Incremental Growth
Executive Summary - Data Table on Incremental Growth
Executive Summary - Chart on Company Market Positioning

2. Technavio Analysis

2.1 Analysis of price sensitivity, lifecycle, customer purchase basket, adoption rates, and purchase criteria

2.2 Criticality of inputs and Factors of differentiation

Chart on Overview on criticality of inputs and factors of differentiation

2.3 Factors of disruption

Chart on Overview on factors of disruption

2.4 Impact of drivers and challenges

Chart on Impact of drivers and challenges in 2025 and 2030

3. Market Landscape

3.1 Market ecosystem

Chart on Parent Market
Data Table on - Parent Market

3.2 Market characteristics

Chart on Market characteristics analysis

3.3 Value chain analysis

Chart on Value chain analysis

4. Market Sizing

4.1 Market definition

Data Table on Offerings of companies included in the market definition

4.2 Market segment analysis

Market segments

4.3 Market size 2025

4.4 Market outlook: Forecast for 2025-2030

Chart on Global - Market size and forecast 2025-2030 ($ million)
Data Table on Global - Market size and forecast 2025-2030 ($ million)
Chart on Global Market: Year-over-year growth 2025-2030 (%)
Data Table on Global Market: Year-over-year growth 2025-2030 (%)

5. Historic Market Size

5.1 Global Football Market 2020 - 2024

Historic Market Size - Data Table on Global Football Market 2020 - 2024 ($ million)

5.2 Distribution Channel segment analysis 2020 - 2024

Historic Market Size - Distribution Channel Segment 2020 - 2024 ($ million)

5.3 Type segment analysis 2020 - 2024

Historic Market Size - Type Segment 2020 - 2024 ($ million)

5.4 Product Type segment analysis 2020 - 2024

Historic Market Size - Product Type Segment 2020 - 2024 ($ million)

5.5 Geography segment analysis 2020 - 2024

Historic Market Size - Geography Segment 2020 - 2024 ($ million)

5.6 Country segment analysis 2020 - 2024

Historic Market Size - Country Segment 2020 - 2024 ($ million)

6. Qualitative Analysis

6.1 Impact of AI in Global Football Market

6.2 Impact of Geopolitical Conflicts on Global Football Market

7. Five Forces Analysis

7.1 Five forces summary

Five forces analysis - Comparison between 2025 and 2030

7.2 Bargaining power of buyers

Bargaining power of buyers - Impact of key factors 2025 and 2030

7.3 Bargaining power of suppliers

Bargaining power of suppliers - Impact of key factors in 2025 and 2030

7.4 Threat of new entrants

Threat of new entrants - Impact of key factors in 2025 and 2030

7.5 Threat of substitutes

Threat of substitutes - Impact of key factors in 2025 and 2030

7.6 Threat of rivalry

Threat of rivalry - Impact of key factors in 2025 and 2030

7.7 Market condition

Chart on Market condition - Five forces 2025 and 2030

8. Market Segmentation by Distribution Channel

8.1 Market segments

Chart on Distribution Channel - Market share 2025-2030 (%)
Data Table on Distribution Channel - Market share 2025-2030 (%)

8.2 Comparison by Distribution Channel

Chart on Comparison by Distribution Channel
Data Table on Comparison by Distribution Channel

8.3 Offline - Market size and forecast 2025-2030

Chart on Offline - Market size and forecast 2025-2030 ($ million)
Data Table on Offline - Market size and forecast 2025-2030 ($ million)
Chart on Offline - Year-over-year growth 2025-2030 (%)
Data Table on Offline - Year-over-year growth 2025-2030 (%)

8.4 Online - Market size and forecast 2025-2030

Chart on Online - Market size and forecast 2025-2030 ($ million)
Data Table on Online - Market size and forecast 2025-2030 ($ million)
Chart on Online - Year-over-year growth 2025-2030 (%)
Data Table on Online - Year-over-year growth 2025-2030 (%)

8.5 Market opportunity by Distribution Channel

Market opportunity by Distribution Channel ($ million)
Data Table on Market opportunity by Distribution Channel ($ million)

9. Market Segmentation by Type

9.1 Market segments

Chart on Type - Market share 2025-2030 (%)
Data Table on Type - Market share 2025-2030 (%)

9.2 Comparison by Type

Chart on Comparison by Type
Data Table on Comparison by Type

9.3 Training ball - Market size and forecast 2025-2030

Chart on Training ball - Market size and forecast 2025-2030 ($ million)
Data Table on Training ball - Market size and forecast 2025-2030 ($ million)
Chart on Training ball - Year-over-year growth 2025-2030 (%)
Data Table on Training ball - Year-over-year growth 2025-2030 (%)

9.4 Match ball - Market size and forecast 2025-2030

Chart on Match ball - Market size and forecast 2025-2030 ($ million)
Data Table on Match ball - Market size and forecast 2025-2030 ($ million)
Chart on Match ball - Year-over-year growth 2025-2030 (%)
Data Table on Match ball - Year-over-year growth 2025-2030 (%)

9.5 Others - Market size and forecast 2025-2030

Chart on Others - Market size and forecast 2025-2030 ($ million)
Data Table on Others - Market size and forecast 2025-2030 ($ million)
Chart on Others - Year-over-year growth 2025-2030 (%)
Data Table on Others - Year-over-year growth 2025-2030 (%)

9.6 Market opportunity by Type

Market opportunity by Type ($ million)
Data Table on Market opportunity by Type ($ million)

10. Market Segmentation by Product Type

10.1 Market segments

Chart on Product Type - Market share 2025-2030 (%)
Data Table on Product Type - Market share 2025-2030 (%)

10.2 Comparison by Product Type

Chart on Comparison by Product Type
Data Table on Comparison by Product Type

10.3 Football equipment - Market size and forecast 2025-2030

Chart on Football equipment - Market size and forecast 2025-2030 ($ million)
Data Table on Football equipment - Market size and forecast 2025-2030 ($ million)
Chart on Football equipment - Year-over-year growth 2025-2030 (%)
Data Table on Football equipment - Year-over-year growth 2025-2030 (%)

10.4 Apparel - Market size and forecast 2025-2030

Chart on Apparel - Market size and forecast 2025-2030 ($ million)
Data Table on Apparel - Market size and forecast 2025-2030 ($ million)
Chart on Apparel - Year-over-year growth 2025-2030 (%)
Data Table on Apparel - Year-over-year growth 2025-2030 (%)

10.5 Accessories - Market size and forecast 2025-2030

Chart on Accessories - Market size and forecast 2025-2030 ($ million)
Data Table on Accessories - Market size and forecast 2025-2030 ($ million)
Chart on Accessories - Year-over-year growth 2025-2030 (%)
Data Table on Accessories - Year-over-year growth 2025-2030 (%)

10.6 Market opportunity by Product Type

Market opportunity by Product Type ($ million)
Data Table on Market opportunity by Product Type ($ million)

11. Customer Landscape

11.1 Customer landscape overview

Analysis of price sensitivity, lifecycle, customer purchase basket, adoption rates, and purchase criteria

12. Geographic Landscape

12.1 Geographic segmentation

Chart on Market share by geography 2025-2030 (%)
Data Table on Market share by geography 2025-2030 (%)

12.2 Geographic comparison

Chart on Geographic comparison
Data Table on Geographic comparison

12.3 Europe - Market size and forecast 2025-2030

Chart on Europe - Market size and forecast 2025-2030 ($ million)
Data Table on Europe - Market size and forecast 2025-2030 ($ million)
Chart on Europe - Year-over-year growth 2025-2030 (%)
Data Table on Europe - Year-over-year growth 2025-2030 (%)
Chart on Regional Comparison - Europe
Data Table on Regional Comparison - Europe

12.3.1 UK - Market size and forecast 2025-2030

Chart on UK - Market size and forecast 2025-2030 ($ million)
Data Table on UK - Market size and forecast 2025-2030 ($ million)
Chart on UK - Year-over-year growth 2025-2030 (%)
Data Table on UK - Year-over-year growth 2025-2030 (%)

12.3.2 Germany - Market size and forecast 2025-2030

Chart on Germany - Market size and forecast 2025-2030 ($ million)
Data Table on Germany - Market size and forecast 2025-2030 ($ million)
Chart on Germany - Year-over-year growth 2025-2030 (%)
Data Table on Germany - Year-over-year growth 2025-2030 (%)

12.3.3 France - Market size and forecast 2025-2030

Chart on France - Market size and forecast 2025-2030 ($ million)
Data Table on France - Market size and forecast 2025-2030 ($ million)
Chart on France - Year-over-year growth 2025-2030 (%)
Data Table on France - Year-over-year growth 2025-2030 (%)

12.3.4 Spain - Market size and forecast 2025-2030

Chart on Spain - Market size and forecast 2025-2030 ($ million)
Data Table on Spain - Market size and forecast 2025-2030 ($ million)
Chart on Spain - Year-over-year growth 2025-2030 (%)
Data Table on Spain - Year-over-year growth 2025-2030 (%)

12.3.5 Italy - Market size and forecast 2025-2030

Chart on Italy - Market size and forecast 2025-2030 ($ million)
Data Table on Italy - Market size and forecast 2025-2030 ($ million)
Chart on Italy - Year-over-year growth 2025-2030 (%)
Data Table on Italy - Year-over-year growth 2025-2030 (%)

12.3.6 The Netherlands - Market size and forecast 2025-2030

Chart on The Netherlands - Market size and forecast 2025-2030 ($ million)
Data Table on The Netherlands - Market size and forecast 2025-2030 ($ million)
Chart on The Netherlands - Year-over-year growth 2025-2030 (%)
Data Table on The Netherlands - Year-over-year growth 2025-2030 (%)

12.4 South America - Market size and forecast 2025-2030

Chart on South America - Market size and forecast 2025-2030 ($ million)
Data Table on South America - Market size and forecast 2025-2030 ($ million)
Chart on South America - Year-over-year growth 2025-2030 (%)
Data Table on South America - Year-over-year growth 2025-2030 (%)
Chart on Regional Comparison - South America
Data Table on Regional Comparison - South America

12.4.1 Brazil - Market size and forecast 2025-2030

Chart on Brazil - Market size and forecast 2025-2030 ($ million)
Data Table on Brazil - Market size and forecast 2025-2030 ($ million)
Chart on Brazil - Year-over-year growth 2025-2030 (%)
Data Table on Brazil - Year-over-year growth 2025-2030 (%)

12.4.2 Argentina - Market size and forecast 2025-2030

Chart on Argentina - Market size and forecast 2025-2030 ($ million)
Data Table on Argentina - Market size and forecast 2025-2030 ($ million)
Chart on Argentina - Year-over-year growth 2025-2030 (%)
Data Table on Argentina - Year-over-year growth 2025-2030 (%)

12.4.3 Colombia - Market size and forecast 2025-2030

Chart on Colombia - Market size and forecast 2025-2030 ($ million)
Data Table on Colombia - Market size and forecast 2025-2030 ($ million)
Chart on Colombia - Year-over-year growth 2025-2030 (%)
Data Table on Colombia - Year-over-year growth 2025-2030 (%)

12.5 APAC - Market size and forecast 2025-2030

Chart on APAC - Market size and forecast 2025-2030 ($ million)
Data Table on APAC - Market size and forecast 2025-2030 ($ million)
Chart on APAC - Year-over-year growth 2025-2030 (%)
Data Table on APAC - Year-over-year growth 2025-2030 (%)
Chart on Regional Comparison - APAC
Data Table on Regional Comparison - APAC

12.5.1 China - Market size and forecast 2025-2030

Chart on China - Market size and forecast 2025-2030 ($ million)
Data Table on China - Market size and forecast 2025-2030 ($ million)
Chart on China - Year-over-year growth 2025-2030 (%)
Data Table on China - Year-over-year growth 2025-2030 (%)

12.5.2 India - Market size and forecast 2025-2030

Chart on India - Market size and forecast 2025-2030 ($ million)
Data Table on India - Market size and forecast 2025-2030 ($ million)
Chart on India - Year-over-year growth 2025-2030 (%)
Data Table on India - Year-over-year growth 2025-2030 (%)

12.5.3 Japan - Market size and forecast 2025-2030

Chart on Japan - Market size and forecast 2025-2030 ($ million)
Data Table on Japan - Market size and forecast 2025-2030 ($ million)
Chart on Japan - Year-over-year growth 2025-2030 (%)
Data Table on Japan - Year-over-year growth 2025-2030 (%)

12.5.4 Australia - Market size and forecast 2025-2030

Chart on Australia - Market size and forecast 2025-2030 ($ million)
Data Table on Australia - Market size and forecast 2025-2030 ($ million)
Chart on Australia - Year-over-year growth 2025-2030 (%)
Data Table on Australia - Year-over-year growth 2025-2030 (%)

12.5.5 South Korea - Market size and forecast 2025-2030

Chart on South Korea - Market size and forecast 2025-2030 ($ million)
Data Table on South Korea - Market size and forecast 2025-2030 ($ million)
Chart on South Korea - Year-over-year growth 2025-2030 (%)
Data Table on South Korea - Year-over-year growth 2025-2030 (%)

12.5.6 Indonesia - Market size and forecast 2025-2030

Chart on Indonesia - Market size and forecast 2025-2030 ($ million)
Data Table on Indonesia - Market size and forecast 2025-2030 ($ million)
Chart on Indonesia - Year-over-year growth 2025-2030 (%)
Data Table on Indonesia - Year-over-year growth 2025-2030 (%)

12.6 North America - Market size and forecast 2025-2030

Chart on North America - Market size and forecast 2025-2030 ($ million)
Data Table on North America - Market size and forecast 2025-2030 ($ million)
Chart on North America - Year-over-year growth 2025-2030 (%)
Data Table on North America - Year-over-year growth 2025-2030 (%)
Chart on Regional Comparison - North America
Data Table on Regional Comparison - North America

12.6.1 US - Market size and forecast 2025-2030

Chart on US - Market size and forecast 2025-2030 ($ million)
Data Table on US - Market size and forecast 2025-2030 ($ million)
Chart on US - Year-over-year growth 2025-2030 (%)
Data Table on US - Year-over-year growth 2025-2030 (%)

12.6.2 Mexico - Market size and forecast 2025-2030

Chart on Mexico - Market size and forecast 2025-2030 ($ million)
Data Table on Mexico - Market size and forecast 2025-2030 ($ million)
Chart on Mexico - Year-over-year growth 2025-2030 (%)
Data Table on Mexico - Year-over-year growth 2025-2030 (%)

12.6.3 Canada - Market size and forecast 2025-2030

Chart on Canada - Market size and forecast 2025-2030 ($ million)
Data Table on Canada - Market size and forecast 2025-2030 ($ million)
Chart on Canada - Year-over-year growth 2025-2030 (%)
Data Table on Canada - Year-over-year growth 2025-2030 (%)

12.7 Middle East and Africa - Market size and forecast 2025-2030

Chart on Middle East and Africa - Market size and forecast 2025-2030 ($ million)
Data Table on Middle East and Africa - Market size and forecast 2025-2030 ($ million)
Chart on Middle East and Africa - Year-over-year growth 2025-2030 (%)
Data Table on Middle East and Africa - Year-over-year growth 2025-2030 (%)
Chart on Regional Comparison - Middle East and Africa
Data Table on Regional Comparison - Middle East and Africa

12.7.1 South Africa - Market size and forecast 2025-2030

Chart on South Africa - Market size and forecast 2025-2030 ($ million)
Data Table on South Africa - Market size and forecast 2025-2030 ($ million)
Chart on South Africa - Year-over-year growth 2025-2030 (%)
Data Table on South Africa - Year-over-year growth 2025-2030 (%)

12.7.2 Saudi Arabia - Market size and forecast 2025-2030

Chart on Saudi Arabia - Market size and forecast 2025-2030 ($ million)
Data Table on Saudi Arabia - Market size and forecast 2025-2030 ($ million)
Chart on Saudi Arabia - Year-over-year growth 2025-2030 (%)
Data Table on Saudi Arabia - Year-over-year growth 2025-2030 (%)

12.7.3 Egypt - Market size and forecast 2025-2030

Chart on Egypt - Market size and forecast 2025-2030 ($ million)
Data Table on Egypt - Market size and forecast 2025-2030 ($ million)
Chart on Egypt - Year-over-year growth 2025-2030 (%)
Data Table on Egypt - Year-over-year growth 2025-2030 (%)

12.7.4 UAE - Market size and forecast 2025-2030

Chart on UAE - Market size and forecast 2025-2030 ($ million)
Data Table on UAE - Market size and forecast 2025-2030 ($ million)
Chart on UAE - Year-over-year growth 2025-2030 (%)
Data Table on UAE - Year-over-year growth 2025-2030 (%)

12.7.5 Morocco - Market size and forecast 2025-2030

Chart on Morocco - Market size and forecast 2025-2030 ($ million)
Data Table on Morocco - Market size and forecast 2025-2030 ($ million)
Chart on Morocco - Year-over-year growth 2025-2030 (%)
Data Table on Morocco - Year-over-year growth 2025-2030 (%)

12.8 Market opportunity by geography

Market opportunity by geography ($ million)
Data Tables on Market opportunity by geography ($ million)

13. Drivers, Challenges, and Opportunity

13.1 Market drivers

Globalization of media rights distribution and over-the-top streaming monetization
Expansion of international tournament formats and institutional capital investments
Commercial growth of women professional competitions and grassroots market engagement

13.2 Market challenges

Escalating player wage inflation and financial sustainability constraints
Fragmentation of media rights sourcing and changing consumer viewing habits
Fixture congestion, athlete load management, and elevated injury rates

13.3 Impact of drivers and challenges

Impact of drivers and challenges in 2025 and 2030

13.4 Market opportunities

Integration of circular biopolymers and closed-loop recycling in athletic apparel sourcing
Accelerated adoption of connected smart ball technologies and embedded sensor equipment
Proliferation of direct-to-consumer interactive content platforms and personalized fan gamification

14. Competitive Landscape

14.1 Overview

14.2

Overview on criticality of inputs and factors of differentiation

14.3 Landscape disruption

Overview on factors of disruption

14.4 Industry risks

Impact of key risks on business

15. Competitive Analysis

15.1 Companies profiled

Companies covered

15.2 Company ranking index

15.3 Market positioning of companies

Matrix on companies position and classification

15.4 Adidas AG

Adidas AG - Overview
Adidas AG - Business segments
Adidas AG - Key offerings
Adidas AG - Segment focus
SWOT

15.5 ASICS Corp.

ASICS Corp. - Overview
ASICS Corp. - Business segments
ASICS Corp. - Key offerings
ASICS Corp. - Segment focus
SWOT

15.6 Decathlon SA

Decathlon SA - Overview
Decathlon SA - Product / Service
Decathlon SA - Key offerings
SWOT

15.7 Diadora SpA

Diadora SpA - Overview
Diadora SpA - Product / Service
Diadora SpA - Key offerings
SWOT

15.8 KAPPA S.r.l.

KAPPA S.r.l. - Overview
KAPPA S.r.l. - Product / Service
KAPPA S.r.l. - Key offerings
SWOT

15.9 Lotto Sport Italia Spa

Lotto Sport Italia Spa - Overview
Lotto Sport Italia Spa - Product / Service
Lotto Sport Italia Spa - Key offerings
SWOT

15.10 MACRON SPA

MACRON SPA - Overview
MACRON SPA - Product / Service
MACRON SPA - Key offerings
SWOT

15.11 Mizuno Corp.

Mizuno Corp. - Overview
Mizuno Corp. - Business segments
Mizuno Corp. - Key offerings
Mizuno Corp. - Segment focus
SWOT

15.12 New Balance Athletics Inc.

New Balance Athletics Inc. - Overview
New Balance Athletics Inc. - Product / Service
New Balance Athletics Inc. - Key offerings
SWOT

15.13 Nike Inc.

Nike Inc. - Overview
Nike Inc. - Business segments
Nike Inc. - Key offerings
Nike Inc. - Segment focus
SWOT

15.14 PUMA SE

PUMA SE - Overview
PUMA SE - Business segments
PUMA SE - Key offerings
PUMA SE - Segment focus
SWOT

15.15 Umbro

Umbro - Overview
Umbro - Product / Service
Umbro - Key offerings
SWOT

15.16 Under Armour Inc.

Under Armour Inc. - Overview
Under Armour Inc. - Business segments
Under Armour Inc. - Key offerings
Under Armour Inc. - Segment focus
SWOT

15.17 VOIT Corp.

VOIT Corp. - Overview
VOIT Corp. - Product / Service
VOIT Corp. - Key offerings
SWOT

15.18 Wilson Sporting Goods Co.

Wilson Sporting Goods Co. - Overview
Wilson Sporting Goods Co. - Product / Service
Wilson Sporting Goods Co. - Key offerings
SWOT

16. Appendix

16.1 Scope of the report

Market definition
Objectives
Notes and caveats

16.2 Inclusions and exclusions checklist

Inclusions checklist
Exclusions checklist

16.3 Currency conversion rates for US$

16.4 Research methodology

16.5 Data procurement

Information sources

16.6 Data validation

16.7 Validation techniques employed for market sizing

16.8 Data synthesis

16.9 360 degree market analysis

16.10 List of abbreviations

Research Methodology

Technavio presents a detailed picture of the market by way of study, synthesis, and summation of data from multiple sources. The analysts have presented the various facets of the market with a particular focus on identifying the key industry influencers. The data thus presented is comprehensive, reliable, and the result of extensive research, both primary and secondary.

INFORMATION SOURCES

Primary sources

  • Manufacturers and suppliers
  • Channel partners
  • Industry experts
  • Strategic decision makers

Secondary sources

  • Industry journals and periodicals
  • Government data
  • Financial reports of key industry players
  • Historical data
  • Press releases

DATA ANALYSIS

Data Synthesis

  • Collation of data
  • Estimation of key figures
  • Analysis of derived insights

Data Validation

  • Triangulation with data models
  • Reference against proprietary databases
  • Corroboration with industry experts

REPORT WRITING

Qualitative

  • Market drivers
  • Market challenges
  • Market trends
  • Five forces analysis

Quantitative

  • Market size and forecast
  • Market segmentation
  • Geographical insights
  • Competitive landscape

Interested in this report?

Get your sample now to see our research methodology and insights!

Download Now

Frequently Asked Questions

Football market growth will increase by USD 613.6 million during 2026-2030.

The Football market is expected to grow at a CAGR of 3.3% during 2026-2030.

Football market is segmented by Distribution channel (Offline, Online) Type (Training ball, Match ball, Others) Product type (Football equipment, Apparel, Accessories)

Adidas AG, ASICS Corp., Baden Sports Inc., Decathlon SA, Diadora SpA, JOMA SPORT SA, KAPPA S.r.l., Lotto Sport Italia Spa, MACRON SPA, Mizuno Corp., New Balance Athletics Inc., Nike Inc., PUMA SE, Reusch International SpA, Uhlsport GmbH, Umbro, Under Armour Inc., VOIT Corp., Wilson Sporting Goods Co. are a few of the key vendors in the Football market.

Europe will register the highest growth rate of 42.8% among the other regions. Therefore, the Football market in Europe is expected to garner significant business opportunities for the vendors during the forecast period.

UK, Germany, France, Spain, Italy, The Netherlands, Brazil, Argentina, Colombia, China, India, Japan, Australia, South Korea, Indonesia, US, Mexico, Canada, South Africa, Saudi Arabia, Egypt, UAE, Morocco

  • Globalization of media rights distribution and over-the-top streaming monetization is the driving factor this market.

The Football market vendors should focus on grabbing business opportunities from the Distribution channel segment as it accounted for the largest market share in the base year.
RIA - Research AI Assistant
Ask RIA
