Fuel Cells For Marine Vessels Market Analysis, Size, and Forecast 2026-2030: APAC (South Korea, China, and Japan), North America (US, Canada, and Mexico), Europe (Norway, Germany, and The Netherlands), Middle East and Africa (UAE, Saudi Arabia, and Oman), South America (Brazil, Argentina, and Chile), and Rest of World (ROW)

Fuel Cells For Marine Vessels Market Analysis, Size, and Forecast 2026-2030:
APAC (South Korea, China, and Japan), North America (US, Canada, and Mexico), Europe (Norway, Germany, and The Netherlands), Middle East and Africa (UAE, Saudi Arabia, and Oman), South America (Brazil, Argentina, and Chile), and Rest of World (ROW)

Published: Oct 2026 325 Pages SKU: IRTNTR43046

Market Overview at a Glance

$227.7 Mn
Market Opportunity
7.2%
CAGR 2025 - 2030
34.4%
APAC Growth
$227 Mn
Commercial segment 2024

Fuel Cells For Marine Vessels Market Size 2026-2030

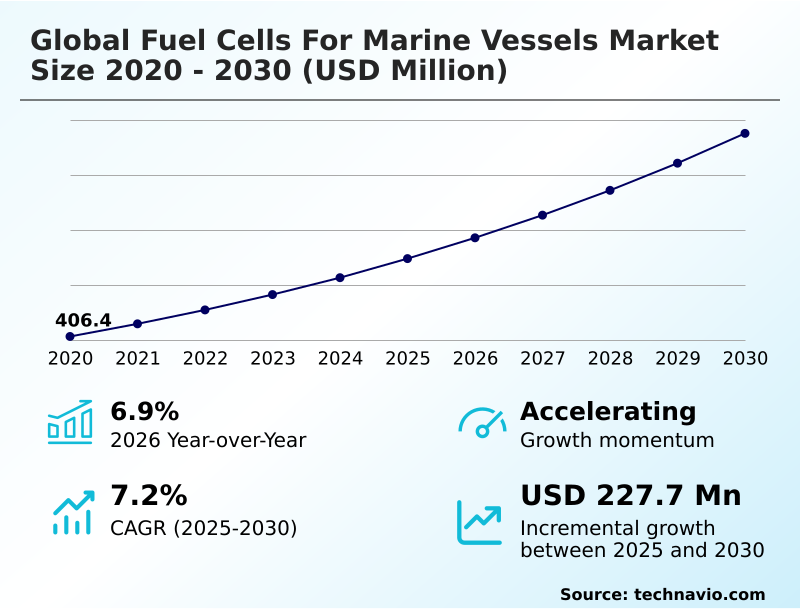
The fuel cells for marine vessels market size is valued to increase by USD 227.7 million, at a CAGR of 7.2% from 2025 to 2030. Stringent maritime emission compliance requirements will drive the fuel cells for marine vessels market.

Major Market Trends & Insights

  • APAC dominated the market and accounted for a 34.4% growth during the forecast period.
  • By Application - Commercial segment was valued at USD 227 million in 2024
  • By Technology - PEMFC segment accounted for the largest market revenue share in 2024

Market Size & Forecast

  • Market Opportunities: USD 369.3 million
  • Market Future Opportunities: USD 227.7 million
  • CAGR from 2025 to 2030 : 7.2%

Market Summary

  • The Fuel Cells For Marine Vessels Market is experiencing accelerated technological adoption as shipping organizations prioritize zero-emission maritime transportation. Vessel operators are aggressively integrating advanced propulsion systems to align with increasingly strict environmental frameworks while maintaining operational reliability.
  • In a recent supply chain optimization scenario, integrating a hydrogen-based power system enabled a regional logistics operator to reduce auxiliary energy expenses by 18% during extended port stays. This efficiency gain highlights the critical operational advantages of electrochemical power conversion.
  • Stringent maritime emission compliance requirements act as the primary force driving this transition, forcing commercial fleets to abandon conventional diesel propulsion in favor of cleaner, high-efficiency alternatives. However, high capital expenditure and project financing constraints remain a significant structural challenge, often delaying fleet modernization schedules for smaller independent shipping enterprises.
  • Continuous improvements in system durability and power density are essential to overcome these financial barriers. As maritime infrastructure steadily evolves, port authorities are expanding alternative fuel bunkering networks to actively support these advanced vessels, fostering a more sustainable, profitable, and resilient marine logistics ecosystem.

What will be the Size of the Fuel Cells For Marine Vessels Market during the forecast period?
Get Key Insights on Market Forecast (PDF) Get Free Sample

How is the Fuel Cells For Marine Vessels Market Segmented?

The fuel cells for marine vessels industry research report provides comprehensive data (region-wise segment analysis), with forecasts and estimates in "USD million" for the period 2026-2030, as well as historical data from 2020-2024 for the following segments.

  • Application
    • Commercial
    • Military
    • Others
  • Technology
    • PEMFC
    • SOFC
    • Others
  • Fuel type
    • Hydrogen
    • Methanol
    • Others
  • Power output
    • More than 200 KW-1000 KW
    • Less than 200 KW
    • More than 1000 KW
  • Geography
    • APAC
      • South Korea
      • China
      • Japan
      • Singapore
      • Australia
      • India
    • North America
      • US
      • Canada
      • Mexico
    • Europe
      • Norway
      • Germany
      • The Netherlands
      • UK
      • Denmark
      • France
    • Middle East and Africa
      • UAE
      • Saudi Arabia
      • Oman
      • Qatar
      • South Africa
    • South America
      • Brazil
      • Argentina
      • Chile

By Application Insights

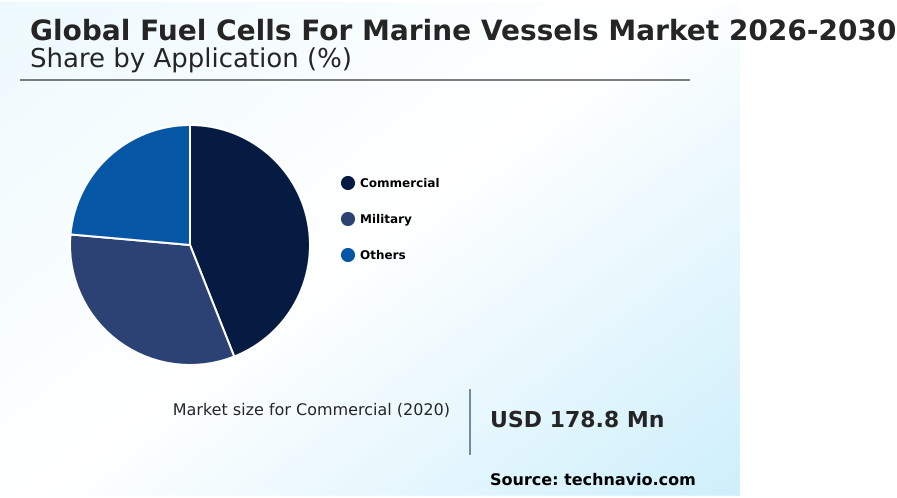
The commercial segment is estimated to witness significant growth during the forecast period.

The commercial application segment dominates the industry as operators seek alternative propulsion methods to meet strict environmental regulations. Integration of the proton exchange membrane and the solid oxide fuel cell into the commercial shipping fleet has increased vessel efficiency.

A passenger ferry operation utilizing hybrid electric propulsion has recorded a 15% reduction in overall fuel consumption compared to traditional diesel configurations.

Additionally, offshore support vessel operators are adopting advanced marine fuel cell stack technologies for continuous auxiliary power generation during stationary activities. Deployment across any cargo transport application and ro pax vessel necessitates rigorous testing for maritime safety.

These operational shifts ensure operators achieve sustainable compliance while minimizing mechanical wear, extending the operational lifecycle of marine vessels.
Get Free Sample

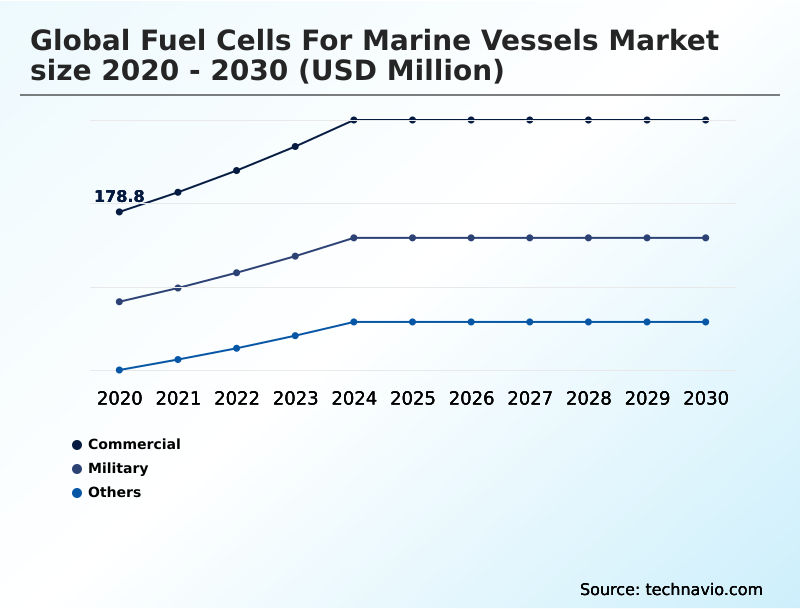
The Commercial segment was valued at USD 227 million in 2024 and showed a gradual increase during the forecast period.
Get Free Sample

Regional Analysis

APAC is estimated to contribute 34.4% to the growth of the global market during the forecast period.Technavio’s analysts have elaborately explained the regional trends and drivers that shape the market during the forecast period.
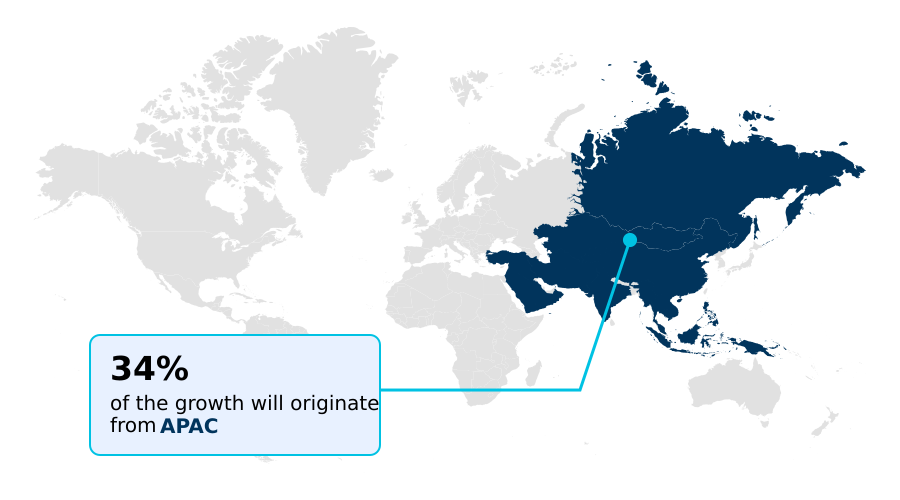
See How Fuel Cells For Marine Vessels Market Demand is Rising in APAC Get Free Sample

The Fuel Cells For Marine Vessels landscape exhibits distinct adoption patterns driven by varying infrastructure readiness and regulatory frameworks.

The APAC region demonstrates accelerated integration within inland waterway transport and port harbor craft, achieving an 18% faster deployment rate for commercial hydrogen systems compared to North America.

This difference originates from aggressive state-sponsored shipbuilding subsidies and expanding hydrogen supply chains in Asian ports. Meanwhile, North American operators prioritize advanced fuel cell powertrain configurations for short sea shipping, realizing a 12% improvement in route efficiency.

The utilization of methanol reformer technology allows operators to bypass complex hydrogen storage limitations, reducing conversion costs by 15%. Additionally, specific defense applications rely on the low acoustic signature of a regenerative fuel cell to enhance naval submarine stealth capabilities.

These regional infrastructure disparities dictate how maritime organizations formulate long-term procurement and fleet modernization strategies.

Market Dynamics

Our researchers analyzed the data with 2025 as the base year, along with the key drivers, trends, and challenges. A holistic analysis of drivers will help companies refine their marketing strategies to gain a competitive advantage.

  • Strategic fleet modernization requires maritime operators to carefully evaluate alternative energy architectures to ensure long-term environmental compliance and operational viability. The successful execution of hydrogen powered commercial shipping integration heavily depends on the availability of robust port infrastructure and specialized refueling networks.
  • Operators utilizing a zero emission port service vessel have observed approximately 25% lower mechanical maintenance costs compared to fleets relying on traditional diesel generator sets, illustrating a clear operational advantage. For long-haul cargo operations, maximizing solid oxide fuel cell efficiency remains a primary engineering focus, as elevated operating temperatures allow for superior fuel utilization over extended voyages.
  • To address the complexities of storing liquid hydrogen, engineering firms are increasingly deploying methanol to hydrogen reformer marine technologies, which safely generate hydrogen onboard and drastically simplify fuel handling procedures. Furthermore, balancing peak power demands during acceleration and maneuvering maneuvers is accomplished through advanced hybrid fuel cell battery propulsion configurations.
  • This combined architecture extends system longevity by absorbing transient loads, thereby reducing stack degradation. Ultimately, selecting the appropriate propulsion and energy management strategy enables shipping companies to align capital investments with evolving emissions frameworks while minimizing overall lifecycle expenditures.
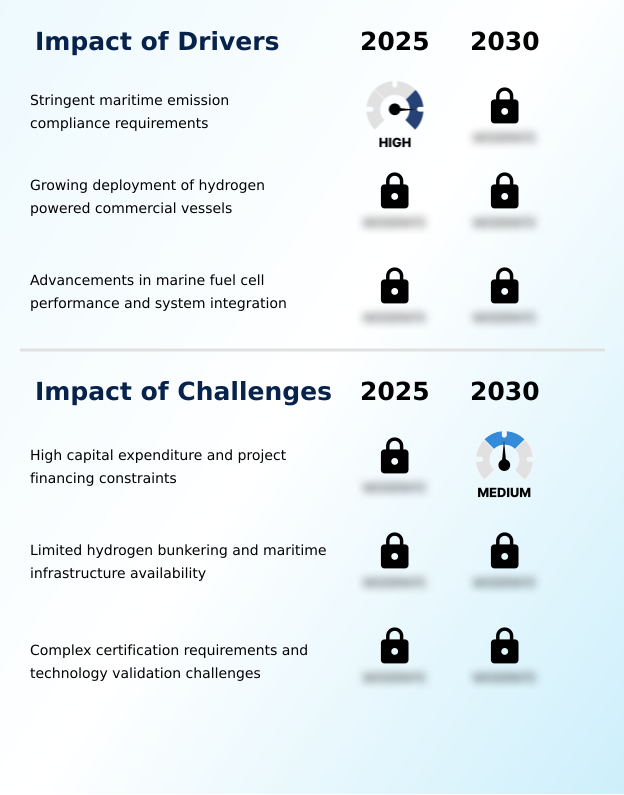
What are the key market drivers leading to the rise in the adoption of Fuel Cells For Marine Vessels Industry?

  • Stringent maritime emission compliance requirements function as a primary driver propelling the adoption of advanced propulsion technologies across the industry.

  • The rapid acceleration of maritime decarbonization technology is fundamentally driven by the enforcement of every new emission compliance standard across international shipping lanes.
  • To avoid substantial regulatory penalties, fleet operators are aggressively adopting electrochemical energy conversion systems capable of utilizing alternative marine fuel.
  • Acquiring critical classification society approval and formal type approval certification has reduced deployment risks, resulting in a 30% faster integration timeline for newly constructed vessels. This regulatory certainty is catalyzing the broader maritime ecosystem transition.
  • Consequently, port authorities are increasing investments in specialized hydrogen bunkering infrastructure to accommodate the rising demand for both green methanol fuel and pure liquid hydrogen fuel.
  • This infrastructure expansion directly lowers supply chain friction, reducing refueling turnaround times by 15% and incentivizing widespread commercial adoption.

What are the market trends shaping the Fuel Cells For Marine Vessels Industry?

  • The increasing integration of fuel cells with battery storage systems represents a prominent trend shaping the maritime industry. This hybrid configuration enhances operational efficiency and effectively manages peak power demands during vessel maneuvers.

  • The maritime industry is undergoing a significant engineering transformation centered on advancing marine propulsion architecture to support decarbonization mandates. Modern shipbuilding engineering increasingly favors the pairing of a sophisticated hydrogen storage system with high-capacity battery energy storage.
  • This hybrid integration significantly improves vessel integration capability, allowing operators to achieve a 24% reduction in peak load stress on primary power generation units. By routing energy through a specialized onboard dc grid, zero emission propulsion becomes highly stable even during demanding maneuvering tasks.
  • Furthermore, an optimized thermal management system coupled with intelligent onboard energy management software facilitates an 18% improvement in overall energy utilization. These technological advancements provide critical operational endurance extension, ensuring that commercial vessels maintain reliable and efficient performance across demanding long-distance marine routes.

What challenges does the Fuel Cells For Marine Vessels Industry face during its growth?

  • High capital expenditure and project financing constraints pose significant challenges that restrict broader commercial implementation across the maritime sector.

  • Despite technological progress, severe operational constraints limit the immediate scalability of advanced propulsion solutions. Executing a comprehensive vessel retrofit program to replace an aging auxiliary diesel generator requires highly complex engineering modifications, often extending out-of-service periods by 25% compared to conventional overhauls.
  • Developing a fully compliant marine certified system is complicated by strict regulatory requirements surrounding each distinct hydrogen handling protocol. Furthermore, achieving long-term reliability demands continuous stack durability optimization and precise bipolar plate design to withstand harsh, corrosive marine environments.
  • While emerging alternatives like the direct methanol fuel cell, advanced ammonia cracking technology, and the specialized liquefied hydrogen carrier offer operational versatility, engineering a truly reliable fuel flexible system remains cost-prohibitive, currently elevating initial capital expenditures by over 40% for early adopters.

Exclusive Technavio Analysis on Customer Landscape

The fuel cells for marine vessels market forecasting report includes the adoption lifecycle of the market, covering from the innovator’s stage to the laggard’s stage. It focuses on adoption rates in different regions based on penetration. Furthermore, the fuel cells for marine vessels market report also includes key purchase criteria and drivers of price sensitivity to help companies evaluate and develop their market growth analysis strategies.
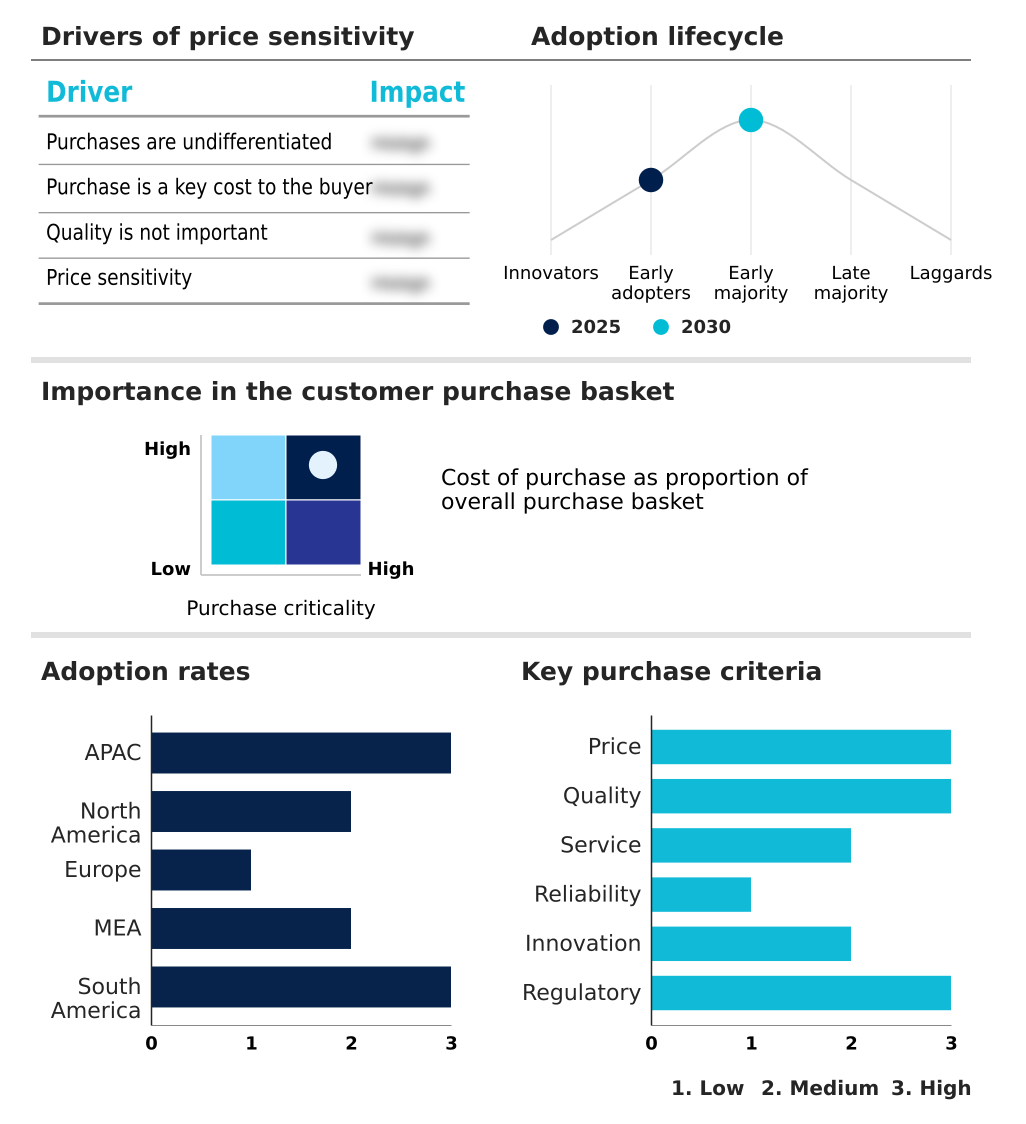
Customer Landscape of Fuel Cells For Marine Vessels Industry

Competitive Landscape

Companies are implementing various strategies, such as strategic alliances, fuel cells for marine vessels market forecast, partnerships, mergers and acquisitions, geographical expansion, and product/service launches, to enhance their presence in the industry.

ABB Ltd. - The organization provides advanced hydrogen fuel cell integration and hybrid electric propulsion configurations, ensuring highly efficient onboard direct current grid connectivity for modernized maritime vessel applications.

The industry research and growth report includes detailed analyses of the competitive landscape of the market and information about key companies, including:

  • ABB Ltd.
  • Alfa Laval AB
  • AVL List GmbH
  • BAE Systems Plc
  • Cummins Inc.
  • EKPO Fuel Cell Technologies GmbH
  • Fincantieri Spa
  • Freudenberg FST GmbH
  • Hanwha Group
  • Honda Motor Co. Ltd.
  • Hyundai Motor Co.
  • MAN Energy Solutions SE
  • Mitsubishi Heavy Industries
  • Naval Group
  • Rolls Royce Power Systems AG
  • SFC Energy AG
  • Siemens Energy AG
  • Toshiba Corp.
  • Toyota Motor Corp.
  • Wartsila Corp.
  • Yanmar Holdings Co. Ltd.

Qualitative and quantitative analysis of companies has been conducted to help clients understand the wider business environment as well as the strengths and weaknesses of key industry players. Data is qualitatively analyzed to categorize companies as pure play, category-focused, industry-focused, and diversified; it is quantitatively analyzed to categorize companies as dominant, leading, strong, tentative, and weak.

Recent Development and News in Fuel cells for marine vessels market

  • In the Renewable Electricity industry, the rapid deployment of industrial scale green hydrogen electrolyzers has significantly expanded clean fuel supply chains, directly impacting Fuel Cells For Marine Vessels demand by reducing the operational fuel costs for zero emission commercial shipping fleets.
  • The introduction of stringent regional emissions pricing mechanisms such as the European Union Emissions Trading System has increased compliance costs for fossil fuel consumption, directly impacting Fuel Cells For Marine Vessels demand by accelerating the adoption of alternative marine propulsion architectures.
  • Advancements in high density lithium ion battery manufacturing have improved hybrid energy storage capabilities, directly impacting Fuel Cells For Marine Vessels demand by enabling more efficient load balancing during peak acceleration and port maneuvering operations.
  • The expansion of commercial methanol reforming and production facilities has diversified sustainable fuel availability, directly impacting Fuel Cells For Marine Vessels demand by providing a practical liquid fuel alternative that simplifies onboard fuel handling and storage requirements.

Dive into Technavio’s robust research methodology, blending expert interviews, extensive data synthesis, and validated models for unparalleled Fuel Cells For Marine Vessels Market insights. See full methodology.

Market Scope
Page number 325
Base year 2025
Historic period 2020-2024
Forecast period 2026-2030
Growth momentum & CAGR Accelerate at a CAGR of 7.2%
Market growth 2026-2030 USD 227.7 million
Market structure Fragmented
YoY growth 2025-2026(%) 6.9%
Key countries South Korea, China, Japan, Singapore, Australia, India, US, Canada, Mexico, Norway, Germany, The Netherlands, UK, Denmark, France, UAE, Saudi Arabia, Oman, Qatar, South Africa, Brazil, Argentina and Chile
Competitive landscape Leading Companies, Market Positioning of Companies, Competitive Strategies, and Industry Risks

Request Free Sample

Research Analyst Overview

  • Advanced electrochemical energy conversion systems are systematically restructuring maritime propulsion strategies and long-term fleet procurement decisions. Boardroom executives are increasingly prioritizing the adoption of the proton exchange membrane to mitigate regulatory exposure and ensure compliance with stringent international emissions standards.
  • The transition toward hybrid electric propulsion allows operators to optimize load balancing, yielding a 20% improvement in dynamic response times compared to legacy mechanical systems. Reliable auxiliary power generation remains critical for sustaining hotel loads and specialized equipment on commercial vessels without generating localized emissions.
  • The durability of the marine fuel cell stack is closely managed through an advanced thermal management system, which prevents overheating and extends the operational lifespan of the core components. Furthermore, sophisticated onboard energy management platforms dynamically allocate power resources, ensuring peak efficiency during variable operational states.
  • However, the successful commercialization of these zero-emission fleets strictly depends on the concurrent expansion of localized hydrogen bunkering infrastructure, which dictates route feasibility and overall supply chain resilience for modern shipping organizations.

What are the Key Data Covered in this Fuel Cells For Marine Vessels Market Research and Growth Report?

  • What is the expected growth of the Fuel Cells For Marine Vessels Market between 2026 and 2030?

    • USD 227.7 million, at a CAGR of 7.2%

  • What segmentation does the market report cover?

    • The report is segmented by Application (Commercial, Military, and Others), Technology (PEMFC, SOFC, and Others), Fuel Type (Hydrogen, Methanol, and Others), Power Output (More than 200 KW-1000 KW, Less than 200 KW, and More than 1000 KW) and Geography (APAC, North America, Europe, Middle East and Africa, South America)

  • Which regions are analyzed in the report?

    • APAC, North America, Europe, Middle East and Africa and South America

  • What are the key growth drivers and market challenges?

    • Stringent maritime emission compliance requirements, High capital expenditure and project financing constraints

  • Who are the major players in the Fuel Cells For Marine Vessels Market?

    • ABB Ltd., Alfa Laval AB, AVL List GmbH, BAE Systems Plc, Cummins Inc., EKPO Fuel Cell Technologies GmbH, Fincantieri Spa, Freudenberg FST GmbH, Hanwha Group, Honda Motor Co. Ltd., Hyundai Motor Co., MAN Energy Solutions SE, Mitsubishi Heavy Industries, Naval Group, Rolls Royce Power Systems AG, SFC Energy AG, Siemens Energy AG, Toshiba Corp., Toyota Motor Corp., Wartsila Corp. and Yanmar Holdings Co. Ltd.

Market Research Insights

  • The Fuel Cells For Marine Vessels Market is transforming as environmental mandates compel the commercial shipping fleet to adopt alternative marine fuel solutions. Transitioning to zero emission propulsion has enabled operators to enhance efficiency while aligning with strict sustainability frameworks. A modernized passenger ferry operation utilizing electrochemical systems reported a 22% reduction in maintenance downtime compared to conventional combustion engines.
  • Furthermore, an offshore support vessel deployment demonstrated a 14% improvement in overall energy utilization during stationary dynamic positioning tasks. These measurable performance gains provide strong financial justification for integrating advanced power architectures, directly reducing lifecycle operational expenditures and mitigating future compliance risks across the maritime sector.

We can help! Our analysts can customize this fuel cells for marine vessels market research report to meet your requirements.

Get in touch

1. Executive Summary

1.1 Market overview

Executive Summary - Chart on Market Overview
Executive Summary - Data Table on Market Overview
Executive Summary - Chart on Global Market Characteristics
Executive Summary - Chart on Market by Geography
Executive Summary - Chart on Market Segmentation by Application
Executive Summary - Chart on Market Segmentation by Technology
Executive Summary - Chart on Market Segmentation by Fuel Type
Executive Summary - Chart on Market Segmentation by Power Output
Executive Summary - Chart on Incremental Growth
Executive Summary - Data Table on Incremental Growth
Executive Summary - Chart on Company Market Positioning

2. Technavio Analysis

2.1 Analysis of price sensitivity, lifecycle, customer purchase basket, adoption rates, and purchase criteria

2.2 Criticality of inputs and Factors of differentiation

Chart on Overview on criticality of inputs and factors of differentiation

2.3 Factors of disruption

Chart on Overview on factors of disruption

2.4 Impact of drivers and challenges

Chart on Impact of drivers and challenges in 2025 and 2030

3. Market Landscape

3.1 Market ecosystem

Chart on Parent Market
Data Table on - Parent Market

3.2 Market characteristics

Chart on Market characteristics analysis

3.3 Value chain analysis

Chart on Value chain analysis

4. Market Sizing

4.1 Market definition

Data Table on Offerings of companies included in the market definition

4.2 Market segment analysis

Market segments

4.3 Market size 2025

4.4 Market outlook: Forecast for 2025-2030

Chart on Global - Market size and forecast 2025-2030 ($ million)
Data Table on Global - Market size and forecast 2025-2030 ($ million)
Chart on Global Market: Year-over-year growth 2025-2030 (%)
Data Table on Global Market: Year-over-year growth 2025-2030 (%)

5. Historic Market Size

5.1 Global Fuel Cells For Marine Vessels Market 2020 - 2024

Historic Market Size - Data Table on Global Fuel Cells For Marine Vessels Market 2020 - 2024 ($ million)

5.2 Application segment analysis 2020 - 2024

Historic Market Size - Application Segment 2020 - 2024 ($ million)

5.3 Technology segment analysis 2020 - 2024

Historic Market Size - Technology Segment 2020 - 2024 ($ million)

5.4 Fuel Type segment analysis 2020 - 2024

Historic Market Size - Fuel Type Segment 2020 - 2024 ($ million)

5.5 Power Output segment analysis 2020 - 2024

Historic Market Size - Power Output Segment 2020 - 2024 ($ million)

5.6 Geography segment analysis 2020 - 2024

Historic Market Size - Geography Segment 2020 - 2024 ($ million)

5.7 Country segment analysis 2020 - 2024

Historic Market Size - Country Segment 2020 - 2024 ($ million)

6. Qualitative Analysis

6.1 Impact of AI on global fuel cells for marine vessels market

6.2 Impact of geopolitical conflicts on global fuel cells for marine vessels market

7. Five Forces Analysis

7.1 Five forces summary

Five forces analysis - Comparison between 2025 and 2030

7.2 Bargaining power of buyers

Bargaining power of buyers - Impact of key factors 2025 and 2030

7.3 Bargaining power of suppliers

Bargaining power of suppliers - Impact of key factors in 2025 and 2030

7.4 Threat of new entrants

Threat of new entrants - Impact of key factors in 2025 and 2030

7.5 Threat of substitutes

Threat of substitutes - Impact of key factors in 2025 and 2030

7.6 Threat of rivalry

Threat of rivalry - Impact of key factors in 2025 and 2030

7.7 Market condition

Chart on Market condition - Five forces 2025 and 2030

8. Market Segmentation by Application

8.1 Market segments

Chart on Application - Market share 2025-2030 (%)
Data Table on Application - Market share 2025-2030 (%)

8.2 Comparison by Application

Chart on Comparison by Application
Data Table on Comparison by Application

8.3 Commercial - Market size and forecast 2025-2030

Chart on Commercial - Market size and forecast 2025-2030 ($ million)
Data Table on Commercial - Market size and forecast 2025-2030 ($ million)
Chart on Commercial - Year-over-year growth 2025-2030 (%)
Data Table on Commercial - Year-over-year growth 2025-2030 (%)

8.4 Military - Market size and forecast 2025-2030

Chart on Military - Market size and forecast 2025-2030 ($ million)
Data Table on Military - Market size and forecast 2025-2030 ($ million)
Chart on Military - Year-over-year growth 2025-2030 (%)
Data Table on Military - Year-over-year growth 2025-2030 (%)

8.5 Others - Market size and forecast 2025-2030

Chart on Others - Market size and forecast 2025-2030 ($ million)
Data Table on Others - Market size and forecast 2025-2030 ($ million)
Chart on Others - Year-over-year growth 2025-2030 (%)
Data Table on Others - Year-over-year growth 2025-2030 (%)

8.6 Market opportunity by Application

Market opportunity by Application ($ million)
Data Table on Market opportunity by Application ($ million)

9. Market Segmentation by Technology

9.1 Market segments

Chart on Technology - Market share 2025-2030 (%)
Data Table on Technology - Market share 2025-2030 (%)

9.2 Comparison by Technology

Chart on Comparison by Technology
Data Table on Comparison by Technology

9.3 PEMFC - Market size and forecast 2025-2030

Chart on PEMFC - Market size and forecast 2025-2030 ($ million)
Data Table on PEMFC - Market size and forecast 2025-2030 ($ million)
Chart on PEMFC - Year-over-year growth 2025-2030 (%)
Data Table on PEMFC - Year-over-year growth 2025-2030 (%)

9.4 SOFC - Market size and forecast 2025-2030

Chart on SOFC - Market size and forecast 2025-2030 ($ million)
Data Table on SOFC - Market size and forecast 2025-2030 ($ million)
Chart on SOFC - Year-over-year growth 2025-2030 (%)
Data Table on SOFC - Year-over-year growth 2025-2030 (%)

9.5 Others - Market size and forecast 2025-2030

Chart on Others - Market size and forecast 2025-2030 ($ million)
Data Table on Others - Market size and forecast 2025-2030 ($ million)
Chart on Others - Year-over-year growth 2025-2030 (%)
Data Table on Others - Year-over-year growth 2025-2030 (%)

9.6 Market opportunity by Technology

Market opportunity by Technology ($ million)
Data Table on Market opportunity by Technology ($ million)

10. Market Segmentation by Fuel Type

10.1 Market segments

Chart on Fuel Type - Market share 2025-2030 (%)
Data Table on Fuel Type - Market share 2025-2030 (%)

10.2 Comparison by Fuel Type

Chart on Comparison by Fuel Type
Data Table on Comparison by Fuel Type

10.3 Hydrogen - Market size and forecast 2025-2030

Chart on Hydrogen - Market size and forecast 2025-2030 ($ million)
Data Table on Hydrogen - Market size and forecast 2025-2030 ($ million)
Chart on Hydrogen - Year-over-year growth 2025-2030 (%)
Data Table on Hydrogen - Year-over-year growth 2025-2030 (%)

10.4 Methanol - Market size and forecast 2025-2030

Chart on Methanol - Market size and forecast 2025-2030 ($ million)
Data Table on Methanol - Market size and forecast 2025-2030 ($ million)
Chart on Methanol - Year-over-year growth 2025-2030 (%)
Data Table on Methanol - Year-over-year growth 2025-2030 (%)

10.5 Others - Market size and forecast 2025-2030

Chart on Others - Market size and forecast 2025-2030 ($ million)
Data Table on Others - Market size and forecast 2025-2030 ($ million)
Chart on Others - Year-over-year growth 2025-2030 (%)
Data Table on Others - Year-over-year growth 2025-2030 (%)

10.6 Market opportunity by Fuel Type

Market opportunity by Fuel Type ($ million)
Data Table on Market opportunity by Fuel Type ($ million)

11. Market Segmentation by Power Output

11.1 Market segments

Chart on Power Output - Market share 2025-2030 (%)
Data Table on Power Output - Market share 2025-2030 (%)

11.2 Comparison by Power Output

Chart on Comparison by Power Output
Data Table on Comparison by Power Output

11.3 More than 200 KW-1000 KW - Market size and forecast 2025-2030

Chart on More than 200 KW-1000 KW - Market size and forecast 2025-2030 ($ million)
Data Table on More than 200 KW-1000 KW - Market size and forecast 2025-2030 ($ million)
Chart on More than 200 KW-1000 KW - Year-over-year growth 2025-2030 (%)
Data Table on More than 200 KW-1000 KW - Year-over-year growth 2025-2030 (%)

11.4 Less than 200 KW - Market size and forecast 2025-2030

Chart on Less than 200 KW - Market size and forecast 2025-2030 ($ million)
Data Table on Less than 200 KW - Market size and forecast 2025-2030 ($ million)
Chart on Less than 200 KW - Year-over-year growth 2025-2030 (%)
Data Table on Less than 200 KW - Year-over-year growth 2025-2030 (%)

11.5 More than 1000 KW - Market size and forecast 2025-2030

Chart on More than 1000 KW - Market size and forecast 2025-2030 ($ million)
Data Table on More than 1000 KW - Market size and forecast 2025-2030 ($ million)
Chart on More than 1000 KW - Year-over-year growth 2025-2030 (%)
Data Table on More than 1000 KW - Year-over-year growth 2025-2030 (%)

11.6 Market opportunity by Power Output

Market opportunity by Power Output ($ million)
Data Table on Market opportunity by Power Output ($ million)

12. Customer Landscape

12.1 Customer landscape overview

Analysis of price sensitivity, lifecycle, customer purchase basket, adoption rates, and purchase criteria

13. Geographic Landscape

13.1 Geographic segmentation

Chart on Market share by geography 2025-2030 (%)
Data Table on Market share by geography 2025-2030 (%)

13.2 Geographic comparison

Chart on Geographic comparison
Data Table on Geographic comparison

13.3 APAC - Market size and forecast 2025-2030

Chart on APAC - Market size and forecast 2025-2030 ($ million)
Data Table on APAC - Market size and forecast 2025-2030 ($ million)
Chart on APAC - Year-over-year growth 2025-2030 (%)
Data Table on APAC - Year-over-year growth 2025-2030 (%)
Chart on Regional Comparison - APAC
Data Table on Regional Comparison - APAC

13.3.1 South Korea - Market size and forecast 2025-2030

Chart on South Korea - Market size and forecast 2025-2030 ($ million)
Data Table on South Korea - Market size and forecast 2025-2030 ($ million)
Chart on South Korea - Year-over-year growth 2025-2030 (%)
Data Table on South Korea - Year-over-year growth 2025-2030 (%)

13.3.2 China - Market size and forecast 2025-2030

Chart on China - Market size and forecast 2025-2030 ($ million)
Data Table on China - Market size and forecast 2025-2030 ($ million)
Chart on China - Year-over-year growth 2025-2030 (%)
Data Table on China - Year-over-year growth 2025-2030 (%)

13.3.3 Japan - Market size and forecast 2025-2030

Chart on Japan - Market size and forecast 2025-2030 ($ million)
Data Table on Japan - Market size and forecast 2025-2030 ($ million)
Chart on Japan - Year-over-year growth 2025-2030 (%)
Data Table on Japan - Year-over-year growth 2025-2030 (%)

13.3.4 Singapore - Market size and forecast 2025-2030

Chart on Singapore - Market size and forecast 2025-2030 ($ million)
Data Table on Singapore - Market size and forecast 2025-2030 ($ million)
Chart on Singapore - Year-over-year growth 2025-2030 (%)
Data Table on Singapore - Year-over-year growth 2025-2030 (%)

13.3.5 Australia - Market size and forecast 2025-2030

Chart on Australia - Market size and forecast 2025-2030 ($ million)
Data Table on Australia - Market size and forecast 2025-2030 ($ million)
Chart on Australia - Year-over-year growth 2025-2030 (%)
Data Table on Australia - Year-over-year growth 2025-2030 (%)

13.3.6 India - Market size and forecast 2025-2030

Chart on India - Market size and forecast 2025-2030 ($ million)
Data Table on India - Market size and forecast 2025-2030 ($ million)
Chart on India - Year-over-year growth 2025-2030 (%)
Data Table on India - Year-over-year growth 2025-2030 (%)

13.4 North America - Market size and forecast 2025-2030

Chart on North America - Market size and forecast 2025-2030 ($ million)
Data Table on North America - Market size and forecast 2025-2030 ($ million)
Chart on North America - Year-over-year growth 2025-2030 (%)
Data Table on North America - Year-over-year growth 2025-2030 (%)
Chart on Regional Comparison - North America
Data Table on Regional Comparison - North America

13.4.1 US - Market size and forecast 2025-2030

Chart on US - Market size and forecast 2025-2030 ($ million)
Data Table on US - Market size and forecast 2025-2030 ($ million)
Chart on US - Year-over-year growth 2025-2030 (%)
Data Table on US - Year-over-year growth 2025-2030 (%)

13.4.2 Canada - Market size and forecast 2025-2030

Chart on Canada - Market size and forecast 2025-2030 ($ million)
Data Table on Canada - Market size and forecast 2025-2030 ($ million)
Chart on Canada - Year-over-year growth 2025-2030 (%)
Data Table on Canada - Year-over-year growth 2025-2030 (%)

13.4.3 Mexico - Market size and forecast 2025-2030

Chart on Mexico - Market size and forecast 2025-2030 ($ million)
Data Table on Mexico - Market size and forecast 2025-2030 ($ million)
Chart on Mexico - Year-over-year growth 2025-2030 (%)
Data Table on Mexico - Year-over-year growth 2025-2030 (%)

13.5 Europe - Market size and forecast 2025-2030

Chart on Europe - Market size and forecast 2025-2030 ($ million)
Data Table on Europe - Market size and forecast 2025-2030 ($ million)
Chart on Europe - Year-over-year growth 2025-2030 (%)
Data Table on Europe - Year-over-year growth 2025-2030 (%)
Chart on Regional Comparison - Europe
Data Table on Regional Comparison - Europe

13.5.1 Norway - Market size and forecast 2025-2030

Chart on Norway - Market size and forecast 2025-2030 ($ million)
Data Table on Norway - Market size and forecast 2025-2030 ($ million)
Chart on Norway - Year-over-year growth 2025-2030 (%)
Data Table on Norway - Year-over-year growth 2025-2030 (%)

13.5.2 Germany - Market size and forecast 2025-2030

Chart on Germany - Market size and forecast 2025-2030 ($ million)
Data Table on Germany - Market size and forecast 2025-2030 ($ million)
Chart on Germany - Year-over-year growth 2025-2030 (%)
Data Table on Germany - Year-over-year growth 2025-2030 (%)

13.5.3 The Netherlands - Market size and forecast 2025-2030

Chart on The Netherlands - Market size and forecast 2025-2030 ($ million)
Data Table on The Netherlands - Market size and forecast 2025-2030 ($ million)
Chart on The Netherlands - Year-over-year growth 2025-2030 (%)
Data Table on The Netherlands - Year-over-year growth 2025-2030 (%)

13.5.4 UK - Market size and forecast 2025-2030

Chart on UK - Market size and forecast 2025-2030 ($ million)
Data Table on UK - Market size and forecast 2025-2030 ($ million)
Chart on UK - Year-over-year growth 2025-2030 (%)
Data Table on UK - Year-over-year growth 2025-2030 (%)

13.5.5 Denmark - Market size and forecast 2025-2030

Chart on Denmark - Market size and forecast 2025-2030 ($ million)
Data Table on Denmark - Market size and forecast 2025-2030 ($ million)
Chart on Denmark - Year-over-year growth 2025-2030 (%)
Data Table on Denmark - Year-over-year growth 2025-2030 (%)

13.5.6 France - Market size and forecast 2025-2030

Chart on France - Market size and forecast 2025-2030 ($ million)
Data Table on France - Market size and forecast 2025-2030 ($ million)
Chart on France - Year-over-year growth 2025-2030 (%)
Data Table on France - Year-over-year growth 2025-2030 (%)

13.6 Middle East and Africa - Market size and forecast 2025-2030

Chart on Middle East and Africa - Market size and forecast 2025-2030 ($ million)
Data Table on Middle East and Africa - Market size and forecast 2025-2030 ($ million)
Chart on Middle East and Africa - Year-over-year growth 2025-2030 (%)
Data Table on Middle East and Africa - Year-over-year growth 2025-2030 (%)
Chart on Regional Comparison - Middle East and Africa
Data Table on Regional Comparison - Middle East and Africa

13.6.1 UAE - Market size and forecast 2025-2030

Chart on UAE - Market size and forecast 2025-2030 ($ million)
Data Table on UAE - Market size and forecast 2025-2030 ($ million)
Chart on UAE - Year-over-year growth 2025-2030 (%)
Data Table on UAE - Year-over-year growth 2025-2030 (%)

13.6.2 Saudi Arabia - Market size and forecast 2025-2030

Chart on Saudi Arabia - Market size and forecast 2025-2030 ($ million)
Data Table on Saudi Arabia - Market size and forecast 2025-2030 ($ million)
Chart on Saudi Arabia - Year-over-year growth 2025-2030 (%)
Data Table on Saudi Arabia - Year-over-year growth 2025-2030 (%)

13.6.3 Oman - Market size and forecast 2025-2030

Chart on Oman - Market size and forecast 2025-2030 ($ million)
Data Table on Oman - Market size and forecast 2025-2030 ($ million)
Chart on Oman - Year-over-year growth 2025-2030 (%)
Data Table on Oman - Year-over-year growth 2025-2030 (%)

13.6.4 Qatar - Market size and forecast 2025-2030

Chart on Qatar - Market size and forecast 2025-2030 ($ million)
Data Table on Qatar - Market size and forecast 2025-2030 ($ million)
Chart on Qatar - Year-over-year growth 2025-2030 (%)
Data Table on Qatar - Year-over-year growth 2025-2030 (%)

13.6.5 South Africa - Market size and forecast 2025-2030

Chart on South Africa - Market size and forecast 2025-2030 ($ million)
Data Table on South Africa - Market size and forecast 2025-2030 ($ million)
Chart on South Africa - Year-over-year growth 2025-2030 (%)
Data Table on South Africa - Year-over-year growth 2025-2030 (%)

13.7 South America - Market size and forecast 2025-2030

Chart on South America - Market size and forecast 2025-2030 ($ million)
Data Table on South America - Market size and forecast 2025-2030 ($ million)
Chart on South America - Year-over-year growth 2025-2030 (%)
Data Table on South America - Year-over-year growth 2025-2030 (%)
Chart on Regional Comparison - South America
Data Table on Regional Comparison - South America

13.7.1 Brazil - Market size and forecast 2025-2030

Chart on Brazil - Market size and forecast 2025-2030 ($ million)
Data Table on Brazil - Market size and forecast 2025-2030 ($ million)
Chart on Brazil - Year-over-year growth 2025-2030 (%)
Data Table on Brazil - Year-over-year growth 2025-2030 (%)

13.7.2 Argentina - Market size and forecast 2025-2030

Chart on Argentina - Market size and forecast 2025-2030 ($ million)
Data Table on Argentina - Market size and forecast 2025-2030 ($ million)
Chart on Argentina - Year-over-year growth 2025-2030 (%)
Data Table on Argentina - Year-over-year growth 2025-2030 (%)

13.7.3 Chile - Market size and forecast 2025-2030

Chart on Chile - Market size and forecast 2025-2030 ($ million)
Data Table on Chile - Market size and forecast 2025-2030 ($ million)
Chart on Chile - Year-over-year growth 2025-2030 (%)
Data Table on Chile - Year-over-year growth 2025-2030 (%)

13.8 Market opportunity by geography

Market opportunity by geography ($ million)
Data Tables on Market opportunity by geography ($ million)

14. Drivers, Challenges, and Opportunity

14.1 Market drivers

Stringent maritime emission compliance requirements
Growing deployment of hydrogen powered commercial vessels
Advancements in marine fuel cell performance and system integration

14.2 Market challenges

High capital expenditure and project financing constraints
Limited hydrogen bunkering and maritime infrastructure availability
Complex certification requirements and technology validation challenges

14.3 Impact of drivers and challenges

Impact of drivers and challenges in 2025 and 2030

14.4 Market opportunities

Increasing integration of fuel cells with batteries
Expansion of fuel-cell applications beyond ferries
Increasing focus on operational integration and crew readiness

15. Competitive Landscape

15.1 Overview

15.2

Overview on criticality of inputs and factors of differentiation

15.3 Landscape disruption

Overview on factors of disruption

15.4 Industry risks

Impact of key risks on business

16. Competitive Analysis

16.1 Companies profiled

Companies covered

16.2 Company ranking index

16.3 Market positioning of companies

Matrix on companies position and classification

16.4 ABB Ltd.

ABB Ltd. - Overview
ABB Ltd. - Business segments
ABB Ltd. - Key news
ABB Ltd. - Key offerings
ABB Ltd. - Segment focus
SWOT

16.5 Alfa Laval AB

Alfa Laval AB - Overview
Alfa Laval AB - Business segments
Alfa Laval AB - Key news
Alfa Laval AB - Key offerings
Alfa Laval AB - Segment focus
SWOT

16.6 BAE Systems Plc

BAE Systems Plc - Overview
BAE Systems Plc - Business segments
BAE Systems Plc - Key news
BAE Systems Plc - Key offerings
BAE Systems Plc - Segment focus
SWOT

16.7 Cummins Inc.

Cummins Inc. - Overview
Cummins Inc. - Business segments
Cummins Inc. - Key news
Cummins Inc. - Key offerings
Cummins Inc. - Segment focus
SWOT

16.8 Fincantieri Spa

Fincantieri Spa - Overview
Fincantieri Spa - Business segments
Fincantieri Spa - Key offerings
Fincantieri Spa - Segment focus
SWOT

16.9 Honda Motor Co. Ltd.

Honda Motor Co. Ltd. - Overview
Honda Motor Co. Ltd. - Business segments
Honda Motor Co. Ltd. - Key offerings
Honda Motor Co. Ltd. - Segment focus
SWOT

16.10 Hyundai Motor Co.

Hyundai Motor Co. - Overview
Hyundai Motor Co. - Business segments
Hyundai Motor Co. - Key news
Hyundai Motor Co. - Key offerings
Hyundai Motor Co. - Segment focus
SWOT

16.11 MAN Energy Solutions SE

MAN Energy Solutions SE - Overview
MAN Energy Solutions SE - Product / Service
MAN Energy Solutions SE - Key offerings
SWOT

16.12 Mitsubishi Heavy Industries

Mitsubishi Heavy Industries - Overview
Mitsubishi Heavy Industries - Business segments
Mitsubishi Heavy Industries - Key news
Mitsubishi Heavy Industries - Key offerings
Mitsubishi Heavy Industries - Segment focus
SWOT

16.13 Rolls Royce Power Systems AG

Rolls Royce Power Systems AG - Overview
Rolls Royce Power Systems AG - Product / Service
Rolls Royce Power Systems AG - Key offerings
SWOT

16.14 SFC Energy AG

SFC Energy AG - Overview
SFC Energy AG - Business segments
SFC Energy AG - Key offerings
SFC Energy AG - Segment focus
SWOT

16.15 Siemens Energy AG

Siemens Energy AG - Overview
Siemens Energy AG - Business segments
Siemens Energy AG - Key news
Siemens Energy AG - Key offerings
Siemens Energy AG - Segment focus
SWOT

16.16 Toyota Motor Corp.

Toyota Motor Corp. - Overview
Toyota Motor Corp. - Business segments
Toyota Motor Corp. - Key offerings
Toyota Motor Corp. - Segment focus
SWOT

16.17 Wartsila Corp.

Wartsila Corp. - Overview
Wartsila Corp. - Business segments
Wartsila Corp. - Key news
Wartsila Corp. - Key offerings
Wartsila Corp. - Segment focus
SWOT

16.18 Yanmar Holdings Co. Ltd.

Yanmar Holdings Co. Ltd. - Overview
Yanmar Holdings Co. Ltd. - Product / Service
Yanmar Holdings Co. Ltd. - Key offerings
SWOT

17. Appendix

17.1 Scope of the report

Market definition
Objectives
Notes and caveats

17.2 Inclusions and exclusions checklist

Inclusions checklist
Exclusions checklist

17.3 Currency conversion rates for US$

17.4 Research methodology

17.5 Data procurement

Information sources

17.6 Data validation

17.7 Validation techniques employed for market sizing

17.8 Data synthesis

17.9 360 degree market analysis

17.10 List of abbreviations

Research Methodology

Technavio presents a detailed picture of the market by way of study, synthesis, and summation of data from multiple sources. The analysts have presented the various facets of the market with a particular focus on identifying the key industry influencers. The data thus presented is comprehensive, reliable, and the result of extensive research, both primary and secondary.

INFORMATION SOURCES

Primary sources

  • Manufacturers and suppliers
  • Channel partners
  • Industry experts
  • Strategic decision makers

Secondary sources

  • Industry journals and periodicals
  • Government data
  • Financial reports of key industry players
  • Historical data
  • Press releases

DATA ANALYSIS

Data Synthesis

  • Collation of data
  • Estimation of key figures
  • Analysis of derived insights

Data Validation

  • Triangulation with data models
  • Reference against proprietary databases
  • Corroboration with industry experts

REPORT WRITING

Qualitative

  • Market drivers
  • Market challenges
  • Market trends
  • Five forces analysis

Quantitative

  • Market size and forecast
  • Market segmentation
  • Geographical insights
  • Competitive landscape

Interested in this report?

Get your sample now to see our research methodology and insights!

Download Now

Frequently Asked Questions

Fuel Cells For Marine Vessels market growth will increase by USD 227.7 million during 2026-2030.

The Fuel Cells For Marine Vessels market is expected to grow at a CAGR of 7.2% during 2026-2030.

Fuel Cells For Marine Vessels market is segmented by Application (Commercial, Military, Others) Technology (PEMFC, SOFC, Others) Fuel type (Hydrogen, Methanol, Others) Power output (More than 200 KW-1000 KW, Less than 200 KW, More than 1000 KW)

ABB Ltd., Alfa Laval AB, AVL List GmbH, BAE Systems Plc, Cummins Inc., EKPO Fuel Cell Technologies GmbH, Fincantieri Spa, Freudenberg FST GmbH, Hanwha Group, Honda Motor Co. Ltd., Hyundai Motor Co., MAN Energy Solutions SE, Mitsubishi Heavy Industries, Naval Group, Rolls Royce Power Systems AG, SFC Energy AG, Siemens Energy AG, Toshiba Corp., Toyota Motor Corp., Wartsila Corp., Yanmar Holdings Co. Ltd. are a few of the key vendors in the Fuel Cells For Marine Vessels market.

APAC will register the highest growth rate of 34.4% among the other regions. Therefore, the Fuel Cells For Marine Vessels market in APAC is expected to garner significant business opportunities for the vendors during the forecast period.

South Korea, China, Japan, Singapore, Australia, India, US, Canada, Mexico, Norway, Germany, The Netherlands, UK, Denmark, France, UAE, Saudi Arabia, Oman, Qatar, South Africa, Brazil, Argentina, Chile

  • Stringent maritime emission compliance requirements is the driving factor this market.

The Fuel Cells For Marine Vessels market vendors should focus on grabbing business opportunities from the Application segment as it accounted for the largest market share in the base year.
RIA - Research AI Assistant
Ask RIA
