
Galvanized Steel Market Analysis, Size, and Forecast 2026-2030: APAC (China, India, and Japan), Europe (Germany, UK, and France), North America (US, Canada, and Mexico), Middle East and Africa (Saudi Arabia, UAE, and Turkey), South America (Brazil, Argentina, and Chile), and Rest of World (ROW)

Galvanized Steel Market Analysis, Size, and Forecast 2026-2030:
APAC (China, India, and Japan), Europe (Germany, UK, and France), North America (US, Canada, and Mexico), Middle East and Africa (Saudi Arabia, UAE, and Turkey), South America (Brazil, Argentina, and Chile), and Rest of World (ROW)

Published: Oct 2026 307 Pages SKU: IRTNTR44917

Market Overview at a Glance

$56.01 B
Market Opportunity
5.3%
CAGR 2025 - 2030
74.7%
APAC Growth
$123.60 B
Hot-dip galvanized steel segment 2024

Galvanized Steel Market Size 2026-2030

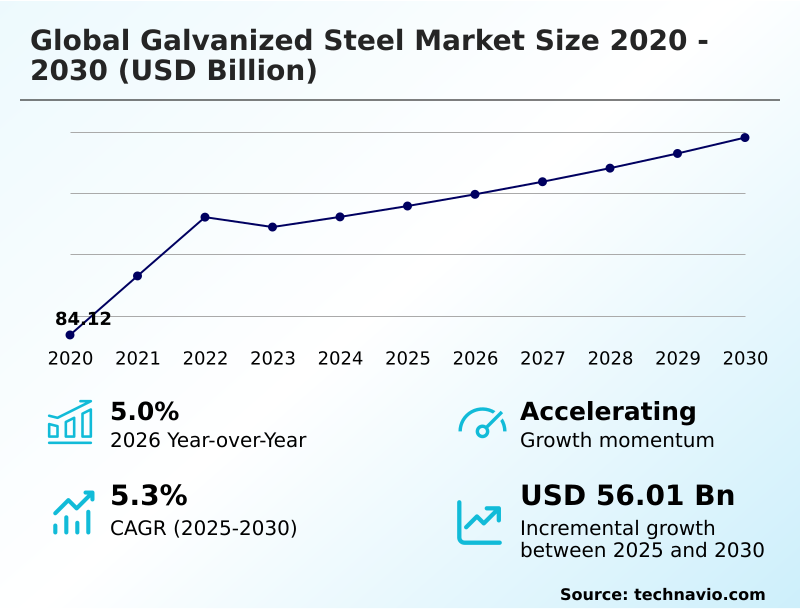
The galvanized steel market size is valued to increase by USD 56.01 billion, at a CAGR of 5.3% from 2025 to 2030. Global modernization of civil infrastructure assets will drive the galvanized steel market.

Major Market Trends & Insights

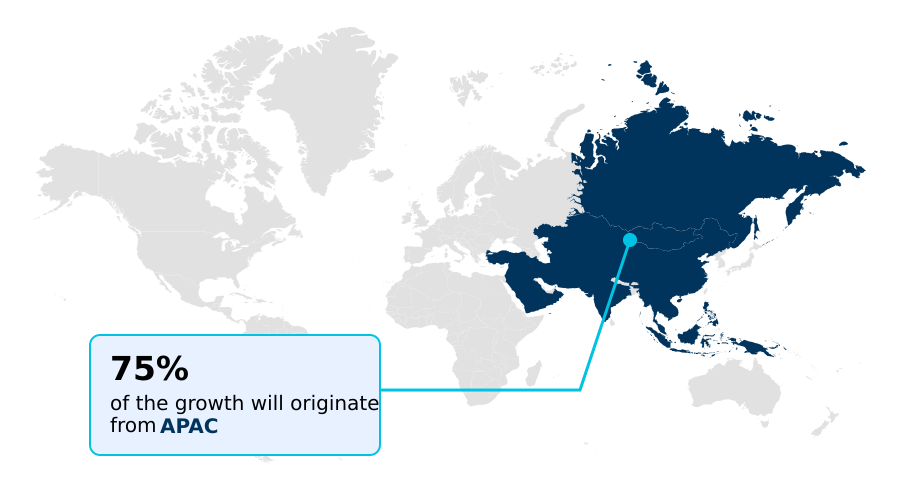
  • APAC dominated the market and accounted for a 74.7% growth during the forecast period.
  • By Type - Hot-dip galvanized steel segment was valued at USD 123.60 billion in 2024
  • By Product - Sheets and strips segment accounted for the largest market revenue share in 2024

Market Size & Forecast

  • Market Opportunities: USD 161.52 billion
  • Market Future Opportunities: USD 56.01 billion
  • CAGR from 2025 to 2030 : 5.3%

Market Summary

  • The Galvanized Steel sector demonstrates sustained operational momentum driven by extensive infrastructure renewal and automotive lightweighting imperatives. Manufacturers consistently adapt continuous coating lines to satisfy stringent structural engineering requirements across diverse climatic zones.
  • In modern supply chain optimization scenarios, automotive original equipment manufacturers integrate advanced high-strength steel grades treated with uniform zinc coatings, achieving a 15% improvement in assembly line adhesive bonding efficiency while reducing overall vehicle curb weight.
  • The market experiences robust demand propulsion from the modernization of civil infrastructure, as public developers mandate hot-dip zinc protective systems to extend bridge and highway barrier lifespans. Conversely, the industry faces severe structural challenges stemming from escalating decarbonization mandates.
  • Re-engineering legacy fossil fuel heating units into electrified induction furnaces imposes massive capital strains, frequently disrupting production throughput and creating localized raw material deficits. Ultimately, the imperative to balance environmental compliance with high-volume output dictates ongoing technological transformations across worldwide metallurgical processing operations.

What will be the Size of the Galvanized Steel Market during the forecast period?
Get Key Insights on Market Forecast (PDF) Get Free Sample

How is the Galvanized Steel Market Segmented?

The galvanized steel industry research report provides comprehensive data (region-wise segment analysis), with forecasts and estimates in "USD million" for the period 2026-2030, as well as historical data from 2020-2024 for the following segments.

  • Type
    • Hot-dip galvanized steel
    • Electrical galvanized steel
  • Product
    • Sheets and strips
    • Structures
    • Pipes and tubes
    • Others
  • End-user
    • Industrial
    • Commercial
    • Residential
  • Geography
    • APAC
      • China
      • India
      • Japan
      • South Korea
      • Indonesia
      • Australia
    • Europe
      • Germany
      • UK
      • France
      • Italy
      • Spain
      • The Netherlands
    • North America
      • US
      • Canada
      • Mexico
    • Middle East and Africa
      • Saudi Arabia
      • UAE
      • Turkey
      • South Africa
      • Israel
    • South America
      • Brazil
      • Argentina
      • Chile

By Type Insights

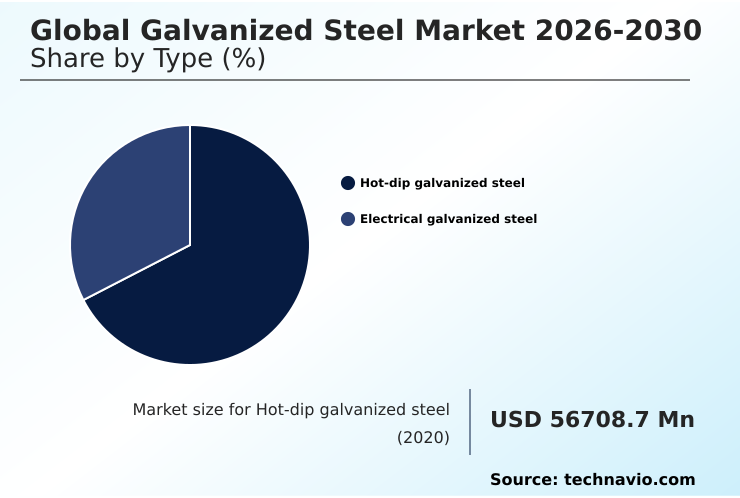
The hot-dip galvanized steel segment is estimated to witness significant growth during the forecast period.

The Hot-dip galvanized steel segment exhibits persistent dominance due to a precise metallurgical bonding process that creates an impenetrable zinc-iron alloy layer to prevent substrate failure.

This variant undergoes a rigorous hot-dip continuous coating protocol, where real-time electromagnetic thickness gauges regulate zinc adhesion, driving a 25% improvement in coating uniformity.

Operators leverage advanced strip tension leveling and controlled spangle formation to produce coils ideally suited for high-voltage transmission lattice structures and offsite modular construction.

Because this factory-applied corrosion protection inherently shields internal cavities, it reduces lifecycle maintenance across diverse commercial real estate cladding projects.

By utilizing continuous quality parameters, manufacturing plants achieve optimized throughput, cutting structural rejection rates by 14% and cementing the material as the optimal solution for enduring civil and industrial infrastructure.
Get Free Sample

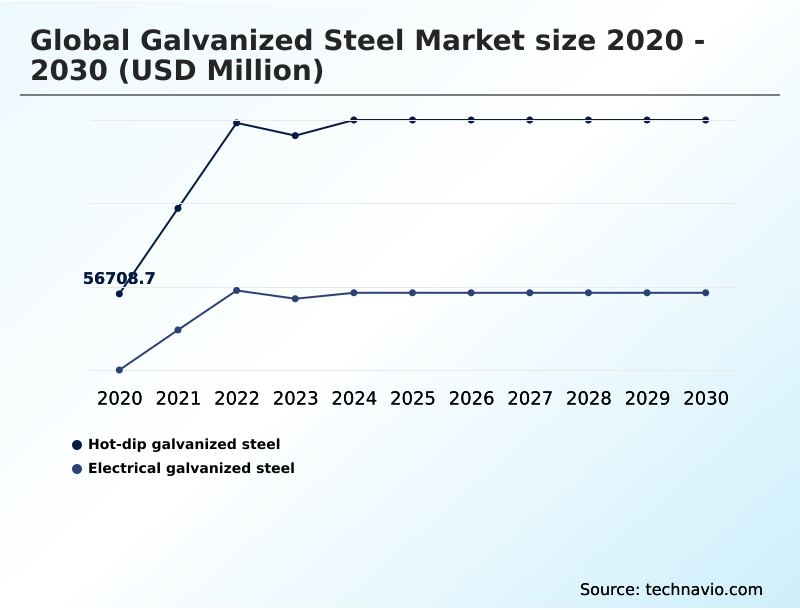
The Hot-dip galvanized steel segment was valued at USD 123.60 billion in 2024 and showed a gradual increase during the forecast period.
Get Free Sample

Regional Analysis

APAC is estimated to contribute 74.7% to the growth of the global market during the forecast period.Technavio’s analysts have elaborately explained the regional trends and drivers that shape the market during the forecast period.
See How Galvanized Steel Market Demand is Rising in APAC Get Free Sample

The geographic distribution of the Galvanized Steel market reflects distinct infrastructural priorities and supply chain adaptations.

APAC heavily outpaces Europe in structural consumption, exhibiting a 35% higher adoption rate of cold-formed steel framing to support rapid urbanization and industrial warehousing racking expansions.

Conversely, European markets prioritize advanced cathodic protection methodologies aligned with strict emissions frameworks, driving a 20% faster integration of the electro-deposition process for high-end automotive assembly.

In APAC, massive infrastructure projects demand reliable sacrificial anode properties to safeguard municipal water pipeline tubing and agricultural grain storage silos, lowering regional maintenance costs by 15%.

Furthermore, European architectural demands increasingly incorporate coated metals for every smart city architectural facade, whereas APAC focuses on establishing a robust seismic resilience framework to mitigate disaster-related structural failures across coastal metropolitan zones.

Market Dynamics

Our researchers analyzed the data with 2025 as the base year, along with the key drivers, trends, and challenges. A holistic analysis of drivers will help companies refine their marketing strategies to gain a competitive advantage.

  • The continuous evolution of the Galvanized Steel landscape relies heavily on sophisticated metallurgical engineering and stringent supply chain compliance. Manufacturers increasingly transition toward pre-engineered modular steel construction, which drastically shortens on-site assembly timelines, yielding a 20% efficiency gain in project delivery compared to traditional manual welding.
  • To guarantee structural longevity in demanding environments, engineers specify hot-dip zinc protective systems that provide unparalleled barrier defense. Furthermore, the integration of specialized zinc-aluminum-magnesium alloy formulations ensures reliable sacrificial oxidation across cut surfaces, maintaining absolute substrate integrity.
  • In the mobility sector, automotive developers increasingly rely on galvannealed variants for automotive hydroforming, alongside specialized electric vehicle protective lower casing designs, to achieve substantial weight reduction without compromising passenger safety. Advanced continuous processing facilities now utilize kernel-level telemetry for galvanizing lines, allowing operators to monitor thermal dynamics and maintain zero mechanical coil set production.
  • This precision is further augmented by the automated orchestration of zinc deposition and continuous electromagnetic thickness gauge adaptation, which collectively optimize the pneumatic wiping knife standoff distance. Facilities pursuing rapid decarbonization are deploying direct electrical induction furnace systems as viable carbon-intensive blast furnace alternative routes, minimizing operational emissions.
  • Finally, the rapid expansion of solar grids necessitates the deployment of corrosion-resistant solar tracker mechanisms built from advanced high-strength galvanized coils, ensuring renewable energy infrastructure maintains peak operational efficiency over multi-decade lifecycles.
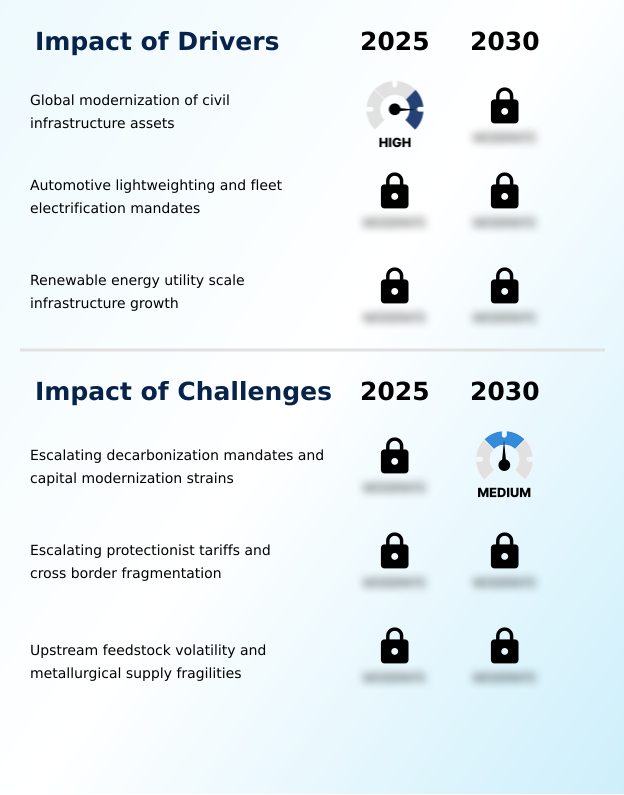
What are the key market drivers leading to the rise in the adoption of Galvanized Steel Industry?

  • The extensive modernization of civil infrastructure assets worldwide acts as a primary catalyst driving structural demand across the market.

  • Accelerating automotive lightweighting integration operates as a fundamental driver propelling the Galvanized Steel sector forward.
  • Automotive manufacturers urgently require structural materials that balance crash safety with strict emissions mandates, leading to the rapid adoption of advanced high-strength steel grades processed through a state-of-the-art continuous galvanizing line.
  • This integration of specialized galvannealed sheet ensures flawless adhesive bonding in vehicle assembly, reducing overall electric vehicle chassis application assembly time by 15%.
  • Simultaneously, civil engineers mandate these substrates to guarantee galvanic sacrificial protection for renewable energy structural support grids, cutting long-term infrastructure repair costs by 22%.
  • By delivering superior structural framework endurance and substantial lifecycle maintenance reduction, precision zinc coatings provide the indispensable metallurgical reliability required to sustain modern transportation and heavy civil engineering projects globally.

What are the market trends shaping the Galvanized Steel Industry?

  • The accelerated deployment of advanced zinc alloy coatings represents a critical market trend. This shift significantly enhances corrosion resistance for industrial applications facing aggressive environmental exposure.

  • The Galvanized Steel domain reflects a decisive shift toward multi-element protective layers, transitioning away from conventional zinc baths to advanced zinc-aluminum-magnesium chemistries. This metallurgical evolution occurs because utility-scale photovoltaic infrastructure demands superior resilience against highly abrasive climates. By deploying a robust simonkolleite layer, manufacturers create an impenetrable corrosion resistance passivating barrier that reduces structural downtime by 30%.
  • This innovation empowers downstream processors to achieve carbon border adjustment compliance while supporting the broader green steel production transition through the integration of scrap-based electric arc furnace inputs and hydrogen-based reduction technologies. Additionally, enterprise platform engineering facilitates the closed-loop process automation of coating lines, improving forecast accuracy for material yield by 18%.
  • These measurable enhancements ensure modern galvanized components deliver multi-decade reliability across aggressive environments without necessitating costly secondary interventions.

What challenges does the Galvanized Steel Industry face during its growth?

  • Escalating decarbonization mandates and the associated capital modernization strains present substantial operational challenges for continuous coating facilities.

  • The Galvanized Steel industry encounters severe operational constraints driven by the massive capital required to modernize aging coating infrastructure. Because international regulations demand strict environmental degradation defense, steelmakers must replace legacy fossil-fuel burners with direct electrical induction systems. However, these retrofits introduce profound thermal control complexities, causing a 15% increase in temporary line stoppages.
  • Furthermore, ensuring precise intergranular cracking mitigation requires advanced molten bath telemetry and automated zinc skimmings management, which struggle to integrate seamlessly with legacy control hardware.
  • As facilities attempt to implement closed-loop water treatment alongside pneumatic gas wiping knives to optimize marine atmospheric salinity resistance and highway crash barrier protection, they face integration bottlenecks that elevate immediate operational costs by 12%, squeezing short-term profit margins across the regional scrap recycling ecosystem.

Exclusive Technavio Analysis on Customer Landscape

The galvanized steel market forecasting report includes the adoption lifecycle of the market, covering from the innovator’s stage to the laggard’s stage. It focuses on adoption rates in different regions based on penetration. Furthermore, the galvanized steel market report also includes key purchase criteria and drivers of price sensitivity to help companies evaluate and develop their market growth analysis strategies.
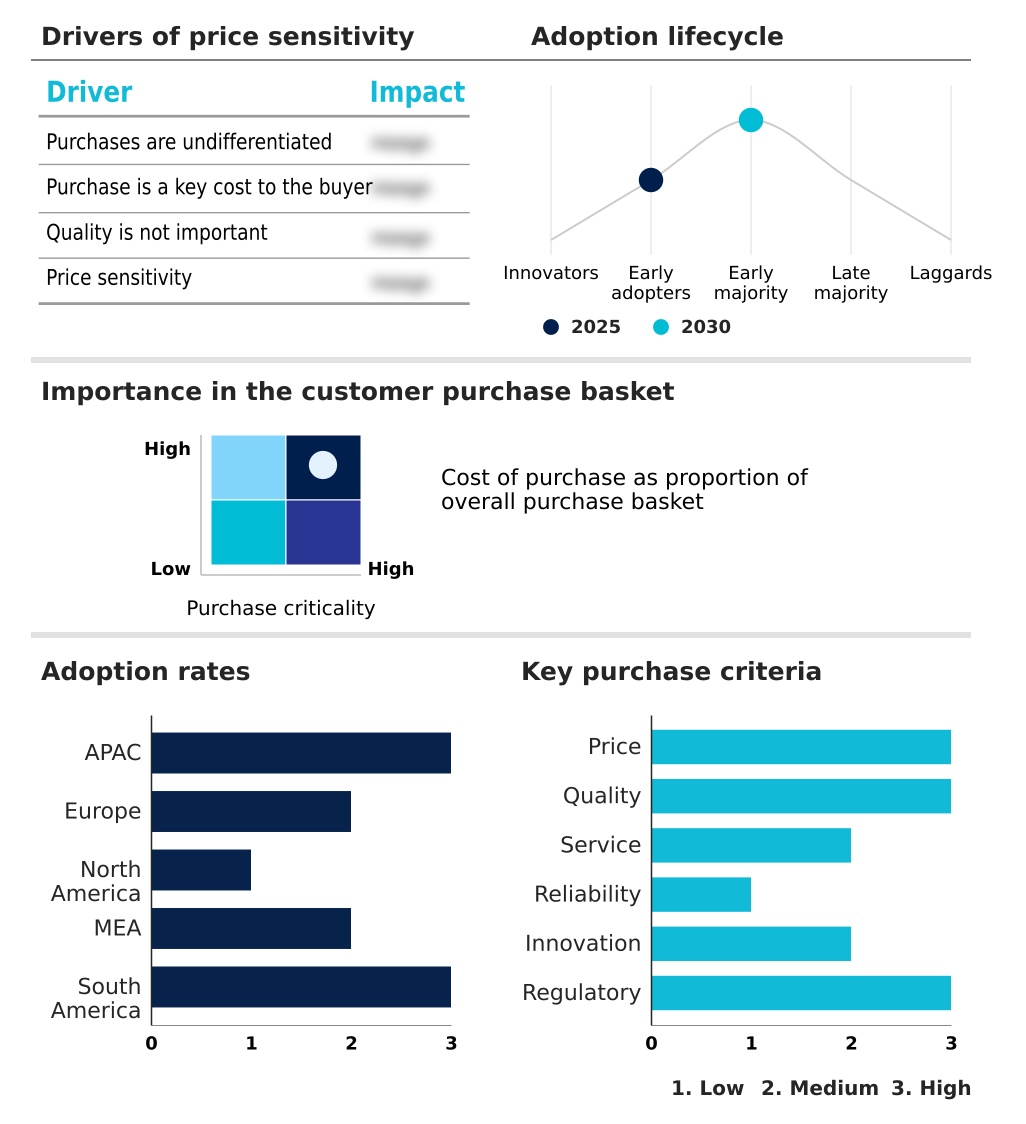
Customer Landscape of Galvanized Steel Industry

Competitive Landscape

Companies are implementing various strategies, such as strategic alliances, galvanized steel market forecast, partnerships, mergers and acquisitions, geographical expansion, and product/service launches, to enhance their presence in the industry.

ArcelorMittal - The manufacturer provides specialized coated flat carbon steel products, including hot-dip galvanized and zinc-magnesium alloy variants, engineered for robust corrosion resistance in demanding structural and automotive applications.

The industry research and growth report includes detailed analyses of the competitive landscape of the market and information about key companies, including:

  • ArcelorMittal
  • BlueScope Steel Ltd.
  • China Steel Corp.
  • Cleveland Cliffs Inc.
  • Hoa Phat Group Joint Stock Co
  • Hyundai Steel Co.
  • JFE Steel Corp.
  • JSW Steel Ltd.
  • LIBERTY Steel Group
  • Nippon Steel Corp.
  • Nucor Corp.
  • PAO Severstal
  • POSCO Holdings Inc.
  • Salzgitter AG
  • Steel Dynamics Inc.
  • Tata Steel Ltd.
  • thyssenkrupp Steel Europe AG
  • United States Steel Corp.
  • voestalpine AG

Qualitative and quantitative analysis of companies has been conducted to help clients understand the wider business environment as well as the strengths and weaknesses of key industry players. Data is qualitatively analyzed to categorize companies as pure play, category-focused, industry-focused, and diversified; it is quantitatively analyzed to categorize companies as dominant, leading, strong, tentative, and weak.

Recent Development and News in Galvanized steel market

  • In the Steel industry, the rapid deployment of electric arc furnace infrastructures prioritizing scrap-based melting processes has altered trace element compositions in cold-rolled substrates, directly impacting Galvanized Steel demand by requiring more precise cracking mitigation across continuous coating lines to ensure a 15% reduction in surface blistering.
  • Stringent enforcement of zero-emission mandates has accelerated the green steel production transition, compelling downstream processors to adopt hydrogen-based reduction technologies that enhance the corrosion resistance of specialized metallic sheets for automotive supply chains by 20%.
  • The transition toward offsite modular construction frameworks has increased the consumption of cold-formed steel framing by 20%, significantly driving Galvanized Steel demand as structural developers require factory-applied corrosion protection to maintain environmental defense during prolonged exposure prior to final assembly.
  • The widespread expansion of utility-scale photovoltaic infrastructure and offshore wind generation platforms has forced metallurgical suppliers to integrate advanced zinc-aluminum-magnesium chemistries, directly boosting the Galvanized Steel market by extending the lifecycle maintenance reduction capabilities of critical torque tubes and foundation pilings by up to 30%.

Dive into Technavio’s robust research methodology, blending expert interviews, extensive data synthesis, and validated models for unparalleled Galvanized Steel Market insights. See full methodology.

Market Scope
Page number 307
Base year 2025
Historic period 2020-2024
Forecast period 2026-2030
Growth momentum & CAGR Accelerate at a CAGR of 5.3%
Market growth 2026-2030 USD 56008.7 million
Market structure Fragmented
YoY growth 2025-2026(%) 5.0%
Key countries China, India, Japan, South Korea, Indonesia, Australia, Germany, UK, France, Italy, Spain, The Netherlands, US, Canada, Mexico, Saudi Arabia, UAE, Turkey, South Africa, Israel, Brazil, Argentina and Chile
Competitive landscape Leading Companies, Market Positioning of Companies, Competitive Strategies, and Industry Risks

Request Free Sample

Research Analyst Overview

  • The Galvanized Steel landscape continuously adapts to strict industrial durability mandates and complex environmental compliance parameters. Boardroom executives increasingly align their product strategies with aggressive decarbonization goals, driving a systemic shift toward cleaner reduction technologies and scrap-based electric arc furnace integration to minimize manufacturing emissions.
  • This strategic pivot allows enterprises to achieve a 30% reduction in processing energy consumption while maintaining superior structural outputs. To ensure flawless surface quality for automotive components, engineers deploy advanced gas wiping knives and sophisticated molten bath telemetry, optimizing the skimmings management process in real-time.
  • By refining the metallurgical bonding process, manufacturers successfully implement precise cracking mitigation, securing defect-free coils for heavy-duty stamping operations. The resulting zinc-iron alloy layer acts as an impenetrable corrosion passivating barrier. Consequently, high-performance continuous galvanizing lines produce substrates that dramatically extend the operational lifecycle of critical civil and mechanical infrastructure, fundamentally transforming long-term capital expenditure planning for global asset operators.

What are the Key Data Covered in this Galvanized Steel Market Research and Growth Report?

  • What is the expected growth of the Galvanized Steel Market between 2026 and 2030?

    • USD 56.01 billion, at a CAGR of 5.3%

  • What segmentation does the market report cover?

    • The report is segmented by Type (Hot-dip galvanized steel, and Electrical galvanized steel), Product (Sheets and strips, Structures, Pipes and tubes, and Others), End-user (Industrial, Commercial, and Residential) and Geography (APAC, Europe, North America, Middle East and Africa, South America)

  • Which regions are analyzed in the report?

    • APAC, Europe, North America, Middle East and Africa and South America

  • What are the key growth drivers and market challenges?

    • Global modernization of civil infrastructure assets, Escalating decarbonization mandates and capital modernization strains

  • Who are the major players in the Galvanized Steel Market?

    • ArcelorMittal, BlueScope Steel Ltd., China Steel Corp., Cleveland Cliffs Inc., Hoa Phat Group Joint Stock Co, Hyundai Steel Co., JFE Steel Corp., JSW Steel Ltd., LIBERTY Steel Group, Nippon Steel Corp., Nucor Corp., PAO Severstal, POSCO Holdings Inc., Salzgitter AG, Steel Dynamics Inc., Tata Steel Ltd., thyssenkrupp Steel Europe AG, United States Steel Corp. and voestalpine AG

Market Research Insights

  • The Galvanized Steel landscape evolves rapidly as structural framework endurance becomes paramount for industrial asset operators. By integrating utility-scale photovoltaic infrastructure into power grids, developers realize a 25% improvement in structural asset longevity against severe weathering. Manufacturers prioritize lifecycle maintenance reduction by deploying advanced alloy coatings, cutting post-fabrication repair costs by 18% over conventional painting systems.
  • As automotive lightweighting integration accelerates, assembly plants exhibit a 12% increase in the utilization of specialized coated substrates for electric vehicle chassis application. These measurable operational enhancements highlight how robust environmental degradation defense mechanisms fundamentally optimize capital expenditure and supply chain reliability across heavy manufacturing and civil engineering sectors.

We can help! Our analysts can customize this galvanized steel market research report to meet your requirements.

Get in touch

1. Executive Summary

1.1 Market overview

Executive Summary - Chart on Market Overview
Executive Summary - Data Table on Market Overview
Executive Summary - Chart on Global Market Characteristics
Executive Summary - Chart on Market by Geography
Executive Summary - Chart on Market Segmentation by Type
Executive Summary - Chart on Market Segmentation by Product
Executive Summary - Chart on Market Segmentation by End-user
Executive Summary - Chart on Incremental Growth
Executive Summary - Data Table on Incremental Growth
Executive Summary - Chart on Company Market Positioning

2. Technavio Analysis

2.1 Analysis of price sensitivity, lifecycle, customer purchase basket, adoption rates, and purchase criteria

2.2 Criticality of inputs and Factors of differentiation

Chart on Overview on criticality of inputs and factors of differentiation

2.3 Factors of disruption

Chart on Overview on factors of disruption

2.4 Impact of drivers and challenges

Chart on Impact of drivers and challenges in 2025 and 2030

3. Market Landscape

3.1 Market ecosystem

Chart on Parent Market
Data Table on - Parent Market

3.2 Market characteristics

Chart on Market characteristics analysis

3.3 Value chain analysis

Chart on Value chain analysis

4. Market Sizing

4.1 Market definition

Data Table on Offerings of companies included in the market definition

4.2 Market segment analysis

Market segments

4.3 Market size 2025

4.4 Market outlook: Forecast for 2025-2030

Chart on Global - Market size and forecast 2025-2030 ($ million)
Data Table on Global - Market size and forecast 2025-2030 ($ million)
Chart on Global Market: Year-over-year growth 2025-2030 (%)
Data Table on Global Market: Year-over-year growth 2025-2030 (%)

5. Historic Market Size

5.1 Global Galvanized Steel Market 2020 - 2024

Historic Market Size - Data Table on Global Galvanized Steel Market 2020 - 2024 ($ million)

5.2 Type segment analysis 2020 - 2024

Historic Market Size - Type Segment 2020 - 2024 ($ million)

5.3 Product segment analysis 2020 - 2024

Historic Market Size - Product Segment 2020 - 2024 ($ million)

5.4 End-user segment analysis 2020 - 2024

Historic Market Size - End-user Segment 2020 - 2024 ($ million)

5.5 Geography segment analysis 2020 - 2024

Historic Market Size - Geography Segment 2020 - 2024 ($ million)

5.6 Country segment analysis 2020 - 2024

Historic Market Size - Country Segment 2020 - 2024 ($ million)

6. Qualitative Analysis

6.1 Impact of AI on Global Galvanized Steel Market

6.2 Impact of geopolitical conflicts on Global Galvanized Steel Market

7. Five Forces Analysis

7.1 Five forces summary

Five forces analysis - Comparison between 2025 and 2030

7.2 Bargaining power of buyers

Bargaining power of buyers - Impact of key factors 2025 and 2030

7.3 Bargaining power of suppliers

Bargaining power of suppliers - Impact of key factors in 2025 and 2030

7.4 Threat of new entrants

Threat of new entrants - Impact of key factors in 2025 and 2030

7.5 Threat of substitutes

Threat of substitutes - Impact of key factors in 2025 and 2030

7.6 Threat of rivalry

Threat of rivalry - Impact of key factors in 2025 and 2030

7.7 Market condition

Chart on Market condition - Five forces 2025 and 2030

8. Market Segmentation by Type

8.1 Market segments

Chart on Type - Market share 2025-2030 (%)
Data Table on Type - Market share 2025-2030 (%)

8.2 Comparison by Type

Chart on Comparison by Type
Data Table on Comparison by Type

8.3 Hot-dip galvanized steel - Market size and forecast 2025-2030

Chart on Hot-dip galvanized steel - Market size and forecast 2025-2030 ($ million)
Data Table on Hot-dip galvanized steel - Market size and forecast 2025-2030 ($ million)
Chart on Hot-dip galvanized steel - Year-over-year growth 2025-2030 (%)
Data Table on Hot-dip galvanized steel - Year-over-year growth 2025-2030 (%)

8.4 Electrical galvanized steel - Market size and forecast 2025-2030

Chart on Electrical galvanized steel - Market size and forecast 2025-2030 ($ million)
Data Table on Electrical galvanized steel - Market size and forecast 2025-2030 ($ million)
Chart on Electrical galvanized steel - Year-over-year growth 2025-2030 (%)
Data Table on Electrical galvanized steel - Year-over-year growth 2025-2030 (%)

8.5 Market opportunity by Type

Market opportunity by Type ($ million)
Data Table on Market opportunity by Type ($ million)

9. Market Segmentation by Product

9.1 Market segments

Chart on Product - Market share 2025-2030 (%)
Data Table on Product - Market share 2025-2030 (%)

9.2 Comparison by Product

Chart on Comparison by Product
Data Table on Comparison by Product

9.3 Sheets and strips - Market size and forecast 2025-2030

Chart on Sheets and strips - Market size and forecast 2025-2030 ($ million)
Data Table on Sheets and strips - Market size and forecast 2025-2030 ($ million)
Chart on Sheets and strips - Year-over-year growth 2025-2030 (%)
Data Table on Sheets and strips - Year-over-year growth 2025-2030 (%)

9.4 Structures - Market size and forecast 2025-2030

Chart on Structures - Market size and forecast 2025-2030 ($ million)
Data Table on Structures - Market size and forecast 2025-2030 ($ million)
Chart on Structures - Year-over-year growth 2025-2030 (%)
Data Table on Structures - Year-over-year growth 2025-2030 (%)

9.5 Pipes and tubes - Market size and forecast 2025-2030

Chart on Pipes and tubes - Market size and forecast 2025-2030 ($ million)
Data Table on Pipes and tubes - Market size and forecast 2025-2030 ($ million)
Chart on Pipes and tubes - Year-over-year growth 2025-2030 (%)
Data Table on Pipes and tubes - Year-over-year growth 2025-2030 (%)

9.6 Others - Market size and forecast 2025-2030

Chart on Others - Market size and forecast 2025-2030 ($ million)
Data Table on Others - Market size and forecast 2025-2030 ($ million)
Chart on Others - Year-over-year growth 2025-2030 (%)
Data Table on Others - Year-over-year growth 2025-2030 (%)

9.7 Market opportunity by Product

Market opportunity by Product ($ million)
Data Table on Market opportunity by Product ($ million)

10. Market Segmentation by End-user

10.1 Market segments

Chart on End-user - Market share 2025-2030 (%)
Data Table on End-user - Market share 2025-2030 (%)

10.2 Comparison by End-user

Chart on Comparison by End-user
Data Table on Comparison by End-user

10.3 Industrial - Market size and forecast 2025-2030

Chart on Industrial - Market size and forecast 2025-2030 ($ million)
Data Table on Industrial - Market size and forecast 2025-2030 ($ million)
Chart on Industrial - Year-over-year growth 2025-2030 (%)
Data Table on Industrial - Year-over-year growth 2025-2030 (%)

10.4 Commercial - Market size and forecast 2025-2030

Chart on Commercial - Market size and forecast 2025-2030 ($ million)
Data Table on Commercial - Market size and forecast 2025-2030 ($ million)
Chart on Commercial - Year-over-year growth 2025-2030 (%)
Data Table on Commercial - Year-over-year growth 2025-2030 (%)

10.5 Residential - Market size and forecast 2025-2030

Chart on Residential - Market size and forecast 2025-2030 ($ million)
Data Table on Residential - Market size and forecast 2025-2030 ($ million)
Chart on Residential - Year-over-year growth 2025-2030 (%)
Data Table on Residential - Year-over-year growth 2025-2030 (%)

10.6 Market opportunity by End-user

Market opportunity by End-user ($ million)
Data Table on Market opportunity by End-user ($ million)

11. Customer Landscape

11.1 Customer landscape overview

Analysis of price sensitivity, lifecycle, customer purchase basket, adoption rates, and purchase criteria

12. Geographic Landscape

12.1 Geographic segmentation

Chart on Market share by geography 2025-2030 (%)
Data Table on Market share by geography 2025-2030 (%)

12.2 Geographic comparison

Chart on Geographic comparison
Data Table on Geographic comparison

12.3 APAC - Market size and forecast 2025-2030

Chart on APAC - Market size and forecast 2025-2030 ($ million)
Data Table on APAC - Market size and forecast 2025-2030 ($ million)
Chart on APAC - Year-over-year growth 2025-2030 (%)
Data Table on APAC - Year-over-year growth 2025-2030 (%)
Chart on Regional Comparison - APAC
Data Table on Regional Comparison - APAC

12.3.1 China - Market size and forecast 2025-2030

Chart on China - Market size and forecast 2025-2030 ($ million)
Data Table on China - Market size and forecast 2025-2030 ($ million)
Chart on China - Year-over-year growth 2025-2030 (%)
Data Table on China - Year-over-year growth 2025-2030 (%)

12.3.2 India - Market size and forecast 2025-2030

Chart on India - Market size and forecast 2025-2030 ($ million)
Data Table on India - Market size and forecast 2025-2030 ($ million)
Chart on India - Year-over-year growth 2025-2030 (%)
Data Table on India - Year-over-year growth 2025-2030 (%)

12.3.3 Japan - Market size and forecast 2025-2030

Chart on Japan - Market size and forecast 2025-2030 ($ million)
Data Table on Japan - Market size and forecast 2025-2030 ($ million)
Chart on Japan - Year-over-year growth 2025-2030 (%)
Data Table on Japan - Year-over-year growth 2025-2030 (%)

12.3.4 South Korea - Market size and forecast 2025-2030

Chart on South Korea - Market size and forecast 2025-2030 ($ million)
Data Table on South Korea - Market size and forecast 2025-2030 ($ million)
Chart on South Korea - Year-over-year growth 2025-2030 (%)
Data Table on South Korea - Year-over-year growth 2025-2030 (%)

12.3.5 Indonesia - Market size and forecast 2025-2030

Chart on Indonesia - Market size and forecast 2025-2030 ($ million)
Data Table on Indonesia - Market size and forecast 2025-2030 ($ million)
Chart on Indonesia - Year-over-year growth 2025-2030 (%)
Data Table on Indonesia - Year-over-year growth 2025-2030 (%)

12.3.6 Australia - Market size and forecast 2025-2030

Chart on Australia - Market size and forecast 2025-2030 ($ million)
Data Table on Australia - Market size and forecast 2025-2030 ($ million)
Chart on Australia - Year-over-year growth 2025-2030 (%)
Data Table on Australia - Year-over-year growth 2025-2030 (%)

12.4 Europe - Market size and forecast 2025-2030

Chart on Europe - Market size and forecast 2025-2030 ($ million)
Data Table on Europe - Market size and forecast 2025-2030 ($ million)
Chart on Europe - Year-over-year growth 2025-2030 (%)
Data Table on Europe - Year-over-year growth 2025-2030 (%)
Chart on Regional Comparison - Europe
Data Table on Regional Comparison - Europe

12.4.1 Germany - Market size and forecast 2025-2030

Chart on Germany - Market size and forecast 2025-2030 ($ million)
Data Table on Germany - Market size and forecast 2025-2030 ($ million)
Chart on Germany - Year-over-year growth 2025-2030 (%)
Data Table on Germany - Year-over-year growth 2025-2030 (%)

12.4.2 UK - Market size and forecast 2025-2030

Chart on UK - Market size and forecast 2025-2030 ($ million)
Data Table on UK - Market size and forecast 2025-2030 ($ million)
Chart on UK - Year-over-year growth 2025-2030 (%)
Data Table on UK - Year-over-year growth 2025-2030 (%)

12.4.3 France - Market size and forecast 2025-2030

Chart on France - Market size and forecast 2025-2030 ($ million)
Data Table on France - Market size and forecast 2025-2030 ($ million)
Chart on France - Year-over-year growth 2025-2030 (%)
Data Table on France - Year-over-year growth 2025-2030 (%)

12.4.4 Italy - Market size and forecast 2025-2030

Chart on Italy - Market size and forecast 2025-2030 ($ million)
Data Table on Italy - Market size and forecast 2025-2030 ($ million)
Chart on Italy - Year-over-year growth 2025-2030 (%)
Data Table on Italy - Year-over-year growth 2025-2030 (%)

12.4.5 Spain - Market size and forecast 2025-2030

Chart on Spain - Market size and forecast 2025-2030 ($ million)
Data Table on Spain - Market size and forecast 2025-2030 ($ million)
Chart on Spain - Year-over-year growth 2025-2030 (%)
Data Table on Spain - Year-over-year growth 2025-2030 (%)

12.4.6 The Netherlands - Market size and forecast 2025-2030

Chart on The Netherlands - Market size and forecast 2025-2030 ($ million)
Data Table on The Netherlands - Market size and forecast 2025-2030 ($ million)
Chart on The Netherlands - Year-over-year growth 2025-2030 (%)
Data Table on The Netherlands - Year-over-year growth 2025-2030 (%)

12.5 North America - Market size and forecast 2025-2030

Chart on North America - Market size and forecast 2025-2030 ($ million)
Data Table on North America - Market size and forecast 2025-2030 ($ million)
Chart on North America - Year-over-year growth 2025-2030 (%)
Data Table on North America - Year-over-year growth 2025-2030 (%)
Chart on Regional Comparison - North America
Data Table on Regional Comparison - North America

12.5.1 US - Market size and forecast 2025-2030

Chart on US - Market size and forecast 2025-2030 ($ million)
Data Table on US - Market size and forecast 2025-2030 ($ million)
Chart on US - Year-over-year growth 2025-2030 (%)
Data Table on US - Year-over-year growth 2025-2030 (%)

12.5.2 Canada - Market size and forecast 2025-2030

Chart on Canada - Market size and forecast 2025-2030 ($ million)
Data Table on Canada - Market size and forecast 2025-2030 ($ million)
Chart on Canada - Year-over-year growth 2025-2030 (%)
Data Table on Canada - Year-over-year growth 2025-2030 (%)

12.5.3 Mexico - Market size and forecast 2025-2030

Chart on Mexico - Market size and forecast 2025-2030 ($ million)
Data Table on Mexico - Market size and forecast 2025-2030 ($ million)
Chart on Mexico - Year-over-year growth 2025-2030 (%)
Data Table on Mexico - Year-over-year growth 2025-2030 (%)

12.6 Middle East and Africa - Market size and forecast 2025-2030

Chart on Middle East and Africa - Market size and forecast 2025-2030 ($ million)
Data Table on Middle East and Africa - Market size and forecast 2025-2030 ($ million)
Chart on Middle East and Africa - Year-over-year growth 2025-2030 (%)
Data Table on Middle East and Africa - Year-over-year growth 2025-2030 (%)
Chart on Regional Comparison - Middle East and Africa
Data Table on Regional Comparison - Middle East and Africa

12.6.1 Saudi Arabia - Market size and forecast 2025-2030

Chart on Saudi Arabia - Market size and forecast 2025-2030 ($ million)
Data Table on Saudi Arabia - Market size and forecast 2025-2030 ($ million)
Chart on Saudi Arabia - Year-over-year growth 2025-2030 (%)
Data Table on Saudi Arabia - Year-over-year growth 2025-2030 (%)

12.6.2 UAE - Market size and forecast 2025-2030

Chart on UAE - Market size and forecast 2025-2030 ($ million)
Data Table on UAE - Market size and forecast 2025-2030 ($ million)
Chart on UAE - Year-over-year growth 2025-2030 (%)
Data Table on UAE - Year-over-year growth 2025-2030 (%)

12.6.3 Turkey - Market size and forecast 2025-2030

Chart on Turkey - Market size and forecast 2025-2030 ($ million)
Data Table on Turkey - Market size and forecast 2025-2030 ($ million)
Chart on Turkey - Year-over-year growth 2025-2030 (%)
Data Table on Turkey - Year-over-year growth 2025-2030 (%)

12.6.4 South Africa - Market size and forecast 2025-2030

Chart on South Africa - Market size and forecast 2025-2030 ($ million)
Data Table on South Africa - Market size and forecast 2025-2030 ($ million)
Chart on South Africa - Year-over-year growth 2025-2030 (%)
Data Table on South Africa - Year-over-year growth 2025-2030 (%)

12.6.5 Israel - Market size and forecast 2025-2030

Chart on Israel - Market size and forecast 2025-2030 ($ million)
Data Table on Israel - Market size and forecast 2025-2030 ($ million)
Chart on Israel - Year-over-year growth 2025-2030 (%)
Data Table on Israel - Year-over-year growth 2025-2030 (%)

12.7 South America - Market size and forecast 2025-2030

Chart on South America - Market size and forecast 2025-2030 ($ million)
Data Table on South America - Market size and forecast 2025-2030 ($ million)
Chart on South America - Year-over-year growth 2025-2030 (%)
Data Table on South America - Year-over-year growth 2025-2030 (%)
Chart on Regional Comparison - South America
Data Table on Regional Comparison - South America

12.7.1 Brazil - Market size and forecast 2025-2030

Chart on Brazil - Market size and forecast 2025-2030 ($ million)
Data Table on Brazil - Market size and forecast 2025-2030 ($ million)
Chart on Brazil - Year-over-year growth 2025-2030 (%)
Data Table on Brazil - Year-over-year growth 2025-2030 (%)

12.7.2 Argentina - Market size and forecast 2025-2030

Chart on Argentina - Market size and forecast 2025-2030 ($ million)
Data Table on Argentina - Market size and forecast 2025-2030 ($ million)
Chart on Argentina - Year-over-year growth 2025-2030 (%)
Data Table on Argentina - Year-over-year growth 2025-2030 (%)

12.7.3 Chile - Market size and forecast 2025-2030

Chart on Chile - Market size and forecast 2025-2030 ($ million)
Data Table on Chile - Market size and forecast 2025-2030 ($ million)
Chart on Chile - Year-over-year growth 2025-2030 (%)
Data Table on Chile - Year-over-year growth 2025-2030 (%)

12.8 Market opportunity by geography

Market opportunity by geography ($ million)
Data Tables on Market opportunity by geography ($ million)

13. Drivers, Challenges, and Opportunity

13.1 Market drivers

Global modernization of civil infrastructure assets
Automotive lightweighting and fleet electrification mandates
Renewable energy utility scale infrastructure growth

13.2 Market challenges

Escalating decarbonization mandates and capital modernization strains
Escalating protectionist tariffs and cross border fragmentation
Upstream feedstock volatility and metallurgical supply fragilities

13.3 Impact of drivers and challenges

Impact of drivers and challenges in 2025 and 2030

13.4 Market opportunities

Accelerated deployment of advanced zinc alloy coatings
Autonomous process telemetry and furnace electrification systems
Prefabricated modular construction drives cold formed steels

14. Competitive Landscape

14.1 Overview

14.2

Overview on criticality of inputs and factors of differentiation

14.3 Landscape disruption

Overview on factors of disruption

14.4 Industry risks

Impact of key risks on business

15. Competitive Analysis

15.1 Companies profiled

Companies covered

15.2 Company ranking index

15.3 Market positioning of companies

Matrix on companies position and classification

15.4 ArcelorMittal

ArcelorMittal - Overview
ArcelorMittal - Business segments
ArcelorMittal - Key offerings
ArcelorMittal - Segment focus
SWOT

15.5 BlueScope Steel Ltd.

BlueScope Steel Ltd. - Overview
BlueScope Steel Ltd. - Product / Service
BlueScope Steel Ltd. - Key offerings
SWOT

15.6 China Steel Corp.

China Steel Corp. - Overview
China Steel Corp. - Business segments
China Steel Corp. - Key offerings
China Steel Corp. - Segment focus
SWOT

15.7 Cleveland Cliffs Inc.

Cleveland Cliffs Inc. - Overview
Cleveland Cliffs Inc. - Product / Service
Cleveland Cliffs Inc. - Key offerings
SWOT

15.8 Hyundai Steel Co.

Hyundai Steel Co. - Overview
Hyundai Steel Co. - Product / Service
Hyundai Steel Co. - Key offerings
SWOT

15.9 JSW Steel Ltd.

JSW Steel Ltd. - Overview
JSW Steel Ltd. - Product / Service
JSW Steel Ltd. - Key offerings
SWOT

15.10 Nippon Steel Corp.

Nippon Steel Corp. - Overview
Nippon Steel Corp. - Business segments
Nippon Steel Corp. - Key offerings
Nippon Steel Corp. - Segment focus
SWOT

15.11 Nucor Corp.

Nucor Corp. - Overview
Nucor Corp. - Business segments
Nucor Corp. - Key news
Nucor Corp. - Key offerings
Nucor Corp. - Segment focus
SWOT

15.12 PAO Severstal

PAO Severstal - Overview
PAO Severstal - Business segments
PAO Severstal - Key offerings
PAO Severstal - Segment focus
SWOT

15.13 POSCO Holdings Inc.

POSCO Holdings Inc. - Overview
POSCO Holdings Inc. - Business segments
POSCO Holdings Inc. - Key offerings
POSCO Holdings Inc. - Segment focus
SWOT

15.14 Salzgitter AG

Salzgitter AG - Overview
Salzgitter AG - Business segments
Salzgitter AG - Key offerings
Salzgitter AG - Segment focus
SWOT

15.15 Steel Dynamics Inc.

Steel Dynamics Inc. - Overview
Steel Dynamics Inc. - Product / Service
Steel Dynamics Inc. - Key offerings
SWOT

15.16 Tata Steel Ltd.

Tata Steel Ltd. - Overview
Tata Steel Ltd. - Business segments
Tata Steel Ltd. - Key offerings
Tata Steel Ltd. - Segment focus
SWOT

15.17 United States Steel Corp.

United States Steel Corp. - Overview
United States Steel Corp. - Business segments
United States Steel Corp. - Key offerings
United States Steel Corp. - Segment focus
SWOT

15.18 voestalpine AG

voestalpine AG - Overview
voestalpine AG - Business segments
voestalpine AG - Key offerings
voestalpine AG - Segment focus
SWOT

16. Appendix

16.1 Scope of the report

Market definition
Objectives
Notes and caveats

16.2 Inclusions and exclusions checklist

Inclusions checklist
Exclusions checklist

16.3 Currency conversion rates for US$

16.4 Research methodology

16.5 Data procurement

Information sources

16.6 Data validation

16.7 Validation techniques employed for market sizing

16.8 Data synthesis

16.9 360 degree market analysis

16.10 List of abbreviations

Research Methodology

Technavio presents a detailed picture of the market by way of study, synthesis, and summation of data from multiple sources. The analysts have presented the various facets of the market with a particular focus on identifying the key industry influencers. The data thus presented is comprehensive, reliable, and the result of extensive research, both primary and secondary.

INFORMATION SOURCES

Primary sources

  • Manufacturers and suppliers
  • Channel partners
  • Industry experts
  • Strategic decision makers

Secondary sources

  • Industry journals and periodicals
  • Government data
  • Financial reports of key industry players
  • Historical data
  • Press releases

DATA ANALYSIS

Data Synthesis

  • Collation of data
  • Estimation of key figures
  • Analysis of derived insights

Data Validation

  • Triangulation with data models
  • Reference against proprietary databases
  • Corroboration with industry experts

REPORT WRITING

Qualitative

  • Market drivers
  • Market challenges
  • Market trends
  • Five forces analysis

Quantitative

  • Market size and forecast
  • Market segmentation
  • Geographical insights
  • Competitive landscape

Interested in this report?

Get your sample now to see our research methodology and insights!

Download Now

Frequently Asked Questions

Galvanized Steel market growth will increase by USD 56008.7 million during 2026-2030.

The Galvanized Steel market is expected to grow at a CAGR of 5.3% during 2026-2030.

Galvanized Steel market is segmented by Type (Hot-dip galvanized steel, Electrical galvanized steel) Product (Sheets and strips, Structures, Pipes and tubes, Others) End-user (Industrial, Commercial, Residential)

ArcelorMittal, BlueScope Steel Ltd., China Steel Corp., Cleveland Cliffs Inc., Hoa Phat Group Joint Stock Co, Hyundai Steel Co., JFE Steel Corp., JSW Steel Ltd., LIBERTY Steel Group, Nippon Steel Corp., Nucor Corp., PAO Severstal, POSCO Holdings Inc., Salzgitter AG, Steel Dynamics Inc., Tata Steel Ltd., thyssenkrupp Steel Europe AG, United States Steel Corp., voestalpine AG are a few of the key vendors in the Galvanized Steel market.

APAC will register the highest growth rate of 74.7% among the other regions. Therefore, the Galvanized Steel market in APAC is expected to garner significant business opportunities for the vendors during the forecast period.

China, India, Japan, South Korea, Indonesia, Australia, Germany, UK, France, Italy, Spain, The Netherlands, US, Canada, Mexico, Saudi Arabia, UAE, Turkey, South Africa, Israel, Brazil, Argentina, Chile

  • Global modernization of civil infrastructure assets is the driving factor this market.

The Galvanized Steel market vendors should focus on grabbing business opportunities from the Type segment as it accounted for the largest market share in the base year.
RIA - Research AI Assistant
Ask RIA
