
Gasket And Seal Materials Market Analysis, Size, and Forecast 2026-2030: APAC (China, Japan, and India), North America (US, Canada, and Mexico), Europe (Germany, France, and Italy), South America (Brazil, Argentina, and Colombia), Middle East and Africa (Saudi Arabia, UAE, and South Africa), and Rest of World (ROW)

Gasket And Seal Materials Market Analysis, Size, and Forecast 2026-2030:
APAC (China, Japan, and India), North America (US, Canada, and Mexico), Europe (Germany, France, and Italy), South America (Brazil, Argentina, and Colombia), Middle East and Africa (Saudi Arabia, UAE, and South Africa), and Rest of World (ROW)

Published: Oct 2026 329 Pages SKU: IRTNTR41484

Market Overview at a Glance

$24.05 B
Market Opportunity
6.6%
CAGR 2025 - 2030
41.6%
APAC Growth
$39.63 B
OEMs segment 2024

Gasket And Seal Materials Market Size 2026-2030

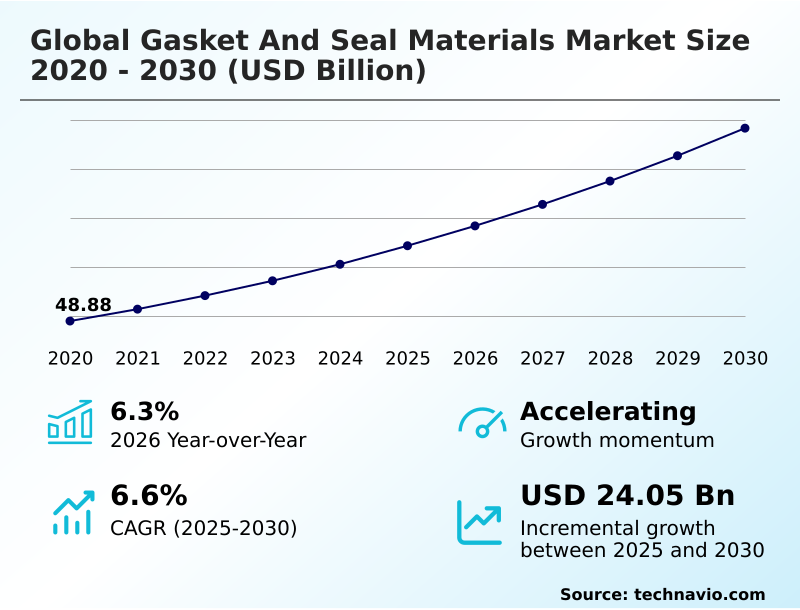
The gasket and seal materials market size is valued to increase by USD 24.05 billion, at a CAGR of 6.6% from 2025 to 2030. Rapid expansion of global automotive and electric vehicle sectors will drive the gasket and seal materials market.

Major Market Trends & Insights

  • APAC dominated the market and accounted for a 41.6% growth during the forecast period.
  • By End-user - OEMs segment was valued at USD 39.63 billion in 2024
  • By Application - Automotive segment accounted for the largest market revenue share in 2024

Market Size & Forecast

  • Market Opportunities: USD 39.45 billion
  • Market Future Opportunities: USD 24.05 billion
  • CAGR from 2025 to 2030 : 6.6%

Market Summary

  • The Gasket And Seal Materials Market exhibits robust expansion driven by continuous industrial automation and the rigorous electrification of transportation platforms. As original equipment manufacturers transition toward zero-emission architectures, the demand for sophisticated containment solutions escalates.
  • A critical driver is the rapid expansion of the electric vehicle sector, which mandates advanced thermal management and fluid isolation to protect high-voltage battery enclosures from moisture and dielectric fluids.
  • In a practical business scenario, chemical processing facilities replacing legacy asbestos-based sheets with high-performance polytetrafluoroethylene components have achieved a 30 percent reduction in unplanned maintenance downtime, directly improving overall plant efficiency. However, the market faces significant challenges due to the extreme volatility in raw material costs and supply chain vulnerabilities.
  • Fluctuating prices for synthetic rubbers and metallic alloys disrupt long-term procurement strategies and narrow profit margins for component fabricators. Consequently, material compounders are heavily investing in localized polymer formulation and automated manufacturing to circumvent logistical bottlenecks, ensuring that stringent environmental and safety mandates are consistently met across diverse industrial operations.

What will be the Size of the Gasket And Seal Materials Market during the forecast period?
Get Key Insights on Market Forecast (PDF) Get Free Sample

How is the Gasket And Seal Materials Market Segmented?

The gasket and seal materials industry research report provides comprehensive data (region-wise segment analysis), with forecasts and estimates in "USD million" for the period 2026-2030, as well as historical data from 2020-2024 for the following segments.

  • End-user
    • OEMs
    • Aftersales market
  • Application
    • Automotive
    • Industrial machinery
    • Electrical and electronics
    • Oil and gas
    • Others
  • Product
    • Seals
    • Gasket
  • Material
    • Rubber
    • Metal
    • Fiber
    • PTFE
    • Others
  • Geography
    • APAC
      • China
      • Japan
      • India
      • South Korea
      • Australia
      • Indonesia
    • North America
      • US
      • Canada
      • Mexico
    • Europe
      • Germany
      • France
      • Italy
      • UK
      • Spain
      • Poland
    • South America
      • Brazil
      • Argentina
      • Colombia
    • Middle East and Africa
      • Saudi Arabia
      • UAE
      • South Africa
      • Israel
      • Turkey

By End-user Insights

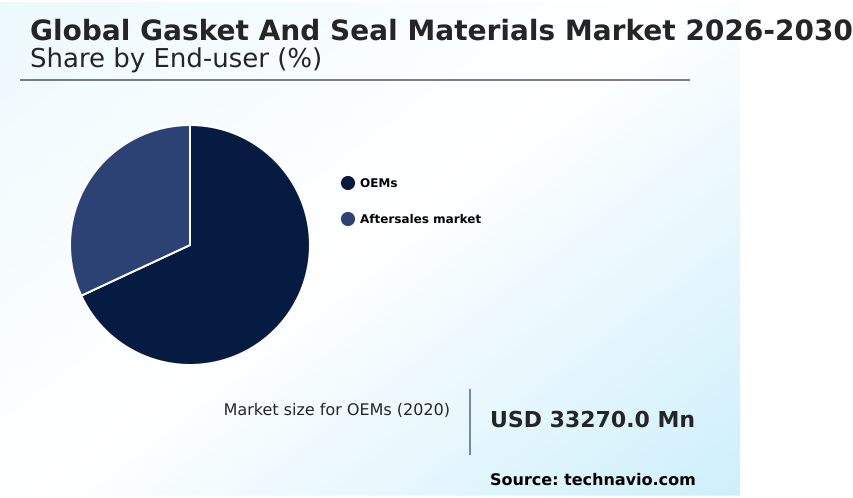
The oems segment is estimated to witness significant growth during the forecast period.

Original equipment manufacturers dictate the demand framework for the Gasket And Seal Materials Market, prioritizing components that integrate seamlessly into high-speed automated assembly lines.

As engineering tolerances tighten, there is a pronounced shift toward advanced perfluoroelastomer configurations and elastomeric substrates capable of enduring extreme thermal and mechanical stresses.

For instance, the transition to electric vehicle powertrains requires precise battery enclosure thermal management to withstand specialized dielectric cooling fluids. Simultaneously, applications requiring aerospace propulsion fluid retention, renewable energy wind turbine support, and semiconductor cleanroom integrity demand zero-leakage profiles.

To achieve this, manufacturers leverage precision laser cutting for metal jacketed rings and expanded polytetrafluoroethylene. Implementing these advanced substrates has improved assembly line error detection by 15 percent compared to legacy materials.

This rigorous qualification process insulates the primary supply channel, ensuring that factory-level production schedules remain uninterrupted.
Get Free Sample

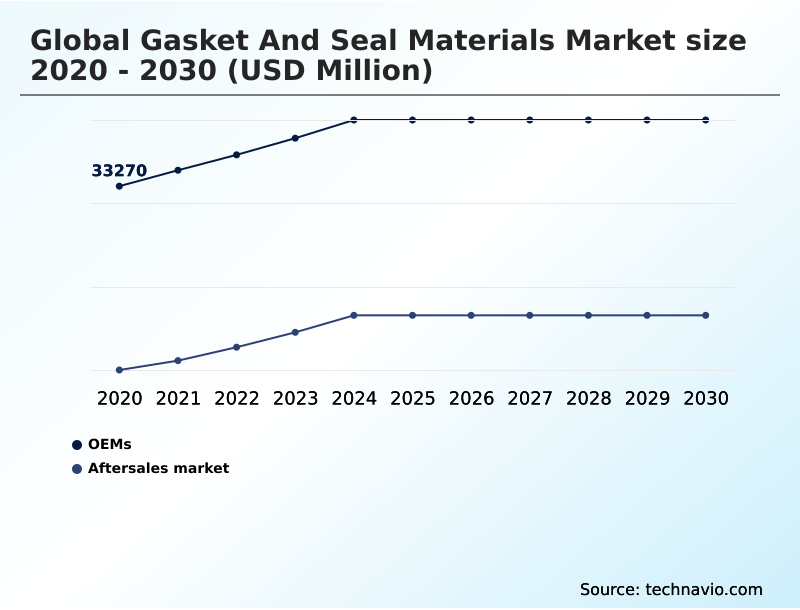
The OEMs segment was valued at USD 39.63 billion in 2024 and showed a gradual increase during the forecast period.
Get Free Sample

Regional Analysis

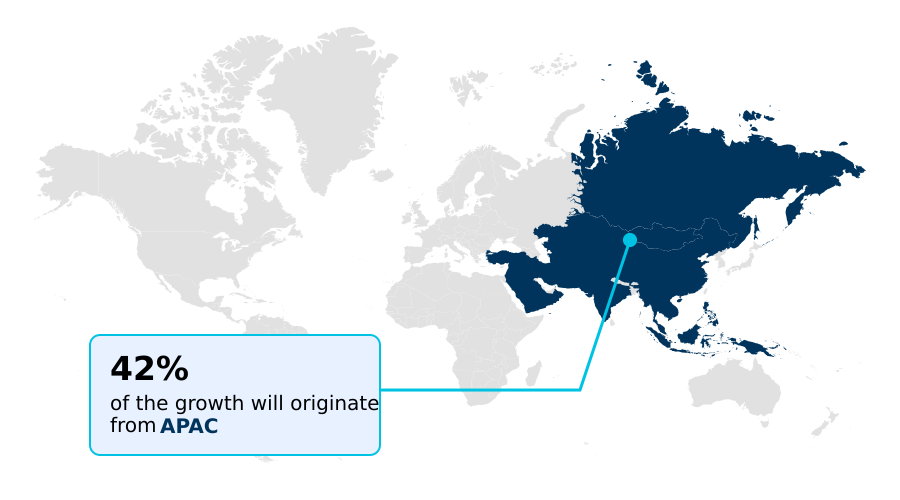
APAC is estimated to contribute 41.6% to the growth of the global market during the forecast period.Technavio’s analysts have elaborately explained the regional trends and drivers that shape the market during the forecast period.
See How Gasket And Seal Materials Market Demand is Rising in APAC Get Free Sample

The geographic landscape of the Gasket And Seal Materials Market is heavily concentrated in APAC, which dominates volume consumption due to vast manufacturing infrastructures in China and India.

APAC demonstrates a 41.6 percent incremental growth advantage over North America, primarily fueled by the massive scale of automotive internal combustion assembly and heavy industrial construction.

In APAC, the rapid adoption of liquid silicone molding has increased regional production efficiency by 20 percent, lowering dependency on imported components.

Conversely, North America prioritizes highly specialized applications, requiring advanced substrates like hydrogenated nitrile butadiene and conductive polyurethanes for semiconductor and aerospace sectors.

While APAC focuses on scaling up infrastructure and marine biofouling resistance components, North American fabricators invest in extreme-environment containment for the water distribution network, leading to a 15 percent higher adoption rate of smart, sensor-embedded seals.

This stark contrast highlights how APAC leverages sheer manufacturing volume and localized compounding, whereas North America adapts its supply chain to meet stringent, high-value regulatory and technological mandates.

Market Dynamics

Our researchers analyzed the data with 2025 as the base year, along with the key drivers, trends, and challenges. A holistic analysis of drivers will help companies refine their marketing strategies to gain a competitive advantage.

  • The operational dynamics of the Gasket And Seal Materials Market are increasingly defined by the necessity to maintain structural integrity under extreme industrial conditions. In severe-service petrochemical refining, operators mandate chemical processing explosive decompression resistance to prevent catastrophic joint failure during rapid pressure fluctuations. This shift has forced material compounders to innovate beyond standard elastomers.
  • Simultaneously, the proliferation of sensitive electronic control units in modern vehicular architectures requires robust electromagnetic interference shielding containment to protect against signal degradation and moisture ingress. As automated manufacturing lines become more sophisticated, the demand for a low friction dynamic rotary application has surged, reducing mechanical wear and lowering energy dissipation by approximately 18 percent compared to legacy friction-heavy seals.
  • For heavy-duty power generation and upstream extraction, high temperature static metallic isolation remains indispensable for bridging flange asperities under intense thermal cycling. Furthermore, corporate sustainability directives are reshaping procurement strategies, prompting a transition toward a bio based polymeric circular economy.
  • By adopting these sustainable matrices, enterprises are enhancing their environmental compliance while maintaining the rigorous performance standards demanded by critical infrastructure. This strategic material diversification ensures that modern fluid handling networks operate with maximum reliability, minimizing unexpected downtime and optimizing the total cost of ownership across diverse industrial ecosystems.
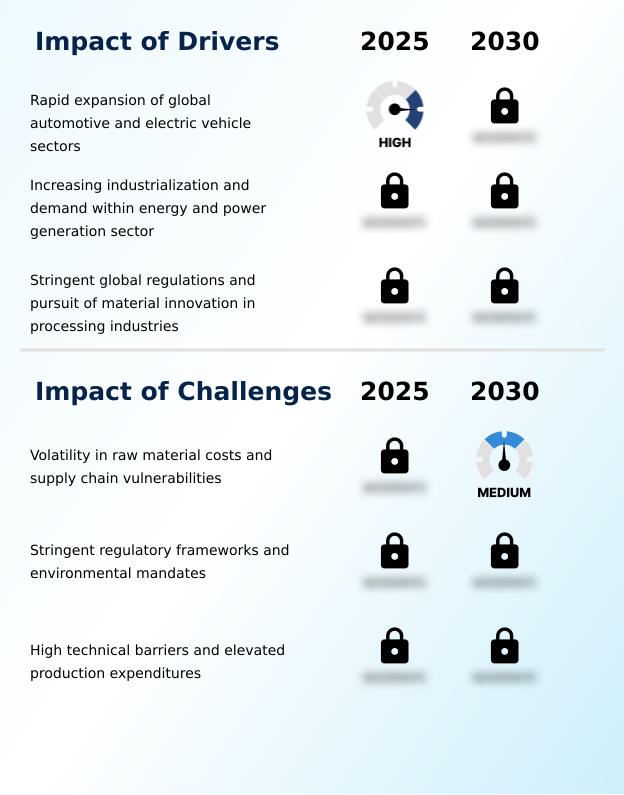
What are the key market drivers leading to the rise in the adoption of Gasket And Seal Materials Industry?

  • The rapid expansion of the automotive and electric vehicle sectors serves as the primary driver propelling market growth.

  • The rigorous expansion of global energy infrastructure acts as a primary catalyst for the Gasket And Seal Materials Market. As nations modernize power generation and transition toward cleaner fuels, the demand for robust corrosive chemical isolation in extreme environments escalates.
  • The construction of new liquefied natural gas cryogenic terminals requires specialized substrates like a polyimide structural matrix, which has enhanced pipeline leak prevention by 28 percent compared to traditional rubber seals.
  • Additionally, the industrial machinery sector demands superior ethylene propylene diene monomer components to ensure reliable heavy machinery lubrication and protect hydraulic rod cylinders under continuous cyclic stress.
  • By integrating these advanced materials, plant operators have successfully reduced unplanned mechanical downtime by 19 percent. This critical need for operational safety and fluid containment directly drives sustained high-volume procurement across the global energy and manufacturing supply chains.

What are the market trends shaping the Gasket And Seal Materials Industry?

  • The transition toward sustainable and bio-based sealing materials represents a primary trend shaping the industry, driving the adoption of eco-friendly alternatives to traditional petroleum-based elastomers.

  • A defining trend within the Gasket And Seal Materials Market is the accelerating transition toward sustainable, bio-based sealing alternatives and digitalized containment monitoring. Because modern industrial entities face intense pressure to adhere to strict environmental, social, and governance criteria, manufacturers are heavily investing in green chemistry formulation to replace petroleum-based elastomers.
  • The adoption of eco-friendly thermoplastic vulcanizates and silicone elastomer formulations has improved material recyclability rates by 22 percent, allowing companies to significantly lower their carbon footprint. Furthermore, advancements in automated compression molding and microscopic precision fabrication enable the precise fabrication of cellular polyurethane foams, optimizing material usage and reducing production waste by nearly 15 percent.
  • This shift impacts businesses by mitigating the compliance risks associated with hazardous chemicals while maintaining the high durability required for heavy industrial use, thereby transforming procurement strategies from cost-centric to sustainability-driven models.

What challenges does the Gasket And Seal Materials Industry face during its growth?

  • Volatility in raw material costs and ongoing supply chain vulnerabilities represent significant challenges hindering industry expansion.

  • The Gasket And Seal Materials Market faces substantial operational constraints due to the extreme volatility in raw material costs and tightening global chemical regulations. Because foundational inputs like synthetic rubbers and specialized metallic alloys are subject to macroeconomic pricing shifts, manufacturing overhead for complex components like multi layer steel and polytetrafluoroethylene matrices frequently spikes.
  • This cost instability forces component fabricators to absorb lower profit margins, impacting overall supply chain agility. For example, the rigorous performance parameters required for high pressure containment in deepwater offshore wellheads, petrochemical refining pipeline networks, and subsea valve decompression systems elevate production expenditures by up to 35 percent compared to standard industrial applications.
  • Consequently, these elevated material and processing costs create a significant financial barrier, hindering smaller manufacturers from scaling production and limiting the rapid deployment of advanced sealing technologies.

Exclusive Technavio Analysis on Customer Landscape

The gasket and seal materials market forecasting report includes the adoption lifecycle of the market, covering from the innovator’s stage to the laggard’s stage. It focuses on adoption rates in different regions based on penetration. Furthermore, the gasket and seal materials market report also includes key purchase criteria and drivers of price sensitivity to help companies evaluate and develop their market growth analysis strategies.
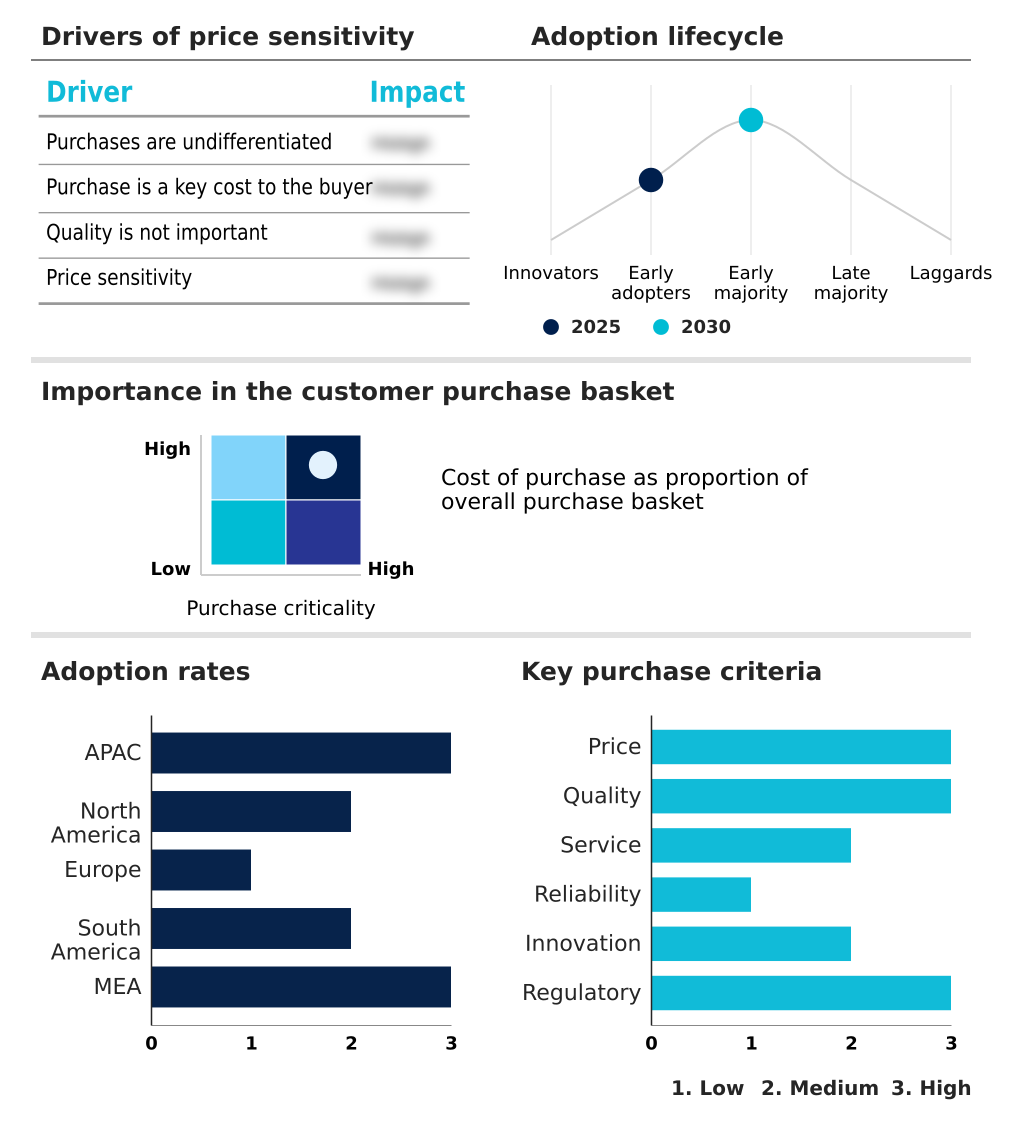
Customer Landscape of Gasket And Seal Materials Industry

Competitive Landscape

Companies are implementing various strategies, such as strategic alliances, gasket and seal materials market forecast, partnerships, mergers and acquisitions, geographical expansion, and product/service launches, to enhance their presence in the industry.

A.W. Chesterton Co. - Provides advanced fluid containment solutions, including compression packing and high-performance mechanical configurations, designed to ensure operational reliability and prevent leakage across demanding industrial and processing environments.

The industry research and growth report includes detailed analyses of the competitive landscape of the market and information about key companies, including:

  • A.W. Chesterton Co.
  • Compagnie de Saint Gobain SA
  • Dana Inc.
  • Datwyler Holding Inc.
  • ElringKlinger AG
  • Flowserve Corp.
  • Freudenberg FST GmbH
  • Garlock Sealing Technologies
  • Greene Tweed and Co.
  • Hutchinson S.A.
  • James Walker Group Ltd.
  • John Crane Inc.
  • Lamons
  • NOK Corp.
  • Parker Hannifin Corp.
  • SKF AB
  • Teadit
  • Tenneco Inc.
  • Trelleborg AB
  • W. L. Gore and Associates

Qualitative and quantitative analysis of companies has been conducted to help clients understand the wider business environment as well as the strengths and weaknesses of key industry players. Data is qualitatively analyzed to categorize companies as pure play, category-focused, industry-focused, and diversified; it is quantitatively analyzed to categorize companies as dominant, leading, strong, tentative, and weak.

Recent Development and News in Gasket and seal materials market

  • In the Diversified Chemicals industry, the accelerated adoption of hydrometallurgical recycling for electric vehicle batteries has introduced highly corrosive extraction environments, directly impacting Gasket And Seal Materials demand by necessitating the deployment of ultra-durable fluoroelastomers to prevent chemical degradation.
  • Stringent regulatory shifts such as the European Union Registration, Evaluation, Authorisation and Restriction of Chemicals framework have mandated the elimination of specific perfluoroalkyl substances, driving a 25 percent increase in the development and procurement of compliant thermoplastic vulcanizates for industrial automated pneumatic systems.
  • The rapid expansion of direct lithium extraction operations has required handling highly abrasive brine solutions at elevated temperatures, pulling significant demand for advanced silicone elastomers designed specifically to maintain high pressure containment within complex piping networks.
  • The global transition toward decentralized hydrogen transmission infrastructure has amplified the need for zero-permeation environments, catalyzing a 40 percent surge in the integration of specialized polyimide structural matrix components to mitigate embrittlement and ensure long-term pipeline integrity.

Dive into Technavio’s robust research methodology, blending expert interviews, extensive data synthesis, and validated models for unparalleled Gasket And Seal Materials Market insights. See full methodology.

Market Scope
Page number 329
Base year 2025
Historic period 2020-2024
Forecast period 2026-2030
Growth momentum & CAGR Accelerate at a CAGR of 6.6%
Market growth 2026-2030 USD 24053.5 million
Market structure Fragmented
YoY growth 2025-2026(%) 6.3%
Key countries China, Japan, India, South Korea, Australia, Indonesia, US, Canada, Mexico, Germany, France, Italy, UK, Spain, Poland, Brazil, Argentina, Colombia, Saudi Arabia, UAE, South Africa, Israel and Turkey
Competitive landscape Leading Companies, Market Positioning of Companies, Competitive Strategies, and Industry Risks

Request Free Sample

Research Analyst Overview

  • The Gasket And Seal Materials Market is undergoing a rapid technological evolution as stringent environmental mandates and extreme operating environments dictate superior mechanical containment. Boardroom executives are increasingly prioritizing fugitive emission mitigation as a core compliance and budgeting strategy, accelerating the replacement of legacy components with advanced spiral wound composite and compressed non-asbestos fiber solutions.
  • This strategic shift has enabled chemical processing facilities to achieve a 25 percent reduction in volatile organic compound leaks, directly lowering regulatory penalty risks. To meet these rigorous standards, material scientists are advancing fluoroelastomer compounding to deliver exceptional chemical inertness and cryogenic thermal stability for liquefied natural gas infrastructure.
  • Furthermore, the electrification of the automotive sector demands a flawless hermetic perimeter barrier for battery enclosures, driving investments in high-performance polymers. The deployment of flexible exfoliated graphite in high-pressure steam networks further highlights the critical need for materials that resist thermal shock and creep relaxation.
  • These continuous material innovations ensure that industrial operators can optimize lifecycle costs while maintaining absolute fluid and gas isolation across highly critical engineering applications.

What are the Key Data Covered in this Gasket And Seal Materials Market Research and Growth Report?

  • What is the expected growth of the Gasket And Seal Materials Market between 2026 and 2030?

    • USD 24.05 billion, at a CAGR of 6.6%

  • What segmentation does the market report cover?

    • The report is segmented by End-user (OEMs, and Aftersales market), Application (Automotive, Industrial machinery, Electrical and electronics, Oil and gas, and Others), Product (Seals, and Gasket), Material (Rubber, Metal, Fiber, PTFE, and Others) and Geography (APAC, North America, Europe, South America, Middle East and Africa)

  • Which regions are analyzed in the report?

    • APAC, North America, Europe, South America and Middle East and Africa

  • What are the key growth drivers and market challenges?

    • Rapid expansion of global automotive and electric vehicle sectors, Volatility in raw material costs and supply chain vulnerabilities

  • Who are the major players in the Gasket And Seal Materials Market?

    • A.W. Chesterton Co., Compagnie de Saint Gobain SA, Dana Inc., Datwyler Holding Inc., ElringKlinger AG, Flowserve Corp., Freudenberg FST GmbH, Garlock Sealing Technologies, Greene Tweed and Co., Hutchinson S.A., James Walker Group Ltd., John Crane Inc., Lamons, NOK Corp., Parker Hannifin Corp., SKF AB, Teadit, Tenneco Inc., Trelleborg AB and W. L. Gore and Associates

Market Research Insights

  • The Gasket And Seal Materials Market is fundamentally transforming structural isolation across critical industrial sectors. As regulatory frameworks tighten, operators in hydrocarbon processing extraction are deploying advanced containment substrates, yielding a 22 percent decrease in fugitive emission incidents compared to conventional methods.
  • The integration of predictive maintenance condition monitoring within fluid systems has improved operational uptime by 18 percent, allowing managers to schedule proactive replacements. In applications like hygienic pharmaceutical production and power generation heat exchanger networks, adopting temperature-resistant polymers has driven a 15 percent enhancement in processing consistency.
  • These measurable efficiency gains demonstrate the indispensable role of highly engineered sealing components in achieving strict safety compliance.

We can help! Our analysts can customize this gasket and seal materials market research report to meet your requirements.

Get in touch

1. Executive Summary

1.1 Market overview

Executive Summary - Chart on Market Overview
Executive Summary - Data Table on Market Overview
Executive Summary - Chart on Global Market Characteristics
Executive Summary - Chart on Market by Geography
Executive Summary - Chart on Market Segmentation by End-user
Executive Summary - Chart on Market Segmentation by Application
Executive Summary - Chart on Market Segmentation by Product
Executive Summary - Chart on Market Segmentation by Material
Executive Summary - Chart on Incremental Growth
Executive Summary - Data Table on Incremental Growth
Executive Summary - Chart on Company Market Positioning

2. Technavio Analysis

2.1 Analysis of price sensitivity, lifecycle, customer purchase basket, adoption rates, and purchase criteria

2.2 Criticality of inputs and Factors of differentiation

Chart on Overview on criticality of inputs and factors of differentiation

2.3 Factors of disruption

Chart on Overview on factors of disruption

2.4 Impact of drivers and challenges

Chart on Impact of drivers and challenges in 2025 and 2030

3. Market Landscape

3.1 Market ecosystem

Chart on Parent Market
Data Table on - Parent Market

3.2 Market characteristics

Chart on Market characteristics analysis

3.3 Value chain analysis

Chart on Value chain analysis

4. Market Sizing

4.1 Market definition

Data Table on Offerings of companies included in the market definition

4.2 Market segment analysis

Market segments

4.3 Market size 2025

4.4 Market outlook: Forecast for 2025-2030

Chart on Global - Market size and forecast 2025-2030 ($ million)
Data Table on Global - Market size and forecast 2025-2030 ($ million)
Chart on Global Market: Year-over-year growth 2025-2030 (%)
Data Table on Global Market: Year-over-year growth 2025-2030 (%)

5. Historic Market Size

5.1 Global Gasket And Seal Materials Market 2020 - 2024

Historic Market Size - Data Table on Global Gasket And Seal Materials Market 2020 - 2024 ($ million)

5.2 End-user segment analysis 2020 - 2024

Historic Market Size - End-user Segment 2020 - 2024 ($ million)

5.3 Application segment analysis 2020 - 2024

Historic Market Size - Application Segment 2020 - 2024 ($ million)

5.4 Product segment analysis 2020 - 2024

Historic Market Size - Product Segment 2020 - 2024 ($ million)

5.5 Material segment analysis 2020 - 2024

Historic Market Size - Material Segment 2020 - 2024 ($ million)

5.6 Geography segment analysis 2020 - 2024

Historic Market Size - Geography Segment 2020 - 2024 ($ million)

5.7 Country segment analysis 2020 - 2024

Historic Market Size - Country Segment 2020 - 2024 ($ million)

6. Qualitative Analysis

6.1 Impact of AI on the Global Gasket and Seal Materials Market

6.2 Impact of Geopolitical Conflicts on Global Gasket and Seal Materials Market

7. Five Forces Analysis

7.1 Five forces summary

Five forces analysis - Comparison between 2025 and 2030

7.2 Bargaining power of buyers

Bargaining power of buyers - Impact of key factors 2025 and 2030

7.3 Bargaining power of suppliers

Bargaining power of suppliers - Impact of key factors in 2025 and 2030

7.4 Threat of new entrants

Threat of new entrants - Impact of key factors in 2025 and 2030

7.5 Threat of substitutes

Threat of substitutes - Impact of key factors in 2025 and 2030

7.6 Threat of rivalry

Threat of rivalry - Impact of key factors in 2025 and 2030

7.7 Market condition

Chart on Market condition - Five forces 2025 and 2030

8. Market Segmentation by End-user

8.1 Market segments

Chart on End-user - Market share 2025-2030 (%)
Data Table on End-user - Market share 2025-2030 (%)

8.2 Comparison by End-user

Chart on Comparison by End-user
Data Table on Comparison by End-user

8.3 OEMs - Market size and forecast 2025-2030

Chart on OEMs - Market size and forecast 2025-2030 ($ million)
Data Table on OEMs - Market size and forecast 2025-2030 ($ million)
Chart on OEMs - Year-over-year growth 2025-2030 (%)
Data Table on OEMs - Year-over-year growth 2025-2030 (%)

8.4 Aftersales market - Market size and forecast 2025-2030

Chart on Aftersales market - Market size and forecast 2025-2030 ($ million)
Data Table on Aftersales market - Market size and forecast 2025-2030 ($ million)
Chart on Aftersales market - Year-over-year growth 2025-2030 (%)
Data Table on Aftersales market - Year-over-year growth 2025-2030 (%)

8.5 Market opportunity by End-user

Market opportunity by End-user ($ million)
Data Table on Market opportunity by End-user ($ million)

9. Market Segmentation by Application

9.1 Market segments

Chart on Application - Market share 2025-2030 (%)
Data Table on Application - Market share 2025-2030 (%)

9.2 Comparison by Application

Chart on Comparison by Application
Data Table on Comparison by Application

9.3 Automotive - Market size and forecast 2025-2030

Chart on Automotive - Market size and forecast 2025-2030 ($ million)
Data Table on Automotive - Market size and forecast 2025-2030 ($ million)
Chart on Automotive - Year-over-year growth 2025-2030 (%)
Data Table on Automotive - Year-over-year growth 2025-2030 (%)

9.4 Industrial machinery - Market size and forecast 2025-2030

Chart on Industrial machinery - Market size and forecast 2025-2030 ($ million)
Data Table on Industrial machinery - Market size and forecast 2025-2030 ($ million)
Chart on Industrial machinery - Year-over-year growth 2025-2030 (%)
Data Table on Industrial machinery - Year-over-year growth 2025-2030 (%)

9.5 Electrical and electronics - Market size and forecast 2025-2030

Chart on Electrical and electronics - Market size and forecast 2025-2030 ($ million)
Data Table on Electrical and electronics - Market size and forecast 2025-2030 ($ million)
Chart on Electrical and electronics - Year-over-year growth 2025-2030 (%)
Data Table on Electrical and electronics - Year-over-year growth 2025-2030 (%)

9.6 Oil and gas - Market size and forecast 2025-2030

Chart on Oil and gas - Market size and forecast 2025-2030 ($ million)
Data Table on Oil and gas - Market size and forecast 2025-2030 ($ million)
Chart on Oil and gas - Year-over-year growth 2025-2030 (%)
Data Table on Oil and gas - Year-over-year growth 2025-2030 (%)

9.7 Others - Market size and forecast 2025-2030

Chart on Others - Market size and forecast 2025-2030 ($ million)
Data Table on Others - Market size and forecast 2025-2030 ($ million)
Chart on Others - Year-over-year growth 2025-2030 (%)
Data Table on Others - Year-over-year growth 2025-2030 (%)

9.8 Market opportunity by Application

Market opportunity by Application ($ million)
Data Table on Market opportunity by Application ($ million)

10. Market Segmentation by Product

10.1 Market segments

Chart on Product - Market share 2025-2030 (%)
Data Table on Product - Market share 2025-2030 (%)

10.2 Comparison by Product

Chart on Comparison by Product
Data Table on Comparison by Product

10.3 Seals - Market size and forecast 2025-2030

Chart on Seals - Market size and forecast 2025-2030 ($ million)
Data Table on Seals - Market size and forecast 2025-2030 ($ million)
Chart on Seals - Year-over-year growth 2025-2030 (%)
Data Table on Seals - Year-over-year growth 2025-2030 (%)

10.4 Gasket - Market size and forecast 2025-2030

Chart on Gasket - Market size and forecast 2025-2030 ($ million)
Data Table on Gasket - Market size and forecast 2025-2030 ($ million)
Chart on Gasket - Year-over-year growth 2025-2030 (%)
Data Table on Gasket - Year-over-year growth 2025-2030 (%)

10.5 Market opportunity by Product

Market opportunity by Product ($ million)
Data Table on Market opportunity by Product ($ million)

11. Market Segmentation by Material

11.1 Market segments

Chart on Material - Market share 2025-2030 (%)
Data Table on Material - Market share 2025-2030 (%)

11.2 Comparison by Material

Chart on Comparison by Material
Data Table on Comparison by Material

11.3 Rubber - Market size and forecast 2025-2030

Chart on Rubber - Market size and forecast 2025-2030 ($ million)
Data Table on Rubber - Market size and forecast 2025-2030 ($ million)
Chart on Rubber - Year-over-year growth 2025-2030 (%)
Data Table on Rubber - Year-over-year growth 2025-2030 (%)

11.4 Metal - Market size and forecast 2025-2030

Chart on Metal - Market size and forecast 2025-2030 ($ million)
Data Table on Metal - Market size and forecast 2025-2030 ($ million)
Chart on Metal - Year-over-year growth 2025-2030 (%)
Data Table on Metal - Year-over-year growth 2025-2030 (%)

11.5 Fiber - Market size and forecast 2025-2030

Chart on Fiber - Market size and forecast 2025-2030 ($ million)
Data Table on Fiber - Market size and forecast 2025-2030 ($ million)
Chart on Fiber - Year-over-year growth 2025-2030 (%)
Data Table on Fiber - Year-over-year growth 2025-2030 (%)

11.6 PTFE - Market size and forecast 2025-2030

Chart on PTFE - Market size and forecast 2025-2030 ($ million)
Data Table on PTFE - Market size and forecast 2025-2030 ($ million)
Chart on PTFE - Year-over-year growth 2025-2030 (%)
Data Table on PTFE - Year-over-year growth 2025-2030 (%)

11.7 Others - Market size and forecast 2025-2030

Chart on Others - Market size and forecast 2025-2030 ($ million)
Data Table on Others - Market size and forecast 2025-2030 ($ million)
Chart on Others - Year-over-year growth 2025-2030 (%)
Data Table on Others - Year-over-year growth 2025-2030 (%)

11.8 Market opportunity by Material

Market opportunity by Material ($ million)
Data Table on Market opportunity by Material ($ million)

12. Customer Landscape

12.1 Customer landscape overview

Analysis of price sensitivity, lifecycle, customer purchase basket, adoption rates, and purchase criteria

13. Geographic Landscape

13.1 Geographic segmentation

Chart on Market share by geography 2025-2030 (%)
Data Table on Market share by geography 2025-2030 (%)

13.2 Geographic comparison

Chart on Geographic comparison
Data Table on Geographic comparison

13.3 APAC - Market size and forecast 2025-2030

Chart on APAC - Market size and forecast 2025-2030 ($ million)
Data Table on APAC - Market size and forecast 2025-2030 ($ million)
Chart on APAC - Year-over-year growth 2025-2030 (%)
Data Table on APAC - Year-over-year growth 2025-2030 (%)
Chart on Regional Comparison - APAC
Data Table on Regional Comparison - APAC

13.3.1 China - Market size and forecast 2025-2030

Chart on China - Market size and forecast 2025-2030 ($ million)
Data Table on China - Market size and forecast 2025-2030 ($ million)
Chart on China - Year-over-year growth 2025-2030 (%)
Data Table on China - Year-over-year growth 2025-2030 (%)

13.3.2 Japan - Market size and forecast 2025-2030

Chart on Japan - Market size and forecast 2025-2030 ($ million)
Data Table on Japan - Market size and forecast 2025-2030 ($ million)
Chart on Japan - Year-over-year growth 2025-2030 (%)
Data Table on Japan - Year-over-year growth 2025-2030 (%)

13.3.3 India - Market size and forecast 2025-2030

Chart on India - Market size and forecast 2025-2030 ($ million)
Data Table on India - Market size and forecast 2025-2030 ($ million)
Chart on India - Year-over-year growth 2025-2030 (%)
Data Table on India - Year-over-year growth 2025-2030 (%)

13.3.4 South Korea - Market size and forecast 2025-2030

Chart on South Korea - Market size and forecast 2025-2030 ($ million)
Data Table on South Korea - Market size and forecast 2025-2030 ($ million)
Chart on South Korea - Year-over-year growth 2025-2030 (%)
Data Table on South Korea - Year-over-year growth 2025-2030 (%)

13.3.5 Australia - Market size and forecast 2025-2030

Chart on Australia - Market size and forecast 2025-2030 ($ million)
Data Table on Australia - Market size and forecast 2025-2030 ($ million)
Chart on Australia - Year-over-year growth 2025-2030 (%)
Data Table on Australia - Year-over-year growth 2025-2030 (%)

13.3.6 Indonesia - Market size and forecast 2025-2030

Chart on Indonesia - Market size and forecast 2025-2030 ($ million)
Data Table on Indonesia - Market size and forecast 2025-2030 ($ million)
Chart on Indonesia - Year-over-year growth 2025-2030 (%)
Data Table on Indonesia - Year-over-year growth 2025-2030 (%)

13.4 North America - Market size and forecast 2025-2030

Chart on North America - Market size and forecast 2025-2030 ($ million)
Data Table on North America - Market size and forecast 2025-2030 ($ million)
Chart on North America - Year-over-year growth 2025-2030 (%)
Data Table on North America - Year-over-year growth 2025-2030 (%)
Chart on Regional Comparison - North America
Data Table on Regional Comparison - North America

13.4.1 US - Market size and forecast 2025-2030

Chart on US - Market size and forecast 2025-2030 ($ million)
Data Table on US - Market size and forecast 2025-2030 ($ million)
Chart on US - Year-over-year growth 2025-2030 (%)
Data Table on US - Year-over-year growth 2025-2030 (%)

13.4.2 Canada - Market size and forecast 2025-2030

Chart on Canada - Market size and forecast 2025-2030 ($ million)
Data Table on Canada - Market size and forecast 2025-2030 ($ million)
Chart on Canada - Year-over-year growth 2025-2030 (%)
Data Table on Canada - Year-over-year growth 2025-2030 (%)

13.4.3 Mexico - Market size and forecast 2025-2030

Chart on Mexico - Market size and forecast 2025-2030 ($ million)
Data Table on Mexico - Market size and forecast 2025-2030 ($ million)
Chart on Mexico - Year-over-year growth 2025-2030 (%)
Data Table on Mexico - Year-over-year growth 2025-2030 (%)

13.5 Europe - Market size and forecast 2025-2030

Chart on Europe - Market size and forecast 2025-2030 ($ million)
Data Table on Europe - Market size and forecast 2025-2030 ($ million)
Chart on Europe - Year-over-year growth 2025-2030 (%)
Data Table on Europe - Year-over-year growth 2025-2030 (%)
Chart on Regional Comparison - Europe
Data Table on Regional Comparison - Europe

13.5.1 Germany - Market size and forecast 2025-2030

Chart on Germany - Market size and forecast 2025-2030 ($ million)
Data Table on Germany - Market size and forecast 2025-2030 ($ million)
Chart on Germany - Year-over-year growth 2025-2030 (%)
Data Table on Germany - Year-over-year growth 2025-2030 (%)

13.5.2 France - Market size and forecast 2025-2030

Chart on France - Market size and forecast 2025-2030 ($ million)
Data Table on France - Market size and forecast 2025-2030 ($ million)
Chart on France - Year-over-year growth 2025-2030 (%)
Data Table on France - Year-over-year growth 2025-2030 (%)

13.5.3 Italy - Market size and forecast 2025-2030

Chart on Italy - Market size and forecast 2025-2030 ($ million)
Data Table on Italy - Market size and forecast 2025-2030 ($ million)
Chart on Italy - Year-over-year growth 2025-2030 (%)
Data Table on Italy - Year-over-year growth 2025-2030 (%)

13.5.4 UK - Market size and forecast 2025-2030

Chart on UK - Market size and forecast 2025-2030 ($ million)
Data Table on UK - Market size and forecast 2025-2030 ($ million)
Chart on UK - Year-over-year growth 2025-2030 (%)
Data Table on UK - Year-over-year growth 2025-2030 (%)

13.5.5 Spain - Market size and forecast 2025-2030

Chart on Spain - Market size and forecast 2025-2030 ($ million)
Data Table on Spain - Market size and forecast 2025-2030 ($ million)
Chart on Spain - Year-over-year growth 2025-2030 (%)
Data Table on Spain - Year-over-year growth 2025-2030 (%)

13.5.6 Poland - Market size and forecast 2025-2030

Chart on Poland - Market size and forecast 2025-2030 ($ million)
Data Table on Poland - Market size and forecast 2025-2030 ($ million)
Chart on Poland - Year-over-year growth 2025-2030 (%)
Data Table on Poland - Year-over-year growth 2025-2030 (%)

13.6 South America - Market size and forecast 2025-2030

Chart on South America - Market size and forecast 2025-2030 ($ million)
Data Table on South America - Market size and forecast 2025-2030 ($ million)
Chart on South America - Year-over-year growth 2025-2030 (%)
Data Table on South America - Year-over-year growth 2025-2030 (%)
Chart on Regional Comparison - South America
Data Table on Regional Comparison - South America

13.6.1 Brazil - Market size and forecast 2025-2030

Chart on Brazil - Market size and forecast 2025-2030 ($ million)
Data Table on Brazil - Market size and forecast 2025-2030 ($ million)
Chart on Brazil - Year-over-year growth 2025-2030 (%)
Data Table on Brazil - Year-over-year growth 2025-2030 (%)

13.6.2 Argentina - Market size and forecast 2025-2030

Chart on Argentina - Market size and forecast 2025-2030 ($ million)
Data Table on Argentina - Market size and forecast 2025-2030 ($ million)
Chart on Argentina - Year-over-year growth 2025-2030 (%)
Data Table on Argentina - Year-over-year growth 2025-2030 (%)

13.6.3 Colombia - Market size and forecast 2025-2030

Chart on Colombia - Market size and forecast 2025-2030 ($ million)
Data Table on Colombia - Market size and forecast 2025-2030 ($ million)
Chart on Colombia - Year-over-year growth 2025-2030 (%)
Data Table on Colombia - Year-over-year growth 2025-2030 (%)

13.7 Middle East and Africa - Market size and forecast 2025-2030

Chart on Middle East and Africa - Market size and forecast 2025-2030 ($ million)
Data Table on Middle East and Africa - Market size and forecast 2025-2030 ($ million)
Chart on Middle East and Africa - Year-over-year growth 2025-2030 (%)
Data Table on Middle East and Africa - Year-over-year growth 2025-2030 (%)
Chart on Regional Comparison - Middle East and Africa
Data Table on Regional Comparison - Middle East and Africa

13.7.1 Saudi Arabia - Market size and forecast 2025-2030

Chart on Saudi Arabia - Market size and forecast 2025-2030 ($ million)
Data Table on Saudi Arabia - Market size and forecast 2025-2030 ($ million)
Chart on Saudi Arabia - Year-over-year growth 2025-2030 (%)
Data Table on Saudi Arabia - Year-over-year growth 2025-2030 (%)

13.7.2 UAE - Market size and forecast 2025-2030

Chart on UAE - Market size and forecast 2025-2030 ($ million)
Data Table on UAE - Market size and forecast 2025-2030 ($ million)
Chart on UAE - Year-over-year growth 2025-2030 (%)
Data Table on UAE - Year-over-year growth 2025-2030 (%)

13.7.3 South Africa - Market size and forecast 2025-2030

Chart on South Africa - Market size and forecast 2025-2030 ($ million)
Data Table on South Africa - Market size and forecast 2025-2030 ($ million)
Chart on South Africa - Year-over-year growth 2025-2030 (%)
Data Table on South Africa - Year-over-year growth 2025-2030 (%)

13.7.4 Israel - Market size and forecast 2025-2030

Chart on Israel - Market size and forecast 2025-2030 ($ million)
Data Table on Israel - Market size and forecast 2025-2030 ($ million)
Chart on Israel - Year-over-year growth 2025-2030 (%)
Data Table on Israel - Year-over-year growth 2025-2030 (%)

13.7.5 Turkey - Market size and forecast 2025-2030

Chart on Turkey - Market size and forecast 2025-2030 ($ million)
Data Table on Turkey - Market size and forecast 2025-2030 ($ million)
Chart on Turkey - Year-over-year growth 2025-2030 (%)
Data Table on Turkey - Year-over-year growth 2025-2030 (%)

13.8 Market opportunity by geography

Market opportunity by geography ($ million)
Data Tables on Market opportunity by geography ($ million)

14. Drivers, Challenges, and Opportunity

14.1 Market drivers

Rapid expansion of global automotive and electric vehicle sectors
Increasing industrialization and demand within energy and power generation sector
Stringent global regulations and pursuit of material innovation in processing industries

14.2 Market challenges

Volatility in raw material costs and supply chain vulnerabilities
Stringent regulatory frameworks and environmental mandates
High technical barriers and elevated production expenditures

14.3 Impact of drivers and challenges

Impact of drivers and challenges in 2025 and 2030

14.4 Market opportunities

Transition toward sustainable and bio-based sealing materials
Digital transformation and emergence of smart sealing technologies
Advancements in high-performance polymers for extreme operational environments

15. Competitive Landscape

15.1 Overview

15.2

Overview on criticality of inputs and factors of differentiation

15.3 Landscape disruption

Overview on factors of disruption

15.4 Industry risks

Impact of key risks on business

16. Competitive Analysis

16.1 Companies profiled

Companies covered

16.2 Company ranking index

16.3 Market positioning of companies

Matrix on companies position and classification

16.4 A.W. Chesterton Co.

A.W. Chesterton Co. - Overview
A.W. Chesterton Co. - Product / Service
A.W. Chesterton Co. - Key offerings
SWOT

16.5 Compagnie de Saint Gobain SA

Compagnie de Saint Gobain SA - Overview
Compagnie de Saint Gobain SA - Business segments
Compagnie de Saint Gobain SA - Key offerings
Compagnie de Saint Gobain SA - Segment focus
SWOT

16.6 Dana Inc.

Dana Inc. - Overview
Dana Inc. - Business segments
Dana Inc. - Key news
Dana Inc. - Key offerings
Dana Inc. - Segment focus
SWOT

16.7 Datwyler Holding Inc.

Datwyler Holding Inc. - Overview
Datwyler Holding Inc. - Business segments
Datwyler Holding Inc. - Key offerings
Datwyler Holding Inc. - Segment focus
SWOT

16.8 ElringKlinger AG

ElringKlinger AG - Overview
ElringKlinger AG - Business segments
ElringKlinger AG - Key offerings
ElringKlinger AG - Segment focus
SWOT

16.9 Flowserve Corp.

Flowserve Corp. - Overview
Flowserve Corp. - Business segments
Flowserve Corp. - Key offerings
Flowserve Corp. - Segment focus
SWOT

16.10 Freudenberg FST GmbH

Freudenberg FST GmbH - Overview
Freudenberg FST GmbH - Product / Service
Freudenberg FST GmbH - Key offerings
SWOT

16.11 Garlock Sealing Technologies

Garlock Sealing Technologies - Overview
Garlock Sealing Technologies - Product / Service
Garlock Sealing Technologies - Key offerings
SWOT

16.12 Greene Tweed and Co.

Greene Tweed and Co. - Overview
Greene Tweed and Co. - Product / Service
Greene Tweed and Co. - Key offerings
SWOT

16.13 NOK Corp.

NOK Corp. - Overview
NOK Corp. - Business segments
NOK Corp. - Key offerings
NOK Corp. - Segment focus
SWOT

16.14 Parker Hannifin Corp.

Parker Hannifin Corp. - Overview
Parker Hannifin Corp. - Business segments
Parker Hannifin Corp. - Key news
Parker Hannifin Corp. - Key offerings
Parker Hannifin Corp. - Segment focus
SWOT

16.15 SKF AB

SKF AB - Overview
SKF AB - Business segments
SKF AB - Key offerings
SKF AB - Segment focus
SWOT

16.16 Tenneco Inc.

Tenneco Inc. - Overview
Tenneco Inc. - Product / Service
Tenneco Inc. - Key offerings
SWOT

16.17 Trelleborg AB

Trelleborg AB - Overview
Trelleborg AB - Business segments
Trelleborg AB - Key offerings
Trelleborg AB - Segment focus
SWOT

16.18 W. L. Gore and Associates

W. L. Gore and Associates - Overview
W. L. Gore and Associates - Product / Service
W. L. Gore and Associates - Key offerings
SWOT

17. Appendix

17.1 Scope of the report

Market definition
Objectives
Notes and caveats

17.2 Inclusions and exclusions checklist

Inclusions checklist
Exclusions checklist

17.3 Currency conversion rates for US$

17.4 Research methodology

17.5 Data procurement

Information sources

17.6 Data validation

17.7 Validation techniques employed for market sizing

17.8 Data synthesis

17.9 360 degree market analysis

17.10 List of abbreviations

Research Methodology

Technavio presents a detailed picture of the market by way of study, synthesis, and summation of data from multiple sources. The analysts have presented the various facets of the market with a particular focus on identifying the key industry influencers. The data thus presented is comprehensive, reliable, and the result of extensive research, both primary and secondary.

INFORMATION SOURCES

Primary sources

  • Manufacturers and suppliers
  • Channel partners
  • Industry experts
  • Strategic decision makers

Secondary sources

  • Industry journals and periodicals
  • Government data
  • Financial reports of key industry players
  • Historical data
  • Press releases

DATA ANALYSIS

Data Synthesis

  • Collation of data
  • Estimation of key figures
  • Analysis of derived insights

Data Validation

  • Triangulation with data models
  • Reference against proprietary databases
  • Corroboration with industry experts

REPORT WRITING

Qualitative

  • Market drivers
  • Market challenges
  • Market trends
  • Five forces analysis

Quantitative

  • Market size and forecast
  • Market segmentation
  • Geographical insights
  • Competitive landscape

Interested in this report?

Get your sample now to see our research methodology and insights!

Download Now

Frequently Asked Questions

Gasket And Seal Materials market growth will increase by USD 24053.5 million during 2026-2030.

The Gasket And Seal Materials market is expected to grow at a CAGR of 6.6% during 2026-2030.

Gasket And Seal Materials market is segmented by End-user (OEMs, Aftersales market) Application (Automotive, Industrial machinery, Electrical and electronics, Oil and gas, Others) Product (Seals, Gasket) Material (Rubber, Metal, Fiber, PTFE, Others)

A.W. Chesterton Co., Compagnie de Saint Gobain SA, Dana Inc., Datwyler Holding Inc., ElringKlinger AG, Flowserve Corp., Freudenberg FST GmbH, Garlock Sealing Technologies, Greene Tweed and Co., Hutchinson S.A., James Walker Group Ltd., John Crane Inc., Lamons, NOK Corp., Parker Hannifin Corp., SKF AB, Teadit, Tenneco Inc., Trelleborg AB, W. L. Gore and Associates are a few of the key vendors in the Gasket And Seal Materials market.

APAC will register the highest growth rate of 41.6% among the other regions. Therefore, the Gasket And Seal Materials market in APAC is expected to garner significant business opportunities for the vendors during the forecast period.

China, Japan, India, South Korea, Australia, Indonesia, US, Canada, Mexico, Germany, France, Italy, UK, Spain, Poland, Brazil, Argentina, Colombia, Saudi Arabia, UAE, South Africa, Israel, Turkey

  • Rapid expansion of global automotive and electric vehicle sectors is the driving factor this market.

The Gasket And Seal Materials market vendors should focus on grabbing business opportunities from the End-user segment as it accounted for the largest market share in the base year.
RIA - Research AI Assistant
Ask RIA
