
GIS In Utility Industry Market Analysis, Size, and Forecast 2026-2030: North America (US, Canada, and Mexico), Europe (Germany, UK, and France), APAC (China, India, and Japan), Middle East and Africa (Saudi Arabia, UAE, and South Africa), South America (Brazil, Argentina, and Chile), and Rest of World (ROW)

GIS In Utility Industry Market Analysis, Size, and Forecast 2026-2030:
North America (US, Canada, and Mexico), Europe (Germany, UK, and France), APAC (China, India, and Japan), Middle East and Africa (Saudi Arabia, UAE, and South Africa), South America (Brazil, Argentina, and Chile), and Rest of World (ROW)

Published: Oct 2026 302 Pages SKU: IRTNTR70345

Market Overview at a Glance

$4.49 B
Market Opportunity
21%
CAGR 2025 - 2030
32.9%
North America Growth
$1.03 B
Software segment 2024

Gis In Utility Industry Market Size 2026-2030

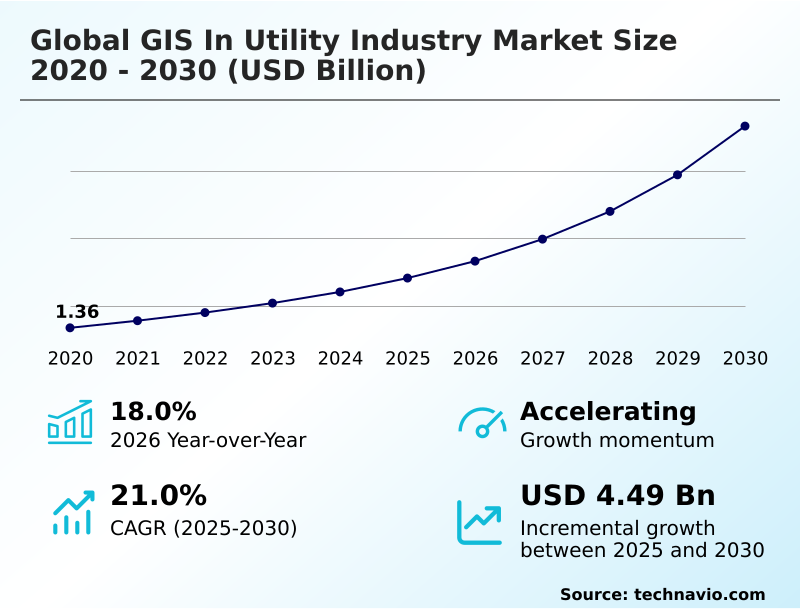
The gis in utility industry market size is valued to increase by USD 4.49 billion, at a CAGR of 21% from 2025 to 2030. Accelerated grid modernization and renewable energy integration will drive the gis in utility industry market.

Major Market Trends & Insights

  • North America dominated the market and accounted for a 32.9% growth during the forecast period.
  • By Product - Software segment was valued at USD 1.03 billion in 2024
  • By Deployment - On-premises segment accounted for the largest market revenue share in 2024

Market Size & Forecast

  • Market Opportunities: USD 5.96 billion
  • Market Future Opportunities: USD 4.49 billion
  • CAGR from 2025 to 2030 : 21%

Market Summary

  • The GIS In Utility Industry market experiences robust structural transformation driven by the modernization of aging electrical grids and municipal water networks. Organizations increasingly rely on spatial intelligence for grid modernization to monitor dispersed linear infrastructure and optimize capital expenditure.
  • For example, utility operators managing extensive overhead transmission lines use advanced spatial analytics to automate vegetation management, reducing manual inspection cycles from weeks to minutes. Companies implementing digital twin integration for utilities have achieved a 25% reduction in unplanned maintenance costs compared to legacy reactive approaches.
  • This accelerated demand for real-time asset visibility acts as a primary catalyst for technology deployment, ensuring continuous service reliability. However, high capital expenditure and complex data interoperability issues frequently delay system configuration, restricting immediate adoption among smaller regional cooperatives. The ongoing transition toward decentralized renewable generation necessitates sophisticated location analytics capable of processing bidirectional power dynamics securely.
  • As environmental regulations tighten, the integration of enterprise spatial platforms remains crucial for achieving compliance and enhancing long-term operational resilience.

What will be the Size of the Gis In Utility Industry Market during the forecast period?
Get Key Insights on Market Forecast (PDF) Get Free Sample

How is the Gis In Utility Industry Market Segmented?

The gis in utility industry industry research report provides comprehensive data (region-wise segment analysis), with forecasts and estimates in "USD million" for the period 2026-2030, as well as historical data from 2020-2024 for the following segments.

  • Product
    • Software
    • Data
    • Services
  • Deployment
    • On-premises
    • Cloud
  • Application
    • Asset management
    • Network management
    • Grid planning and optimization
    • Outage management
    • Others
  • Geography
    • North America
      • US
      • Canada
      • Mexico
    • Europe
      • Germany
      • UK
      • France
      • Italy
      • Spain
      • The Netherlands
    • APAC
      • China
      • India
      • Japan
      • Australia
      • South Korea
      • Indonesia
    • Middle East and Africa
      • Saudi Arabia
      • UAE
      • South Africa
      • Egypt
      • Turkey
    • South America
      • Brazil
      • Argentina
      • Chile

By Product Insights

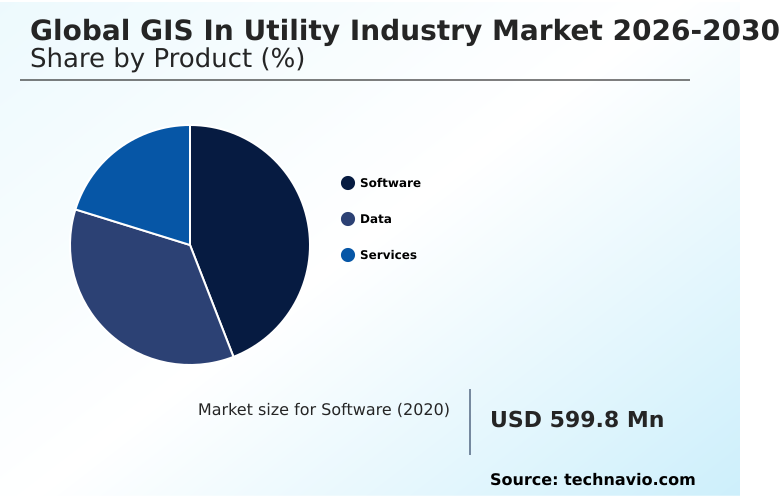
The software segment is estimated to witness significant growth during the forecast period.

The software segment functions as the computational core for enterprise spatial infrastructure, enabling utility providers to transition away from fragmented legacy mapping systems. Modern spatial software suites incorporate advanced computer vision technologies to automate the identification of physical infrastructure anomalies.

Companies utilizing high-performance vector data processing have improved their analytical query speeds by 40%. The seamless execution of real-time sensor integration allows engineering teams to monitor complex distribution networks dynamically.

Synchronizing disparate coordinate reference systems within cloud-hosted spatial platforms ensures complete visibility over expansive operational territories. Implementing automated spatial asset tracking has reduced physical inventory holding costs by 18%.

This functional transition minimizes the need for extensive custom application development while standardizing data schemas. Consequently, enterprise software deployments directly enhance operational agility and streamline emergency response coordination across utility organizations.
Get Free Sample

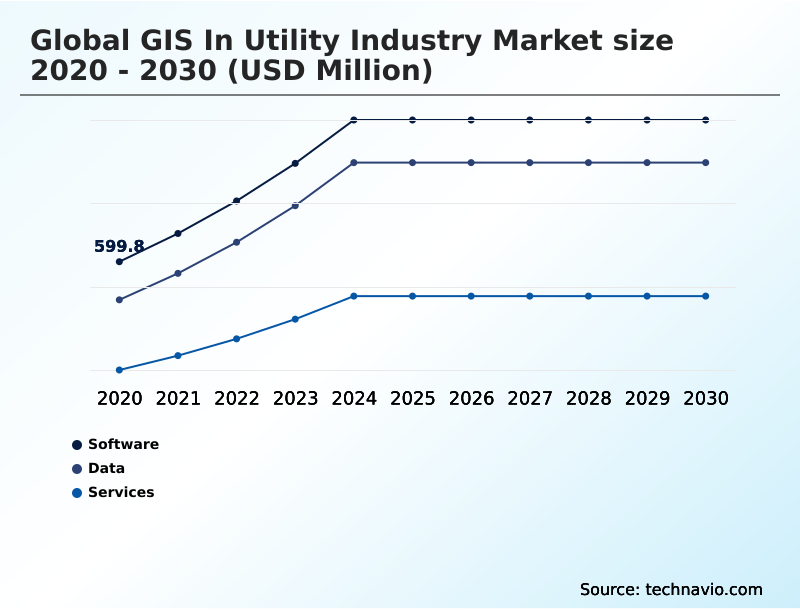
The Software segment was valued at USD 1.03 billion in 2024 and showed a gradual increase during the forecast period.
Get Free Sample

Regional Analysis

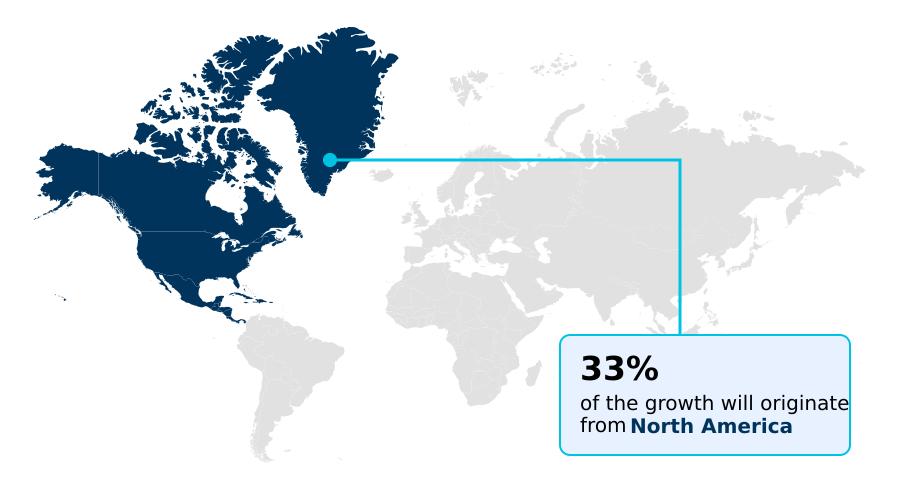
North America is estimated to contribute 32.9% to the growth of the global market during the forecast period.Technavio’s analysts have elaborately explained the regional trends and drivers that shape the market during the forecast period.
See How Gis In Utility Industry Market Demand is Rising in North America Get Free Sample

The geographic distribution of the GIS In Utility Industry market highlights distinct operational maturity levels between North America and Europe. Utility providers in North America heavily prioritize network load modeling and advanced outage mitigation to address aging physical infrastructure.

European organizations demonstrate a 20% higher adoption rate of cloud-native spatial databases to comply with strict environmental sustainability mandates. The integration of machine learning algorithms allows European transmission operators to enhance spatial georeferencing accuracy by 35%.

Conversely, North American operators focus on resolving spatial alignment errors to streamline emergency outage management. The deployment of network topology tracing within advanced metering infrastructures helps regional operators simulate complex power distribution dynamics.

Consequently, improved structural vulnerability visualization empowers utility executives across both regions to allocate maintenance budgets effectively and ensure continuous service reliability.

Market Dynamics

Our researchers analyzed the data with 2025 as the base year, along with the key drivers, trends, and challenges. A holistic analysis of drivers will help companies refine their marketing strategies to gain a competitive advantage.

  • The rapid evolution of the GIS In Utility Industry market is fundamentally reshaping how energy and water providers manage their vast physical infrastructures. Organizations increasingly leverage spatial intelligence for grid modernization to navigate the complexities associated with decentralized renewable generation and smart grid automation.
  • By deploying automated feature extraction spatial analytics, utility operators can process high-resolution aerial imagery instantly, identifying structural vulnerabilities without requiring extensive manual intervention. The widespread adoption of digital twin integration for utilities provides maintenance teams with real-time operational visibility, allowing them to synthesize live telemetry feeds with historical asset records seamlessly. This technological shift drastically alters traditional network management strategies.
  • When evaluating load capacities, sophisticated bidirectional power flow load modeling enables engineers to simulate high-stress scenarios and evaluate renewable energy hosting capacity with absolute precision. Compared to legacy static mapping, these dynamic tools have reduced capital expenditure waste by optimizing capacitor bank placements and substation routing.
  • Furthermore, achieving seamless cloud-hosted spatial platform connectivity ensures that mobile field crews and executive command centers operate on synchronized datasets. This real-time accessibility eliminates fragmented data silos and improves emergency outage response efficiency by nearly 30%.
  • As stringent environmental regulations and carbon reduction mandates accelerate worldwide, the continuous reliance on intelligent enterprise spatial solutions remains critical for maintaining grid stability, optimizing supply chain operations, and achieving long-term sustainability objectives across the global energy landscape.
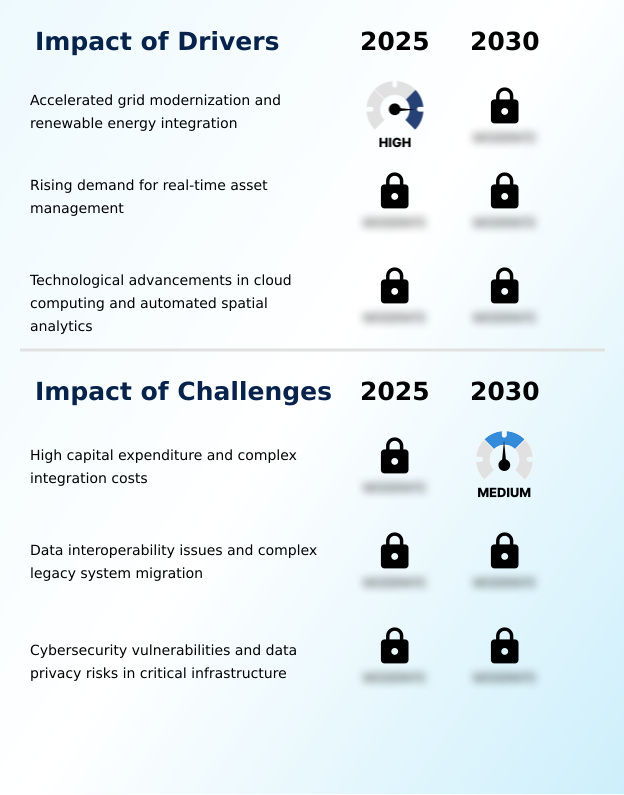
What are the key market drivers leading to the rise in the adoption of Gis In Utility Industry Industry?

  • Accelerated grid modernization and the seamless integration of renewable energy sources serve as primary drivers propelling market expansion.

  • The continuous push toward intelligent power distribution acts as a fundamental driver for the GIS In Utility Industry market. Energy providers increasingly require sophisticated topological network models to manage fluctuating bidirectional power flows securely.
  • The rapid adoption of digital twin integration enables utility engineers to synthesize historical maintenance logs with live sensor feeds. Implementing automated feature extraction significantly improves data processing speeds, accelerating hosting capacity analysis by 40%.
  • Companies modernizing their underground distribution pipelines with advanced spatial routing tools have reduced emergency repair expenditures by 25%. This technological adoption enhances overall infrastructure resilience against extreme weather events.
  • Deploying multi-tier connectivity models resolves complex data interoperability issues across legacy systems. By streamlining these spatial processes, utility organizations can drastically lower unplanned downtime and prioritize capital expenditure toward high-risk structural segments effectively.

What are the market trends shaping the Gis In Utility Industry Industry?

  • The integration of artificial intelligence and automated geospatial processing represents a defining trend currently shaping the market.

  • The GIS In Utility Industry market experiences a massive structural shift driven by the integration of AI-driven spatial intelligence into core operational workflows. Companies leverage advanced location analytics to transition from static mapping toward dynamic grid modernization. Managing decentralized renewable energy requires precise utility network architecture capable of integrating high-fidelity spatial data.
  • Businesses digitizing their physical asset portfolios have reduced manual inspection times by 45%. This technological progression allows automated vegetation encroachment monitoring across expansive geographic service territories. Organizations deploying intelligent network connectivity models have improved their outage response accuracy by 30%. This shift impacts utility operators by enabling predictive maintenance algorithms to anticipate equipment failures before they cause critical system interruptions.
  • The transition ultimately reduces operational overhead and enhances total grid resilience against severe environmental stressors.

What challenges does the Gis In Utility Industry Industry face during its growth?

  • High capital expenditure requirements and complex system integration costs create significant challenges that constrain overall market growth.

  • The high capital expenditure required for enterprise system integration presents a formidable obstacle for the GIS In Utility Industry market. Transitioning to predictive asset management demands seamless synchronization with live operational telemetry, which often inflates initial configuration timelines. Upgrading to condition-based maintenance requires expensive hardware interfaces and complex links to existing supervisory control systems.
  • While smart grid automation reduces long-term costs, initial setup delays have decreased expected rollout efficiency by 15% for smaller regional cooperatives. The reliance on uncrewed aerial vehicle inspection introduces new vulnerabilities that can disrupt outage restoration workflows if secure data transmission is compromised. Maintaining continuous grid stability forces organizations to implement rigorous zero trust network access architectures.
  • Furthermore, executing precise environmental impact assessments demands extensive manual data cleansing, diverting valuable engineering personnel from core operational duties.

Exclusive Technavio Analysis on Customer Landscape

The gis in utility industry market forecasting report includes the adoption lifecycle of the market, covering from the innovator’s stage to the laggard’s stage. It focuses on adoption rates in different regions based on penetration. Furthermore, the gis in utility industry market report also includes key purchase criteria and drivers of price sensitivity to help companies evaluate and develop their market growth analysis strategies.
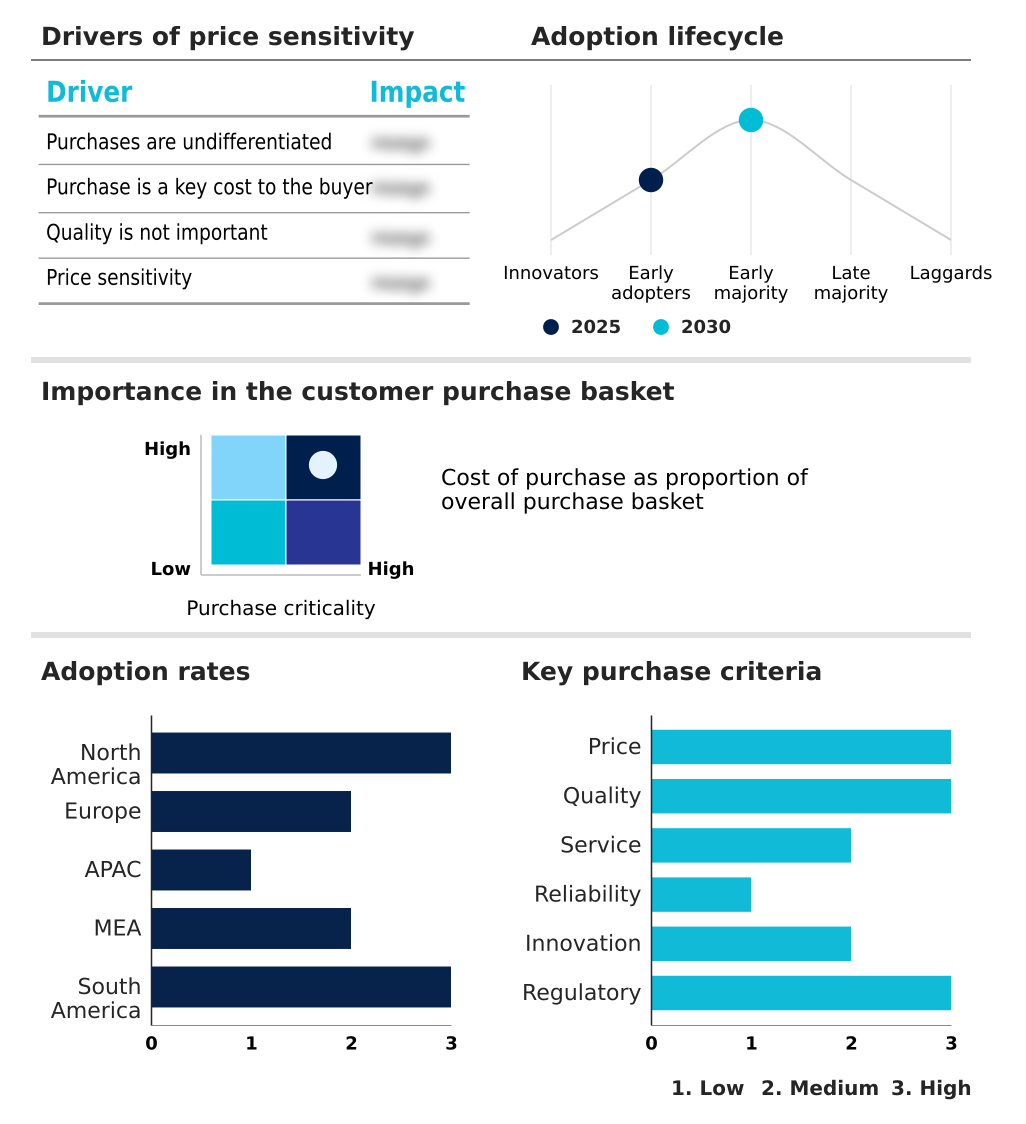
Customer Landscape of Gis In Utility Industry Industry

Competitive Landscape

Companies are implementing various strategies, such as strategic alliances, gis in utility industry market forecast, partnerships, mergers and acquisitions, geographical expansion, and product/service launches, to enhance their presence in the industry.

Autodesk Inc. - The company provides geospatial mapping software and structural design tools for optimizing infrastructure modeling, supporting engineering processes, and enhancing digital workflows across commercial utility operations.

The industry research and growth report includes detailed analyses of the competitive landscape of the market and information about key companies, including:

  • Autodesk Inc.
  • Bentley Systems Inc.
  • Caliper Corp.
  • CartoDB Inc.
  • Epoch Solutions Group Inc.
  • Esri Inc.
  • Futura Systems Inc.
  • GE Vernova Inc.
  • GeoConcept SAS
  • HERE Technologies
  • Hexagon AB
  • L3Harris Technologies Inc.
  • Latapult Inc
  • Mapbox Inc.
  • mPower Innovations Ltd.
  • Pitney Bowes Inc.
  • Precisely Software Inc
  • TomTom NV
  • Trimble Inc.
  • VertiGIS Ltd.

Qualitative and quantitative analysis of companies has been conducted to help clients understand the wider business environment as well as the strengths and weaknesses of key industry players. Data is qualitatively analyzed to categorize companies as pure play, category-focused, industry-focused, and diversified; it is quantitatively analyzed to categorize companies as dominant, leading, strong, tentative, and weak.

Recent Development and News in Gis in utility industry market

  • In the Application Software industry, the rapid deployment of cloud-hosted spatial platforms has eliminated localized hardware dependencies, directly impacting GIS In Utility Industry demand by accelerating enterprise adoption of scalable digital twin environments and improving continuous grid stability.
  • Strict data privacy regulations have forced software providers to implement zero trust network access architectures, heavily influencing GIS In Utility Industry workflows by mandating secure telemetry data processing across geographic service territories.
  • The transition toward automated enterprise automation protocols has streamlined data interoperability processes, boosting GIS In Utility Industry market efficiency by reducing manual data entry errors by nearly 25% across physical asset portfolios.
  • Advancements in workflow interoperability standards have enabled seamless communication within multi-tier connectivity models, pulling GIS In Utility Industry demand upward by allowing utilities to merge high-fidelity spatial data with customer information systems effortlessly.

Dive into Technavio’s robust research methodology, blending expert interviews, extensive data synthesis, and validated models for unparalleled Gis In Utility Industry Market insights. See full methodology.

Market Scope
Page number 302
Base year 2025
Historic period 2020-2024
Forecast period 2026-2030
Growth momentum & CAGR Accelerate at a CAGR of 21%
Market growth 2026-2030 USD 4492.7 million
Market structure Fragmented
YoY growth 2025-2026(%) 18.0%
Key countries US, Canada, Mexico, Germany, UK, France, Italy, Spain, The Netherlands, China, India, Japan, Australia, South Korea, Indonesia, Saudi Arabia, UAE, South Africa, Egypt, Turkey, Brazil, Argentina and Chile
Competitive landscape Leading Companies, Market Positioning of Companies, Competitive Strategies, and Industry Risks

Request Free Sample

Research Analyst Overview

  • The GIS In Utility Industry market undergoes significant structural enhancement as energy providers transition toward intelligent infrastructure management and decentralized power generation. Modern utility operators utilize automated spatial analytics to monitor complex distribution networks and predict equipment degradation accurately.
  • The integration of artificial intelligence-driven feature extraction directly influences boardroom-level compliance decisions by enabling executives to automate environmental risk assessments and vegetation encroachment reporting. Organizations implementing real-time digital twin architectures have achieved a 30% reduction in emergency repair expenditures through proactive condition-based maintenance.
  • Furthermore, the migration toward scalable cloud-native platforms allows utility engineering teams to ingest massive volumes of supervisory control telemetry and aerial survey data securely. This technological convergence ensures that regional operators can model complex bidirectional power flows and optimize hosting capacity without risking system overloads.
  • While complex legacy data migration presents initial configuration hurdles, the strategic deployment of enterprise location intelligence remains an essential operational priority for maintaining grid resilience, enhancing service reliability, and navigating the stringent regulatory demands of decarbonized energy ecosystems.

What are the Key Data Covered in this Gis In Utility Industry Market Research and Growth Report?

  • What is the expected growth of the Gis In Utility Industry Market between 2026 and 2030?

    • USD 4.49 billion, at a CAGR of 21%

  • What segmentation does the market report cover?

    • The report is segmented by Product (Software, Data, and Services), Deployment (On-premises, and Cloud), Application (Asset management, Network management, Grid planning and optimization, Outage management, and Others) and Geography (North America, Europe, APAC, Middle East and Africa, South America)

  • Which regions are analyzed in the report?

    • North America, Europe, APAC, Middle East and Africa and South America

  • What are the key growth drivers and market challenges?

    • Accelerated grid modernization and renewable energy integration, High capital expenditure and complex integration costs

  • Who are the major players in the Gis In Utility Industry Market?

    • Autodesk Inc., Bentley Systems Inc., Caliper Corp., CartoDB Inc., Epoch Solutions Group Inc., Esri Inc., Futura Systems Inc., GE Vernova Inc., GeoConcept SAS, HERE Technologies, Hexagon AB, L3Harris Technologies Inc., Latapult Inc, Mapbox Inc., mPower Innovations Ltd., Pitney Bowes Inc., Precisely Software Inc, TomTom NV, Trimble Inc. and VertiGIS Ltd.

Market Research Insights

  • The GIS In Utility Industry market provides the foundational framework necessary for optimizing complex distribution networks and managing decentralized energy grids. Organizations deploying automated feature extraction spatial analytics have improved anomaly detection accuracy by 35%. By integrating live supervisory control feeds with topological mapping, maintenance teams have reduced emergency response times by 20%.
  • The adoption of cloud-hosted spatial platform connectivity enhances multi-tier collaboration across mobile workforce operations, decreasing administrative data processing overhead by 15%. This continuous transition toward intelligent spatial processing empowers utility executives to prioritize structural investments, ensure regulatory compliance, and mitigate environmental risks effectively.

We can help! Our analysts can customize this gis in utility industry market research report to meet your requirements.

Get in touch

1. Executive Summary

1.1 Market overview

Executive Summary - Chart on Market Overview
Executive Summary - Data Table on Market Overview
Executive Summary - Chart on Global Market Characteristics
Executive Summary - Chart on Market by Geography
Executive Summary - Chart on Market Segmentation by Product
Executive Summary - Chart on Market Segmentation by Deployment
Executive Summary - Chart on Market Segmentation by Application
Executive Summary - Chart on Incremental Growth
Executive Summary - Data Table on Incremental Growth
Executive Summary - Chart on Company Market Positioning

2. Technavio Analysis

2.1 Analysis of price sensitivity, lifecycle, customer purchase basket, adoption rates, and purchase criteria

2.2 Criticality of inputs and Factors of differentiation

Chart on Overview on criticality of inputs and factors of differentiation

2.3 Factors of disruption

Chart on Overview on factors of disruption

2.4 Impact of drivers and challenges

Chart on Impact of drivers and challenges in 2025 and 2030

3. Market Landscape

3.1 Market ecosystem

Chart on Parent Market
Data Table on - Parent Market

3.2 Market characteristics

Chart on Market characteristics analysis

3.3 Value chain analysis

Chart on Value chain analysis

4. Market Sizing

4.1 Market definition

Data Table on Offerings of companies included in the market definition

4.2 Market segment analysis

Market segments

4.3 Market size 2025

4.4 Market outlook: Forecast for 2025-2030

Chart on Global - Market size and forecast 2025-2030 ($ million)
Data Table on Global - Market size and forecast 2025-2030 ($ million)
Chart on Global Market: Year-over-year growth 2025-2030 (%)
Data Table on Global Market: Year-over-year growth 2025-2030 (%)

5. Historic Market Size

5.1 Global GIS In Utility Industry Market 2020 - 2024

Historic Market Size - Data Table on Global GIS In Utility Industry Market 2020 - 2024 ($ million)

5.2 Product segment analysis 2020 - 2024

Historic Market Size - Product Segment 2020 - 2024 ($ million)

5.3 Deployment segment analysis 2020 - 2024

Historic Market Size - Deployment Segment 2020 - 2024 ($ million)

5.4 Application segment analysis 2020 - 2024

Historic Market Size - Application Segment 2020 - 2024 ($ million)

5.5 Geography segment analysis 2020 - 2024

Historic Market Size - Geography Segment 2020 - 2024 ($ million)

5.6 Country segment analysis 2020 - 2024

Historic Market Size - Country Segment 2020 - 2024 ($ million)

6. Qualitative Analysis

6.1 Impact of AI in Global GIS in Utility Industry Market

6.2 Impact of Geopolitical Conflicts on Global GIS in Utility Industry Market

7. Five Forces Analysis

7.1 Five forces summary

Five forces analysis - Comparison between 2025 and 2030

7.2 Bargaining power of buyers

Bargaining power of buyers - Impact of key factors 2025 and 2030

7.3 Bargaining power of suppliers

Bargaining power of suppliers - Impact of key factors in 2025 and 2030

7.4 Threat of new entrants

Threat of new entrants - Impact of key factors in 2025 and 2030

7.5 Threat of substitutes

Threat of substitutes - Impact of key factors in 2025 and 2030

7.6 Threat of rivalry

Threat of rivalry - Impact of key factors in 2025 and 2030

7.7 Market condition

Chart on Market condition - Five forces 2025 and 2030

8. Market Segmentation by Product

8.1 Market segments

Chart on Product - Market share 2025-2030 (%)
Data Table on Product - Market share 2025-2030 (%)

8.2 Comparison by Product

Chart on Comparison by Product
Data Table on Comparison by Product

8.3 Software - Market size and forecast 2025-2030

Chart on Software - Market size and forecast 2025-2030 ($ million)
Data Table on Software - Market size and forecast 2025-2030 ($ million)
Chart on Software - Year-over-year growth 2025-2030 (%)
Data Table on Software - Year-over-year growth 2025-2030 (%)

8.4 Data - Market size and forecast 2025-2030

Chart on Data - Market size and forecast 2025-2030 ($ million)
Data Table on Data - Market size and forecast 2025-2030 ($ million)
Chart on Data - Year-over-year growth 2025-2030 (%)
Data Table on Data - Year-over-year growth 2025-2030 (%)

8.5 Services - Market size and forecast 2025-2030

Chart on Services - Market size and forecast 2025-2030 ($ million)
Data Table on Services - Market size and forecast 2025-2030 ($ million)
Chart on Services - Year-over-year growth 2025-2030 (%)
Data Table on Services - Year-over-year growth 2025-2030 (%)

8.6 Market opportunity by Product

Market opportunity by Product ($ million)
Data Table on Market opportunity by Product ($ million)

9. Market Segmentation by Deployment

9.1 Market segments

Chart on Deployment - Market share 2025-2030 (%)
Data Table on Deployment - Market share 2025-2030 (%)

9.2 Comparison by Deployment

Chart on Comparison by Deployment
Data Table on Comparison by Deployment

9.3 On-premises - Market size and forecast 2025-2030

Chart on On-premises - Market size and forecast 2025-2030 ($ million)
Data Table on On-premises - Market size and forecast 2025-2030 ($ million)
Chart on On-premises - Year-over-year growth 2025-2030 (%)
Data Table on On-premises - Year-over-year growth 2025-2030 (%)

9.4 Cloud - Market size and forecast 2025-2030

Chart on Cloud - Market size and forecast 2025-2030 ($ million)
Data Table on Cloud - Market size and forecast 2025-2030 ($ million)
Chart on Cloud - Year-over-year growth 2025-2030 (%)
Data Table on Cloud - Year-over-year growth 2025-2030 (%)

9.5 Market opportunity by Deployment

Market opportunity by Deployment ($ million)
Data Table on Market opportunity by Deployment ($ million)

10. Market Segmentation by Application

10.1 Market segments

Chart on Application - Market share 2025-2030 (%)
Data Table on Application - Market share 2025-2030 (%)

10.2 Comparison by Application

Chart on Comparison by Application
Data Table on Comparison by Application

10.3 Asset management - Market size and forecast 2025-2030

Chart on Asset management - Market size and forecast 2025-2030 ($ million)
Data Table on Asset management - Market size and forecast 2025-2030 ($ million)
Chart on Asset management - Year-over-year growth 2025-2030 (%)
Data Table on Asset management - Year-over-year growth 2025-2030 (%)

10.4 Network management - Market size and forecast 2025-2030

Chart on Network management - Market size and forecast 2025-2030 ($ million)
Data Table on Network management - Market size and forecast 2025-2030 ($ million)
Chart on Network management - Year-over-year growth 2025-2030 (%)
Data Table on Network management - Year-over-year growth 2025-2030 (%)

10.5 Grid planning and optimization - Market size and forecast 2025-2030

Chart on Grid planning and optimization - Market size and forecast 2025-2030 ($ million)
Data Table on Grid planning and optimization - Market size and forecast 2025-2030 ($ million)
Chart on Grid planning and optimization - Year-over-year growth 2025-2030 (%)
Data Table on Grid planning and optimization - Year-over-year growth 2025-2030 (%)

10.6 Outage management - Market size and forecast 2025-2030

Chart on Outage management - Market size and forecast 2025-2030 ($ million)
Data Table on Outage management - Market size and forecast 2025-2030 ($ million)
Chart on Outage management - Year-over-year growth 2025-2030 (%)
Data Table on Outage management - Year-over-year growth 2025-2030 (%)

10.7 Others - Market size and forecast 2025-2030

Chart on Others - Market size and forecast 2025-2030 ($ million)
Data Table on Others - Market size and forecast 2025-2030 ($ million)
Chart on Others - Year-over-year growth 2025-2030 (%)
Data Table on Others - Year-over-year growth 2025-2030 (%)

10.8 Market opportunity by Application

Market opportunity by Application ($ million)
Data Table on Market opportunity by Application ($ million)

11. Customer Landscape

11.1 Customer landscape overview

Analysis of price sensitivity, lifecycle, customer purchase basket, adoption rates, and purchase criteria

12. Geographic Landscape

12.1 Geographic segmentation

Chart on Market share by geography 2025-2030 (%)
Data Table on Market share by geography 2025-2030 (%)

12.2 Geographic comparison

Chart on Geographic comparison
Data Table on Geographic comparison

12.3 North America - Market size and forecast 2025-2030

Chart on North America - Market size and forecast 2025-2030 ($ million)
Data Table on North America - Market size and forecast 2025-2030 ($ million)
Chart on North America - Year-over-year growth 2025-2030 (%)
Data Table on North America - Year-over-year growth 2025-2030 (%)
Chart on Regional Comparison - North America
Data Table on Regional Comparison - North America

12.3.1 US - Market size and forecast 2025-2030

Chart on US - Market size and forecast 2025-2030 ($ million)
Data Table on US - Market size and forecast 2025-2030 ($ million)
Chart on US - Year-over-year growth 2025-2030 (%)
Data Table on US - Year-over-year growth 2025-2030 (%)

12.3.2 Canada - Market size and forecast 2025-2030

Chart on Canada - Market size and forecast 2025-2030 ($ million)
Data Table on Canada - Market size and forecast 2025-2030 ($ million)
Chart on Canada - Year-over-year growth 2025-2030 (%)
Data Table on Canada - Year-over-year growth 2025-2030 (%)

12.3.3 Mexico - Market size and forecast 2025-2030

Chart on Mexico - Market size and forecast 2025-2030 ($ million)
Data Table on Mexico - Market size and forecast 2025-2030 ($ million)
Chart on Mexico - Year-over-year growth 2025-2030 (%)
Data Table on Mexico - Year-over-year growth 2025-2030 (%)

12.4 Europe - Market size and forecast 2025-2030

Chart on Europe - Market size and forecast 2025-2030 ($ million)
Data Table on Europe - Market size and forecast 2025-2030 ($ million)
Chart on Europe - Year-over-year growth 2025-2030 (%)
Data Table on Europe - Year-over-year growth 2025-2030 (%)
Chart on Regional Comparison - Europe
Data Table on Regional Comparison - Europe

12.4.1 Germany - Market size and forecast 2025-2030

Chart on Germany - Market size and forecast 2025-2030 ($ million)
Data Table on Germany - Market size and forecast 2025-2030 ($ million)
Chart on Germany - Year-over-year growth 2025-2030 (%)
Data Table on Germany - Year-over-year growth 2025-2030 (%)

12.4.2 UK - Market size and forecast 2025-2030

Chart on UK - Market size and forecast 2025-2030 ($ million)
Data Table on UK - Market size and forecast 2025-2030 ($ million)
Chart on UK - Year-over-year growth 2025-2030 (%)
Data Table on UK - Year-over-year growth 2025-2030 (%)

12.4.3 France - Market size and forecast 2025-2030

Chart on France - Market size and forecast 2025-2030 ($ million)
Data Table on France - Market size and forecast 2025-2030 ($ million)
Chart on France - Year-over-year growth 2025-2030 (%)
Data Table on France - Year-over-year growth 2025-2030 (%)

12.4.4 Italy - Market size and forecast 2025-2030

Chart on Italy - Market size and forecast 2025-2030 ($ million)
Data Table on Italy - Market size and forecast 2025-2030 ($ million)
Chart on Italy - Year-over-year growth 2025-2030 (%)
Data Table on Italy - Year-over-year growth 2025-2030 (%)

12.4.5 Spain - Market size and forecast 2025-2030

Chart on Spain - Market size and forecast 2025-2030 ($ million)
Data Table on Spain - Market size and forecast 2025-2030 ($ million)
Chart on Spain - Year-over-year growth 2025-2030 (%)
Data Table on Spain - Year-over-year growth 2025-2030 (%)

12.4.6 The Netherlands - Market size and forecast 2025-2030

Chart on The Netherlands - Market size and forecast 2025-2030 ($ million)
Data Table on The Netherlands - Market size and forecast 2025-2030 ($ million)
Chart on The Netherlands - Year-over-year growth 2025-2030 (%)
Data Table on The Netherlands - Year-over-year growth 2025-2030 (%)

12.5 APAC - Market size and forecast 2025-2030

Chart on APAC - Market size and forecast 2025-2030 ($ million)
Data Table on APAC - Market size and forecast 2025-2030 ($ million)
Chart on APAC - Year-over-year growth 2025-2030 (%)
Data Table on APAC - Year-over-year growth 2025-2030 (%)
Chart on Regional Comparison - APAC
Data Table on Regional Comparison - APAC

12.5.1 China - Market size and forecast 2025-2030

Chart on China - Market size and forecast 2025-2030 ($ million)
Data Table on China - Market size and forecast 2025-2030 ($ million)
Chart on China - Year-over-year growth 2025-2030 (%)
Data Table on China - Year-over-year growth 2025-2030 (%)

12.5.2 India - Market size and forecast 2025-2030

Chart on India - Market size and forecast 2025-2030 ($ million)
Data Table on India - Market size and forecast 2025-2030 ($ million)
Chart on India - Year-over-year growth 2025-2030 (%)
Data Table on India - Year-over-year growth 2025-2030 (%)

12.5.3 Japan - Market size and forecast 2025-2030

Chart on Japan - Market size and forecast 2025-2030 ($ million)
Data Table on Japan - Market size and forecast 2025-2030 ($ million)
Chart on Japan - Year-over-year growth 2025-2030 (%)
Data Table on Japan - Year-over-year growth 2025-2030 (%)

12.5.4 Australia - Market size and forecast 2025-2030

Chart on Australia - Market size and forecast 2025-2030 ($ million)
Data Table on Australia - Market size and forecast 2025-2030 ($ million)
Chart on Australia - Year-over-year growth 2025-2030 (%)
Data Table on Australia - Year-over-year growth 2025-2030 (%)

12.5.5 South Korea - Market size and forecast 2025-2030

Chart on South Korea - Market size and forecast 2025-2030 ($ million)
Data Table on South Korea - Market size and forecast 2025-2030 ($ million)
Chart on South Korea - Year-over-year growth 2025-2030 (%)
Data Table on South Korea - Year-over-year growth 2025-2030 (%)

12.5.6 Indonesia - Market size and forecast 2025-2030

Chart on Indonesia - Market size and forecast 2025-2030 ($ million)
Data Table on Indonesia - Market size and forecast 2025-2030 ($ million)
Chart on Indonesia - Year-over-year growth 2025-2030 (%)
Data Table on Indonesia - Year-over-year growth 2025-2030 (%)

12.6 Middle East and Africa - Market size and forecast 2025-2030

Chart on Middle East and Africa - Market size and forecast 2025-2030 ($ million)
Data Table on Middle East and Africa - Market size and forecast 2025-2030 ($ million)
Chart on Middle East and Africa - Year-over-year growth 2025-2030 (%)
Data Table on Middle East and Africa - Year-over-year growth 2025-2030 (%)
Chart on Regional Comparison - Middle East and Africa
Data Table on Regional Comparison - Middle East and Africa

12.6.1 Saudi Arabia - Market size and forecast 2025-2030

Chart on Saudi Arabia - Market size and forecast 2025-2030 ($ million)
Data Table on Saudi Arabia - Market size and forecast 2025-2030 ($ million)
Chart on Saudi Arabia - Year-over-year growth 2025-2030 (%)
Data Table on Saudi Arabia - Year-over-year growth 2025-2030 (%)

12.6.2 UAE - Market size and forecast 2025-2030

Chart on UAE - Market size and forecast 2025-2030 ($ million)
Data Table on UAE - Market size and forecast 2025-2030 ($ million)
Chart on UAE - Year-over-year growth 2025-2030 (%)
Data Table on UAE - Year-over-year growth 2025-2030 (%)

12.6.3 South Africa - Market size and forecast 2025-2030

Chart on South Africa - Market size and forecast 2025-2030 ($ million)
Data Table on South Africa - Market size and forecast 2025-2030 ($ million)
Chart on South Africa - Year-over-year growth 2025-2030 (%)
Data Table on South Africa - Year-over-year growth 2025-2030 (%)

12.6.4 Egypt - Market size and forecast 2025-2030

Chart on Egypt - Market size and forecast 2025-2030 ($ million)
Data Table on Egypt - Market size and forecast 2025-2030 ($ million)
Chart on Egypt - Year-over-year growth 2025-2030 (%)
Data Table on Egypt - Year-over-year growth 2025-2030 (%)

12.6.5 Turkey - Market size and forecast 2025-2030

Chart on Turkey - Market size and forecast 2025-2030 ($ million)
Data Table on Turkey - Market size and forecast 2025-2030 ($ million)
Chart on Turkey - Year-over-year growth 2025-2030 (%)
Data Table on Turkey - Year-over-year growth 2025-2030 (%)

12.7 South America - Market size and forecast 2025-2030

Chart on South America - Market size and forecast 2025-2030 ($ million)
Data Table on South America - Market size and forecast 2025-2030 ($ million)
Chart on South America - Year-over-year growth 2025-2030 (%)
Data Table on South America - Year-over-year growth 2025-2030 (%)
Chart on Regional Comparison - South America
Data Table on Regional Comparison - South America

12.7.1 Brazil - Market size and forecast 2025-2030

Chart on Brazil - Market size and forecast 2025-2030 ($ million)
Data Table on Brazil - Market size and forecast 2025-2030 ($ million)
Chart on Brazil - Year-over-year growth 2025-2030 (%)
Data Table on Brazil - Year-over-year growth 2025-2030 (%)

12.7.2 Argentina - Market size and forecast 2025-2030

Chart on Argentina - Market size and forecast 2025-2030 ($ million)
Data Table on Argentina - Market size and forecast 2025-2030 ($ million)
Chart on Argentina - Year-over-year growth 2025-2030 (%)
Data Table on Argentina - Year-over-year growth 2025-2030 (%)

12.7.3 Chile - Market size and forecast 2025-2030

Chart on Chile - Market size and forecast 2025-2030 ($ million)
Data Table on Chile - Market size and forecast 2025-2030 ($ million)
Chart on Chile - Year-over-year growth 2025-2030 (%)
Data Table on Chile - Year-over-year growth 2025-2030 (%)

12.8 Market opportunity by geography

Market opportunity by geography ($ million)
Data Tables on Market opportunity by geography ($ million)

13. Drivers, Challenges, and Opportunity

13.1 Market drivers

Accelerated grid modernization and renewable energy integration
Rising demand for real-time asset management
Technological advancements in cloud computing and automated spatial analytics

13.2 Market challenges

High capital expenditure and complex integration costs
Data interoperability issues and complex legacy system migration
Cybersecurity vulnerabilities and data privacy risks in critical infrastructure

13.3 Impact of drivers and challenges

Impact of drivers and challenges in 2025 and 2030

13.4 Market opportunities

Integration of AI and automated geo AI processing
Transition toward cloud-native architectures and real-time digital twins
Convergence of enterprise spatial intelligence with smart grid

14. Competitive Landscape

14.1 Overview

14.2

Overview on criticality of inputs and factors of differentiation

14.3 Landscape disruption

Overview on factors of disruption

14.4 Industry risks

Impact of key risks on business

15. Competitive Analysis

15.1 Companies profiled

Companies covered

15.2 Company ranking index

15.3 Market positioning of companies

Matrix on companies position and classification

15.4 Autodesk Inc.

Autodesk Inc. - Overview
Autodesk Inc. - Business segments
Autodesk Inc. - Key offerings
Autodesk Inc. - Segment focus
SWOT

15.5 Bentley Systems Inc.

Bentley Systems Inc. - Overview
Bentley Systems Inc. - Business segments
Bentley Systems Inc. - Key news
Bentley Systems Inc. - Key offerings
Bentley Systems Inc. - Segment focus
SWOT

15.6 Caliper Corp.

Caliper Corp. - Overview
Caliper Corp. - Product / Service
Caliper Corp. - Key offerings
SWOT

15.7 Epoch Solutions Group Inc.

Epoch Solutions Group Inc. - Overview
Epoch Solutions Group Inc. - Product / Service
Epoch Solutions Group Inc. - Key offerings
SWOT

15.8 Esri Inc.

Esri Inc. - Overview
Esri Inc. - Product / Service
Esri Inc. - Key offerings
SWOT

15.9 GE Vernova Inc.

GE Vernova Inc. - Overview
GE Vernova Inc. - Business segments
GE Vernova Inc. - Key offerings
GE Vernova Inc. - Segment focus
SWOT

15.10 GeoConcept SAS

GeoConcept SAS - Overview
GeoConcept SAS - Product / Service
GeoConcept SAS - Key offerings
SWOT

15.11 HERE Technologies

HERE Technologies - Overview
HERE Technologies - Product / Service
HERE Technologies - Key offerings
SWOT

15.12 Hexagon AB

Hexagon AB - Overview
Hexagon AB - Business segments
Hexagon AB - Key news
Hexagon AB - Key offerings
Hexagon AB - Segment focus
SWOT

15.13 L3Harris Technologies Inc.

L3Harris Technologies Inc. - Overview
L3Harris Technologies Inc. - Business segments
L3Harris Technologies Inc. - Key offerings
L3Harris Technologies Inc. - Segment focus
SWOT

15.14 Latapult Inc

Latapult Inc - Overview
Latapult Inc - Product / Service
Latapult Inc - Key offerings
SWOT

15.15 mPower Innovations Ltd.

mPower Innovations Ltd. - Overview
mPower Innovations Ltd. - Product / Service
mPower Innovations Ltd. - Key offerings
SWOT

15.16 Pitney Bowes Inc.

Pitney Bowes Inc. - Overview
Pitney Bowes Inc. - Business segments
Pitney Bowes Inc. - Key offerings
Pitney Bowes Inc. - Segment focus
SWOT

15.17 TomTom NV

TomTom NV - Overview
TomTom NV - Business segments
TomTom NV - Key offerings
TomTom NV - Segment focus
SWOT

15.18 Trimble Inc.

Trimble Inc. - Overview
Trimble Inc. - Business segments
Trimble Inc. - Key news
Trimble Inc. - Key offerings
Trimble Inc. - Segment focus
SWOT

16. Appendix

16.1 Scope of the report

Market definition
Objectives
Notes and caveats

16.2 Inclusions and exclusions checklist

Inclusions checklist
Exclusions checklist

16.3 Currency conversion rates for US$

16.4 Research methodology

16.5 Data procurement

Information sources

16.6 Data validation

16.7 Validation techniques employed for market sizing

16.8 Data synthesis

16.9 360 degree market analysis

16.10 List of abbreviations

Research Methodology

Technavio presents a detailed picture of the market by way of study, synthesis, and summation of data from multiple sources. The analysts have presented the various facets of the market with a particular focus on identifying the key industry influencers. The data thus presented is comprehensive, reliable, and the result of extensive research, both primary and secondary.

INFORMATION SOURCES

Primary sources

  • Manufacturers and suppliers
  • Channel partners
  • Industry experts
  • Strategic decision makers

Secondary sources

  • Industry journals and periodicals
  • Government data
  • Financial reports of key industry players
  • Historical data
  • Press releases

DATA ANALYSIS

Data Synthesis

  • Collation of data
  • Estimation of key figures
  • Analysis of derived insights

Data Validation

  • Triangulation with data models
  • Reference against proprietary databases
  • Corroboration with industry experts

REPORT WRITING

Qualitative

  • Market drivers
  • Market challenges
  • Market trends
  • Five forces analysis

Quantitative

  • Market size and forecast
  • Market segmentation
  • Geographical insights
  • Competitive landscape

Interested in this report?

Get your sample now to see our research methodology and insights!

Download Now

Frequently Asked Questions

Gis In Utility Industry market growth will increase by USD 4492.7 million during 2026-2030.

The Gis In Utility Industry market is expected to grow at a CAGR of 21% during 2026-2030.

Gis In Utility Industry market is segmented by Product (Software, Data, Services) Deployment (On-premises, Cloud) Application (Asset management, Network management, Grid planning and optimization, Outage management, Others)

Autodesk Inc., Bentley Systems Inc., Caliper Corp., CartoDB Inc., Epoch Solutions Group Inc., Esri Inc., Futura Systems Inc., GE Vernova Inc., GeoConcept SAS, HERE Technologies, Hexagon AB, L3Harris Technologies Inc., Latapult Inc, Mapbox Inc., mPower Innovations Ltd., Pitney Bowes Inc., Precisely Software Inc, TomTom NV, Trimble Inc., VertiGIS Ltd. are a few of the key vendors in the Gis In Utility Industry market.

North America will register the highest growth rate of 32.9% among the other regions. Therefore, the Gis In Utility Industry market in North America is expected to garner significant business opportunities for the vendors during the forecast period.

US, Canada, Mexico, Germany, UK, France, Italy, Spain, The Netherlands, China, India, Japan, Australia, South Korea, Indonesia, Saudi Arabia, UAE, South Africa, Egypt, Turkey, Brazil, Argentina, Chile

  • Accelerated grid modernization and renewable energy integration is the driving factor this market.

The Gis In Utility Industry market vendors should focus on grabbing business opportunities from the Product segment as it accounted for the largest market share in the base year.
RIA - Research AI Assistant
Ask RIA
