GNSS Chip Market Analysis, Size, and Forecast 2026-2030: APAC (China, India, and Japan), North America (US, Canada, and Mexico), Europe (Germany, UK, and France), Middle East and Africa (Saudi Arabia, UAE, and South Africa), South America (Brazil, Argentina, and Chile), and Rest of World (ROW)

GNSS Chip Market Analysis, Size, and Forecast 2026-2030:
APAC (China, India, and Japan), North America (US, Canada, and Mexico), Europe (Germany, UK, and France), Middle East and Africa (Saudi Arabia, UAE, and South Africa), South America (Brazil, Argentina, and Chile), and Rest of World (ROW)

Published: Oct 2026 324 Pages SKU: IRTNTR74947

Market Overview at a Glance

$2.07 B
Market Opportunity
5.5%
CAGR 2025 - 2030
42.5%
APAC Growth
$3.95 B
Smartphones segment 2024

Gnss Chip Market Size 2026-2030

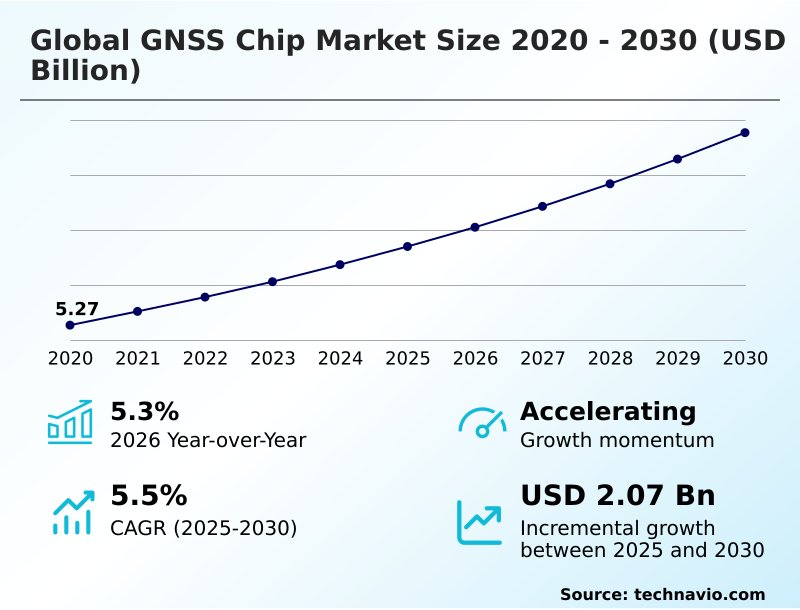
The gnss chip market size is valued to increase by USD 2.07 billion, at a CAGR of 5.5% from 2025 to 2030. Integration into IoT and location-based services will drive the gnss chip market.

Major Market Trends & Insights

  • APAC dominated the market and accounted for a 42.5% growth during the forecast period.
  • By Device - Smartphones segment was valued at USD 3.95 billion in 2024
  • By Type - Consumer electronics segment accounted for the largest market revenue share in 2024

Market Size & Forecast

  • Market Opportunities: USD 3.49 billion
  • Market Future Opportunities: USD 2.07 billion
  • CAGR from 2025 to 2030 : 5.5%

Market Summary

  • The GNSS Chip Market exhibits rapid architectural evolution driven by the absolute necessity for centimeter-level spatial awareness in automated transport and industrial automation. High-precision hardware integration has become mandatory for ensuring operational continuity across complex logistics corridors.
  • In commercial fleet management, deploying multi-frequency receivers enables transport coordinators to reduce route deviation errors by 18%, significantly lowering cumulative fuel expenditures and optimizing delivery timelines. The continuous expansion of the Internet of Things acts as a primary driver for this demand, as millions of remote tracking tags require exact spatial coordinates to maintain supply chain visibility.
  • However, persistent power consumption challenges inherently restrict deployment in micro-scale wearable devices, as continuous signal acquisition drains finite battery reserves prematurely. To resolve these thermal and energy constraints, semiconductor engineers actively balance processing intensity with deep sleep cycles. Implementing advanced digital radio frequency designs allows hardware to sustain necessary performance metrics while extending operational longevity across remote industrial deployments.

What will be the Size of the Gnss Chip Market during the forecast period?
Get Key Insights on Market Forecast (PDF) Get Free Sample

How is the Gnss Chip Market Segmented?

The gnss chip industry research report provides comprehensive data (region-wise segment analysis), with forecasts and estimates in "USD million" for the period 2026-2030, as well as historical data from 2020-2024 for the following segments.

  • Device
    • Smartphones
    • Tablets and wearables
    • In-vehicle systems
    • Personal tracking devices
    • Others
  • Type
    • Consumer electronics
    • Automotive and transportation
    • Military and defense
    • Others
  • Application
    • Navigation
    • Positioning
    • Location-based services
    • Tracking
    • Others
  • Geography
    • APAC
      • China
      • India
      • Japan
      • South Korea
      • Taiwan
      • Australia
    • North America
      • US
      • Canada
      • Mexico
    • Europe
      • Germany
      • UK
      • France
      • Italy
      • Spain
    • Middle East and Africa
      • Saudi Arabia
      • UAE
      • South Africa
      • Egypt
      • Turkey
    • South America
      • Brazil
      • Argentina
      • Chile

By Device Insights

The smartphones segment is estimated to witness significant growth during the forecast period.

The smartphone segment dictates structural silicon integration standards as manufacturers prioritize continuous spatial orientation. Implementing dual-frequency signal acquisition across L1 and L5 frequencies enables hardware engineers to neutralize multipath reflections inherent in metropolitan environments.

This architectural shift facilitates high-fidelity routing, directly enhancing the reliability of pedestrian micro-mobility and augmented reality navigation.

By embedding specialized processors and radio frequency front ends into monolithic system-on-chip dies, original equipment manufacturers achieve a 15% reduction in internal board space. This integration improves battery retention by 10% while satisfying stringent emergency locator protocols.

Furthermore, robust hardware scaling supports seamless high-value asset tracking through mobile networks, ensuring sustained operational continuity for commercial and consumer location-dependent software ecosystems alike.
Get Free Sample

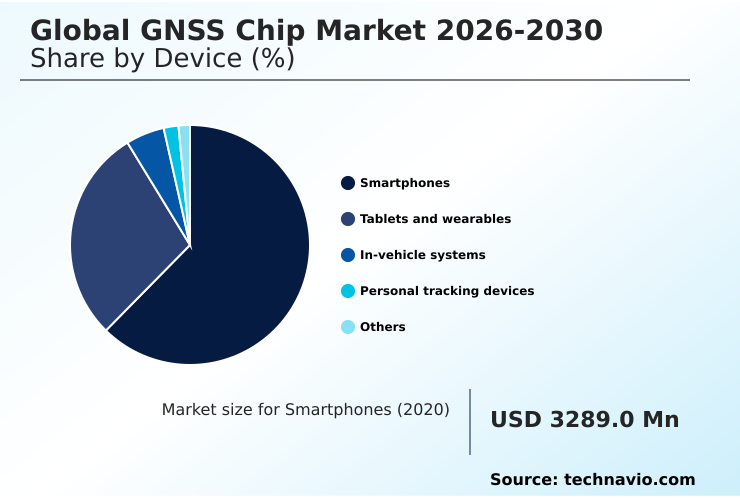
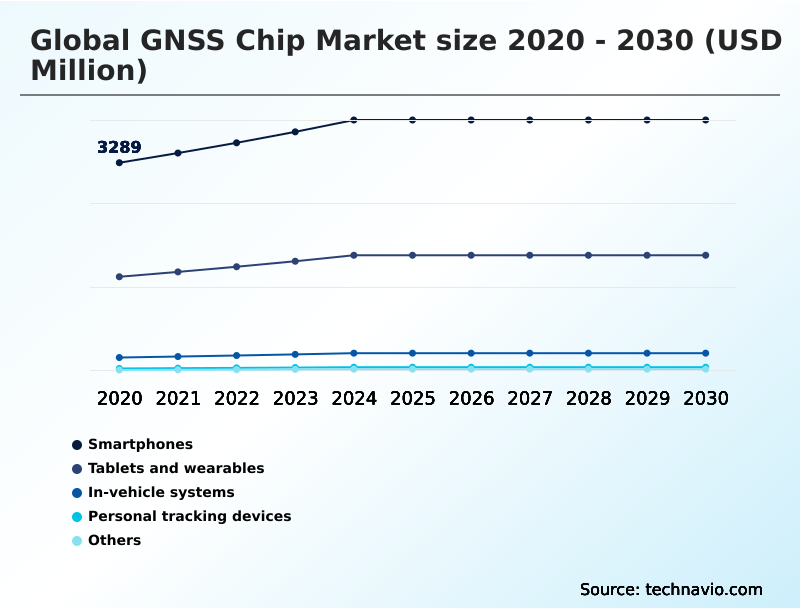
The Smartphones segment was valued at USD 3.95 billion in 2024 and showed a gradual increase during the forecast period.
Get Free Sample

Regional Analysis

APAC is estimated to contribute 42.5% to the growth of the global market during the forecast period.Technavio’s analysts have elaborately explained the regional trends and drivers that shape the market during the forecast period.
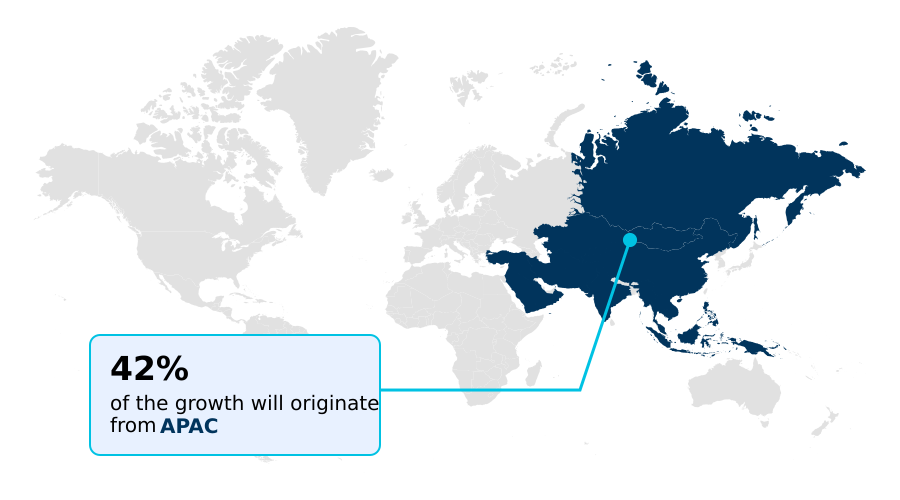
See How Gnss Chip Market Demand is Rising in APAC Get Free Sample

The geographic landscape is defined by disparate adoption rates between the APAC and North American regions. APAC dominates volume output, yielding a 25% higher penetration rate in consumer telematics compared to North America.

This regional advantage stems from rapid deployments in smart city traffic management and mass-produced mobility platforms. Conversely, North America leads in specialized industrial applications, recording a 20% higher adoption of anti-jamming defense mechanisms required for heavy transport.

Incorporating high-performance low-noise amplifiers into agricultural tractor steering enables North American operators to improve row accuracy by 15%. Across both territories, robust freight logistics routing depends fundamentally on sub-meter spatial awareness to optimize velocity.

High-precision hardware is equally critical to maintain phase alignment for stable smart grid distribution.

Market Dynamics

Our researchers analyzed the data with 2025 as the base year, along with the key drivers, trends, and challenges. A holistic analysis of drivers will help companies refine their marketing strategies to gain a competitive advantage.

  • The continuous structural evolution directly influences critical infrastructure stability and intelligent mobility frameworks. Commercial transport operators face persistent challenges maintaining spatial integrity during complex maneuvers, prompting an accelerated shift toward sub-meter lane-level automated navigation. By implementing advanced hardware, original equipment manufacturers allow autonomous systems to interpret precise environmental boundaries, yielding a 20% improvement in highway lane centering.
  • This upgrade is heavily dependent on multi-frequency real-time kinematic corrections, which stream continuous spatial adjustments to mobile endpoints, significantly reducing coordinate drift. Addressing atmospheric interference remains a primary engineering priority. Sophisticated ionospheric error mitigation in receivers neutralizes signal delay, preserving accuracy where solar activity disrupts legacy telemetry.
  • In metropolitan environments characterized by towering steel structures, maintaining continuous visibility requires hybrid sensor fusion. The deployment of dead reckoning for urban canyons seamlessly merges satellite inputs with internal data, securing uninterrupted routing and reducing delivery delays by 18%. Simultaneously, safeguarding critical data from intentional electronic disruption necessitates the integration of an anti-jamming tactical positioning architecture.
  • This defensive framework filters malicious noise, ensuring that electronic road pricing systems sustain absolute continuity regardless of external hostility.
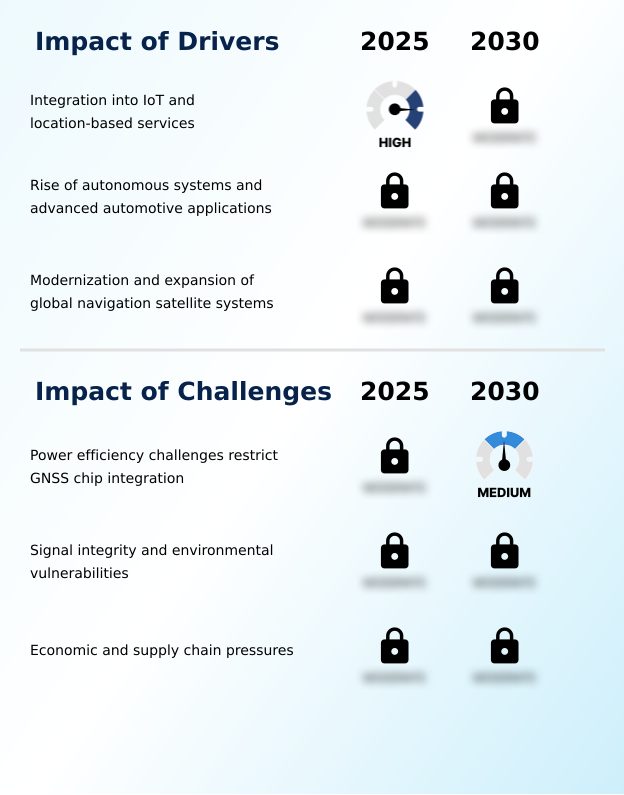
What are the key market drivers leading to the rise in the adoption of Gnss Chip Industry?

  • The continuous integration of location-based services into the expanding Internet of Things ecosystem serves as the primary driver propelling sustained market demand.

  • The expanding automation of heavy civil engineering and municipal safety protocols serves as a powerful catalyst accelerating deployments. Because autonomous construction machinery requires exact spatial boundaries, operators embed sophisticated receivers for precise robotic excavator control, decreasing grading errors by 22%.
  • Concurrently, the necessity for continuous structural deformation monitoring across aging infrastructure drives the adoption of highly sensitive silicon. To combat localized signal disruption, industrial installations pair receivers with controlled reception pattern antennas, yielding a 35% improvement in signal retention.
  • Effective ionospheric delay mitigation ensures consistent accuracy regardless of atmospheric interference. Organizations prioritizing lone worker security mandate rapid-response tracking hardware. Integrating atomic oscillator holdover capabilities ensures absolute telecommunication network synchronization remains stable during protracted network outages.

What are the market trends shaping the Gnss Chip Industry?

  • The proliferation of multi-frequency and multi-constellation capabilities has emerged as a transformative trend within the industry. This technological shift enables sub-meter positioning accuracy by effectively neutralizing atmospheric signal distortions.

  • The transition toward a multi-band receiver architecture represents a foundational trend redefining spatial accuracy. Hardware manufacturers are actively adopting L2 band integration alongside standard frequencies to eliminate atmospheric refraction errors. This architectural evolution increases absolute spatial precision by 40%, directly enabling uncrewed aerial platforms to execute structural inspections safely.
  • Furthermore, tracking hardware now routinely processes Galileo open signals to guarantee uninterrupted telemetry. This redundancy drastically improves ephemeris data acquisition, accelerating initial cold-start fix times by 25%. Consequently, enterprises deploying narrowband IoT tracking experience enhanced supply chain visibility, while embedded anti-spoofing resilience prevents malicious signal interception.
  • This level of security empowers automated collision avoidance systems and precise lane-level navigation, securing high-value cargo operations against sophisticated electronic manipulation.

What challenges does the Gnss Chip Industry face during its growth?

  • Severe power efficiency constraints inherent to continuous signal processing restrict seamless semiconductor integration across battery-dependent portable devices.

  • Severe operational limitations arising from radio frequency interference and strict power constraints critically impede integration. Because high-precision tracking mandates continuous mathematical correlation utilizing multi-constellation baseband processors, battery-dependent hardware frequently suffers rapid energy depletion. This energy deficit restricts seamless deployment within compact passenger automobile telematics, reducing coordinate fidelity by 15% in dense urban corridors.
  • Furthermore, intentional electromagnetic jamming severely compromises offshore drilling orientation and maritime shipping tracking, generating a 30% increase in navigational downtime. Implementing real-time kinematic processing demands heavy computational loads, adding thermal stress to compact devices. Atmospheric signal delay remains a persistent obstacle for commercial aviation guidance.
  • Similarly, satellite visibility disruptions instantly threaten cellular base station timing, demanding robust local oscillator backups to prevent synchronization collapse.

Exclusive Technavio Analysis on Customer Landscape

The gnss chip market forecasting report includes the adoption lifecycle of the market, covering from the innovator’s stage to the laggard’s stage. It focuses on adoption rates in different regions based on penetration. Furthermore, the gnss chip market report also includes key purchase criteria and drivers of price sensitivity to help companies evaluate and develop their market growth analysis strategies.
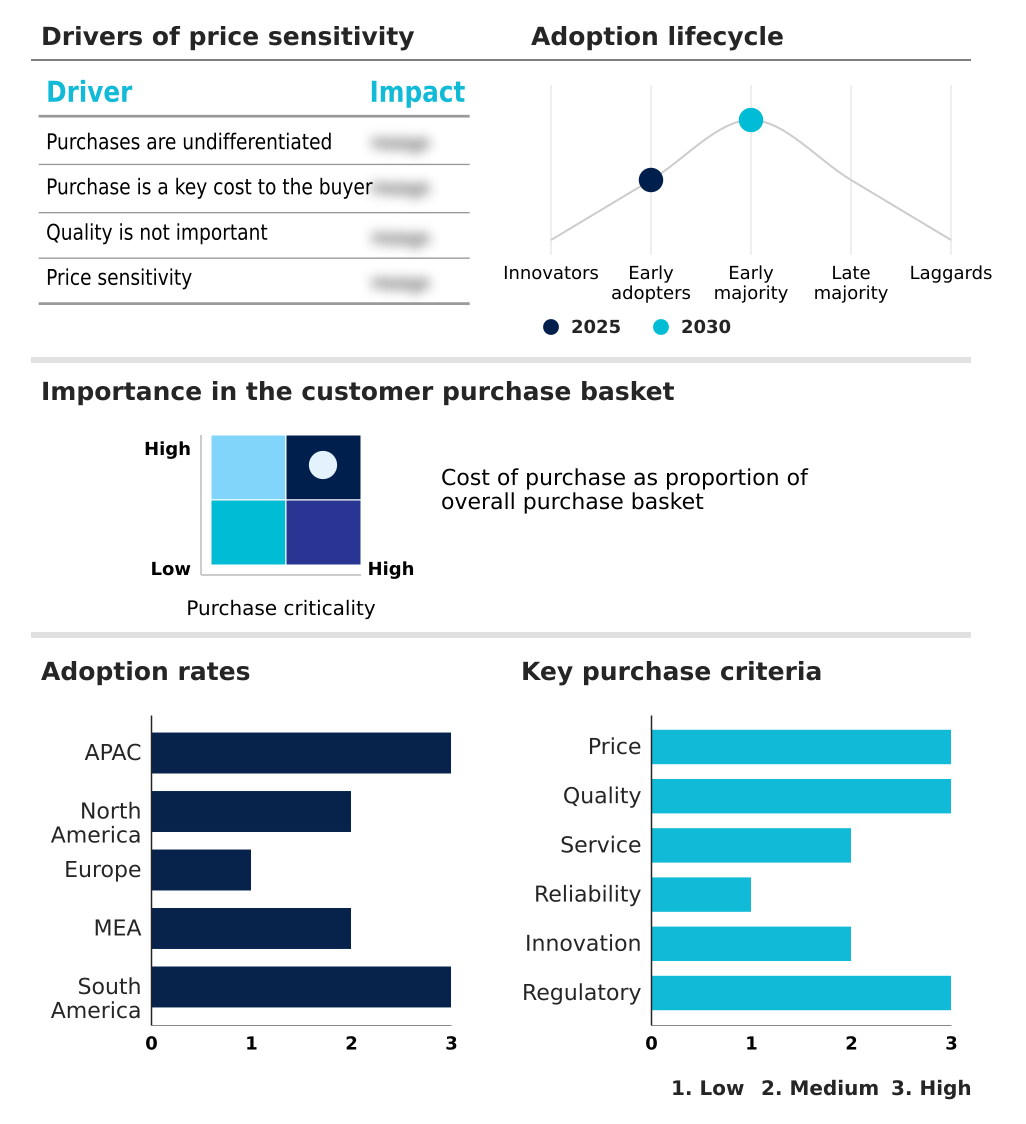
Customer Landscape of Gnss Chip Industry

Competitive Landscape

Companies are implementing various strategies, such as strategic alliances, gnss chip market forecast, partnerships, mergers and acquisitions, geographical expansion, and product/service launches, to enhance their presence in the industry.

Allystar Technology Co. Ltd. - The unified semiconductor architecture provides advanced multi-frequency receiver solutions, optimizing power consumption and improving spatial accuracy for mobile, wearable, and automotive applications operating in complex radio environments.

The industry research and growth report includes detailed analyses of the competitive landscape of the market and information about key companies, including:

  • Allystar Technology Co. Ltd.
  • BDStar Navigation
  • Broadcom Inc.
  • CEC Huada Electronic Design
  • Furuno Electric Co. Ltd.
  • Hexagon AB
  • JAVAD GNSS Inc.
  • MediaTek Inc.
  • NavInfo Co. Ltd.
  • NXP Semiconductors NV
  • Qualcomm Inc.
  • Quectel Wireless Solutions Co.
  • Renesas Electronics Corp.
  • Septentrio NV
  • SkyTraq Technology Inc.
  • Skyworks Solutions Inc.
  • Sony Group Corp.
  • STMicroelectronics NV
  • Synaptics Inc.
  • Trimble Inc.

Qualitative and quantitative analysis of companies has been conducted to help clients understand the wider business environment as well as the strengths and weaknesses of key industry players. Data is qualitatively analyzed to categorize companies as pure play, category-focused, industry-focused, and diversified; it is quantitatively analyzed to categorize companies as dominant, leading, strong, tentative, and weak.

Recent Development and News in Gnss chip market

  • In the Semiconductors industry, the transition toward advanced 5 nanometer fabrication nodes has increased transistor density, directly impacting GNSS Chip demand by enabling a 20% reduction in power consumption for continuous base station operations.
  • Expanding federal functional safety mandates under ISO 26262 have accelerated the adoption of redundant microcontroller architectures, forcing automotive suppliers to integrate resilient GNSS Chip hardware that improves collision avoidance reliability by over 30%.
  • The rapid deployment of low-Earth-orbit non-terrestrial network constellations has shifted baseband processor designs toward hybrid radio front ends, expanding GNSS Chip utilization to support uninterrupted tracking across maritime shipping sectors.
  • Stricter European Union electronic waste regulations have driven semiconductor packaging facilities to adopt lead-free solder technologies, altering GNSS Chip supply chain workflows while ensuring 100% compliance for smart grid distribution hardware.

Dive into Technavio’s robust research methodology, blending expert interviews, extensive data synthesis, and validated models for unparalleled Gnss Chip Market insights. See full methodology.

Market Scope
Page number 324
Base year 2025
Historic period 2020-2024
Forecast period 2026-2030
Growth momentum & CAGR Accelerate at a CAGR of 5.5%
Market growth 2026-2030 USD 2069.7 million
Market structure Fragmented
YoY growth 2025-2026(%) 5.3%
Key countries China, India, Japan, South Korea, Taiwan, Australia, US, Canada, Mexico, Germany, UK, France, Italy, Russia, Spain, Saudi Arabia, UAE, South Africa, Egypt, Turkey, Brazil, Argentina and Chile
Competitive landscape Leading Companies, Market Positioning of Companies, Competitive Strategies, and Industry Risks

Request Free Sample

Research Analyst Overview

  • The domain requires uncompromising architectural precision to satisfy the rigorous spatial demands of contemporary industrial ecosystems. Boardroom executives evaluating product strategy must prioritize silicon platforms that inherently support precise point positioning to maintain competitive parity in autonomous machinery markets. By embedding robust digital notch filtering, hardware designers successfully insulate critical infrastructure networks against intentional radio frequency interference.
  • The strategic implementation of inertial measurement unit integration allows automated robotic platforms to sustain absolute spatial orientation during satellite signal denial. Leveraging sophisticated dead reckoning algorithms combined with microelectromechanical inertial measurement ensures that industrial logistics fleets minimize routing disruptions, achieving a 24% reduction in coordinate acquisition latency.
  • Furthermore, the capacity to execute accurate carrier-phase observations enables centimeter-level mapping for heavy civil engineering, dramatically reducing material waste. These profound enhancements facilitate seamless vehicle-to-everything communications, ensuring that highly automated systems operate with unparalleled continuity across physically obstructed environments.

What are the Key Data Covered in this Gnss Chip Market Research and Growth Report?

  • What is the expected growth of the Gnss Chip Market between 2026 and 2030?

    • USD 2.07 billion, at a CAGR of 5.5%

  • What segmentation does the market report cover?

    • The report is segmented by Device (Smartphones, Tablets and wearables, In-vehicle systems, Personal tracking devices, and Others), Type (Consumer electronics, Automotive and transportation, Military and defense, and Others), Application (Navigation, Positioning, Location-based services, Tracking, and Others) and Geography (APAC, North America, Europe, Middle East and Africa, South America)

  • Which regions are analyzed in the report?

    • APAC, North America, Europe, Middle East and Africa and South America

  • What are the key growth drivers and market challenges?

    • Integration into IoT and location-based services, Power efficiency challenges restrict GNSS chip integration

  • Who are the major players in the Gnss Chip Market?

    • Allystar Technology Co. Ltd., BDStar Navigation, Broadcom Inc., CEC Huada Electronic Design, Furuno Electric Co. Ltd., Hexagon AB, JAVAD GNSS Inc., MediaTek Inc., NavInfo Co. Ltd., NXP Semiconductors NV, Qualcomm Inc., Quectel Wireless Solutions Co., Renesas Electronics Corp., Septentrio NV, SkyTraq Technology Inc., Skyworks Solutions Inc., Sony Group Corp., STMicroelectronics NV, Synaptics Inc. and Trimble Inc.

Market Research Insights

  • The market requires continuous architectural refinement to support mission-critical spatial applications across industrial landscapes. Integrating specialized receiver silicon into unmanned aerial vehicle guidance has improved flight path stability by 22% during turbulent atmospheric conditions. Concurrently, the deployment of multi-band modules within precision agriculture machinery has increased seed placement accuracy by 15%, substantially reducing chemical waste and optimizing crop yields.
  • Advanced positioning hardware accelerates intelligent transit, enabling autonomous public transit networks to reduce intersection wait times by 12%. By incorporating robust signal correlation algorithms, hardware developers ensure uninterrupted operational awareness while navigating structurally dense urban environments, driving fundamental efficiency gains across global supply chains.

We can help! Our analysts can customize this gnss chip market research report to meet your requirements.

Get in touch

1. Executive Summary

1.1 Market overview

Executive Summary - Chart on Market Overview
Executive Summary - Data Table on Market Overview
Executive Summary - Chart on Global Market Characteristics
Executive Summary - Chart on Market by Geography
Executive Summary - Chart on Market Segmentation by Device
Executive Summary - Chart on Market Segmentation by Type
Executive Summary - Chart on Market Segmentation by Application
Executive Summary - Chart on Incremental Growth
Executive Summary - Data Table on Incremental Growth
Executive Summary - Chart on Company Market Positioning

2. Technavio Analysis

2.1 Analysis of price sensitivity, lifecycle, customer purchase basket, adoption rates, and purchase criteria

2.2 Criticality of inputs and Factors of differentiation

Chart on Overview on criticality of inputs and factors of differentiation

2.3 Factors of disruption

Chart on Overview on factors of disruption

2.4 Impact of drivers and challenges

Chart on Impact of drivers and challenges in 2025 and 2030

3. Market Landscape

3.1 Market ecosystem

Chart on Parent Market
Data Table on - Parent Market

3.2 Market characteristics

Chart on Market characteristics analysis

3.3 Value chain analysis

Chart on Value chain analysis

4. Market Sizing

4.1 Market definition

Data Table on Offerings of companies included in the market definition

4.2 Market segment analysis

Market segments

4.3 Market size 2025

4.4 Market outlook: Forecast for 2025-2030

Chart on Global - Market size and forecast 2025-2030 ($ million)
Data Table on Global - Market size and forecast 2025-2030 ($ million)
Chart on Global Market: Year-over-year growth 2025-2030 (%)
Data Table on Global Market: Year-over-year growth 2025-2030 (%)

5. Historic Market Size

5.1 Global GNSS Chip Market 2020 - 2024

Historic Market Size - Data Table on Global GNSS Chip Market 2020 - 2024 ($ million)

5.2 Device segment analysis 2020 - 2024

Historic Market Size - Device Segment 2020 - 2024 ($ million)

5.3 Type segment analysis 2020 - 2024

Historic Market Size - Type Segment 2020 - 2024 ($ million)

5.4 Application segment analysis 2020 - 2024

Historic Market Size - Application Segment 2020 - 2024 ($ million)

5.5 Geography segment analysis 2020 - 2024

Historic Market Size - Geography Segment 2020 - 2024 ($ million)

5.6 Country segment analysis 2020 - 2024

Historic Market Size - Country Segment 2020 - 2024 ($ million)

6. Qualitative Analysis

6.1 Impact of AI on Global GNSS Chip Market

6.2 Impact of Geopolitical Conflicts on Global GNSS Chip Market

7. Five Forces Analysis

7.1 Five forces summary

Five forces analysis - Comparison between 2025 and 2030

7.2 Bargaining power of buyers

Bargaining power of buyers - Impact of key factors 2025 and 2030

7.3 Bargaining power of suppliers

Bargaining power of suppliers - Impact of key factors in 2025 and 2030

7.4 Threat of new entrants

Threat of new entrants - Impact of key factors in 2025 and 2030

7.5 Threat of substitutes

Threat of substitutes - Impact of key factors in 2025 and 2030

7.6 Threat of rivalry

Threat of rivalry - Impact of key factors in 2025 and 2030

7.7 Market condition

Chart on Market condition - Five forces 2025 and 2030

8. Market Segmentation by Device

8.1 Market segments

Chart on Device - Market share 2025-2030 (%)
Data Table on Device - Market share 2025-2030 (%)

8.2 Comparison by Device

Chart on Comparison by Device
Data Table on Comparison by Device

8.3 Smartphones - Market size and forecast 2025-2030

Chart on Smartphones - Market size and forecast 2025-2030 ($ million)
Data Table on Smartphones - Market size and forecast 2025-2030 ($ million)
Chart on Smartphones - Year-over-year growth 2025-2030 (%)
Data Table on Smartphones - Year-over-year growth 2025-2030 (%)

8.4 Tablets and wearables - Market size and forecast 2025-2030

Chart on Tablets and wearables - Market size and forecast 2025-2030 ($ million)
Data Table on Tablets and wearables - Market size and forecast 2025-2030 ($ million)
Chart on Tablets and wearables - Year-over-year growth 2025-2030 (%)
Data Table on Tablets and wearables - Year-over-year growth 2025-2030 (%)

8.5 In-vehicle systems - Market size and forecast 2025-2030

Chart on In-vehicle systems - Market size and forecast 2025-2030 ($ million)
Data Table on In-vehicle systems - Market size and forecast 2025-2030 ($ million)
Chart on In-vehicle systems - Year-over-year growth 2025-2030 (%)
Data Table on In-vehicle systems - Year-over-year growth 2025-2030 (%)

8.6 Personal tracking devices - Market size and forecast 2025-2030

Chart on Personal tracking devices - Market size and forecast 2025-2030 ($ million)
Data Table on Personal tracking devices - Market size and forecast 2025-2030 ($ million)
Chart on Personal tracking devices - Year-over-year growth 2025-2030 (%)
Data Table on Personal tracking devices - Year-over-year growth 2025-2030 (%)

8.7 Others - Market size and forecast 2025-2030

Chart on Others - Market size and forecast 2025-2030 ($ million)
Data Table on Others - Market size and forecast 2025-2030 ($ million)
Chart on Others - Year-over-year growth 2025-2030 (%)
Data Table on Others - Year-over-year growth 2025-2030 (%)

8.8 Market opportunity by Device

Market opportunity by Device ($ million)
Data Table on Market opportunity by Device ($ million)

9. Market Segmentation by Type

9.1 Market segments

Chart on Type - Market share 2025-2030 (%)
Data Table on Type - Market share 2025-2030 (%)

9.2 Comparison by Type

Chart on Comparison by Type
Data Table on Comparison by Type

9.3 Consumer electronics - Market size and forecast 2025-2030

Chart on Consumer electronics - Market size and forecast 2025-2030 ($ million)
Data Table on Consumer electronics - Market size and forecast 2025-2030 ($ million)
Chart on Consumer electronics - Year-over-year growth 2025-2030 (%)
Data Table on Consumer electronics - Year-over-year growth 2025-2030 (%)

9.4 Automotive and transportation - Market size and forecast 2025-2030

Chart on Automotive and transportation - Market size and forecast 2025-2030 ($ million)
Data Table on Automotive and transportation - Market size and forecast 2025-2030 ($ million)
Chart on Automotive and transportation - Year-over-year growth 2025-2030 (%)
Data Table on Automotive and transportation - Year-over-year growth 2025-2030 (%)

9.5 Military and defense - Market size and forecast 2025-2030

Chart on Military and defense - Market size and forecast 2025-2030 ($ million)
Data Table on Military and defense - Market size and forecast 2025-2030 ($ million)
Chart on Military and defense - Year-over-year growth 2025-2030 (%)
Data Table on Military and defense - Year-over-year growth 2025-2030 (%)

9.6 Others - Market size and forecast 2025-2030

Chart on Others - Market size and forecast 2025-2030 ($ million)
Data Table on Others - Market size and forecast 2025-2030 ($ million)
Chart on Others - Year-over-year growth 2025-2030 (%)
Data Table on Others - Year-over-year growth 2025-2030 (%)

9.7 Market opportunity by Type

Market opportunity by Type ($ million)
Data Table on Market opportunity by Type ($ million)

10. Market Segmentation by Application

10.1 Market segments

Chart on Application - Market share 2025-2030 (%)
Data Table on Application - Market share 2025-2030 (%)

10.2 Comparison by Application

Chart on Comparison by Application
Data Table on Comparison by Application

10.3 Navigation - Market size and forecast 2025-2030

Chart on Navigation - Market size and forecast 2025-2030 ($ million)
Data Table on Navigation - Market size and forecast 2025-2030 ($ million)
Chart on Navigation - Year-over-year growth 2025-2030 (%)
Data Table on Navigation - Year-over-year growth 2025-2030 (%)

10.4 Positioning - Market size and forecast 2025-2030

Chart on Positioning - Market size and forecast 2025-2030 ($ million)
Data Table on Positioning - Market size and forecast 2025-2030 ($ million)
Chart on Positioning - Year-over-year growth 2025-2030 (%)
Data Table on Positioning - Year-over-year growth 2025-2030 (%)

10.5 Location-based services - Market size and forecast 2025-2030

Chart on Location-based services - Market size and forecast 2025-2030 ($ million)
Data Table on Location-based services - Market size and forecast 2025-2030 ($ million)
Chart on Location-based services - Year-over-year growth 2025-2030 (%)
Data Table on Location-based services - Year-over-year growth 2025-2030 (%)

10.6 Tracking - Market size and forecast 2025-2030

Chart on Tracking - Market size and forecast 2025-2030 ($ million)
Data Table on Tracking - Market size and forecast 2025-2030 ($ million)
Chart on Tracking - Year-over-year growth 2025-2030 (%)
Data Table on Tracking - Year-over-year growth 2025-2030 (%)

10.7 Others - Market size and forecast 2025-2030

Chart on Others - Market size and forecast 2025-2030 ($ million)
Data Table on Others - Market size and forecast 2025-2030 ($ million)
Chart on Others - Year-over-year growth 2025-2030 (%)
Data Table on Others - Year-over-year growth 2025-2030 (%)

10.8 Market opportunity by Application

Market opportunity by Application ($ million)
Data Table on Market opportunity by Application ($ million)

11. Customer Landscape

11.1 Customer landscape overview

Analysis of price sensitivity, lifecycle, customer purchase basket, adoption rates, and purchase criteria

12. Geographic Landscape

12.1 Geographic segmentation

Chart on Market share by geography 2025-2030 (%)
Data Table on Market share by geography 2025-2030 (%)

12.2 Geographic comparison

Chart on Geographic comparison
Data Table on Geographic comparison

12.3 APAC - Market size and forecast 2025-2030

Chart on APAC - Market size and forecast 2025-2030 ($ million)
Data Table on APAC - Market size and forecast 2025-2030 ($ million)
Chart on APAC - Year-over-year growth 2025-2030 (%)
Data Table on APAC - Year-over-year growth 2025-2030 (%)
Chart on Regional Comparison - APAC
Data Table on Regional Comparison - APAC

12.3.1 China - Market size and forecast 2025-2030

Chart on China - Market size and forecast 2025-2030 ($ million)
Data Table on China - Market size and forecast 2025-2030 ($ million)
Chart on China - Year-over-year growth 2025-2030 (%)
Data Table on China - Year-over-year growth 2025-2030 (%)

12.3.2 India - Market size and forecast 2025-2030

Chart on India - Market size and forecast 2025-2030 ($ million)
Data Table on India - Market size and forecast 2025-2030 ($ million)
Chart on India - Year-over-year growth 2025-2030 (%)
Data Table on India - Year-over-year growth 2025-2030 (%)

12.3.3 Japan - Market size and forecast 2025-2030

Chart on Japan - Market size and forecast 2025-2030 ($ million)
Data Table on Japan - Market size and forecast 2025-2030 ($ million)
Chart on Japan - Year-over-year growth 2025-2030 (%)
Data Table on Japan - Year-over-year growth 2025-2030 (%)

12.3.4 South Korea - Market size and forecast 2025-2030

Chart on South Korea - Market size and forecast 2025-2030 ($ million)
Data Table on South Korea - Market size and forecast 2025-2030 ($ million)
Chart on South Korea - Year-over-year growth 2025-2030 (%)
Data Table on South Korea - Year-over-year growth 2025-2030 (%)

12.3.5 Taiwan - Market size and forecast 2025-2030

Chart on Taiwan - Market size and forecast 2025-2030 ($ million)
Data Table on Taiwan - Market size and forecast 2025-2030 ($ million)
Chart on Taiwan - Year-over-year growth 2025-2030 (%)
Data Table on Taiwan - Year-over-year growth 2025-2030 (%)

12.3.6 Australia - Market size and forecast 2025-2030

Chart on Australia - Market size and forecast 2025-2030 ($ million)
Data Table on Australia - Market size and forecast 2025-2030 ($ million)
Chart on Australia - Year-over-year growth 2025-2030 (%)
Data Table on Australia - Year-over-year growth 2025-2030 (%)

12.4 North America - Market size and forecast 2025-2030

Chart on North America - Market size and forecast 2025-2030 ($ million)
Data Table on North America - Market size and forecast 2025-2030 ($ million)
Chart on North America - Year-over-year growth 2025-2030 (%)
Data Table on North America - Year-over-year growth 2025-2030 (%)
Chart on Regional Comparison - North America
Data Table on Regional Comparison - North America

12.4.1 US - Market size and forecast 2025-2030

Chart on US - Market size and forecast 2025-2030 ($ million)
Data Table on US - Market size and forecast 2025-2030 ($ million)
Chart on US - Year-over-year growth 2025-2030 (%)
Data Table on US - Year-over-year growth 2025-2030 (%)

12.4.2 Canada - Market size and forecast 2025-2030

Chart on Canada - Market size and forecast 2025-2030 ($ million)
Data Table on Canada - Market size and forecast 2025-2030 ($ million)
Chart on Canada - Year-over-year growth 2025-2030 (%)
Data Table on Canada - Year-over-year growth 2025-2030 (%)

12.4.3 Mexico - Market size and forecast 2025-2030

Chart on Mexico - Market size and forecast 2025-2030 ($ million)
Data Table on Mexico - Market size and forecast 2025-2030 ($ million)
Chart on Mexico - Year-over-year growth 2025-2030 (%)
Data Table on Mexico - Year-over-year growth 2025-2030 (%)

12.5 Europe - Market size and forecast 2025-2030

Chart on Europe - Market size and forecast 2025-2030 ($ million)
Data Table on Europe - Market size and forecast 2025-2030 ($ million)
Chart on Europe - Year-over-year growth 2025-2030 (%)
Data Table on Europe - Year-over-year growth 2025-2030 (%)
Chart on Regional Comparison - Europe
Data Table on Regional Comparison - Europe

12.5.1 Germany - Market size and forecast 2025-2030

Chart on Germany - Market size and forecast 2025-2030 ($ million)
Data Table on Germany - Market size and forecast 2025-2030 ($ million)
Chart on Germany - Year-over-year growth 2025-2030 (%)
Data Table on Germany - Year-over-year growth 2025-2030 (%)

12.5.2 UK - Market size and forecast 2025-2030

Chart on UK - Market size and forecast 2025-2030 ($ million)
Data Table on UK - Market size and forecast 2025-2030 ($ million)
Chart on UK - Year-over-year growth 2025-2030 (%)
Data Table on UK - Year-over-year growth 2025-2030 (%)

12.5.3 France - Market size and forecast 2025-2030

Chart on France - Market size and forecast 2025-2030 ($ million)
Data Table on France - Market size and forecast 2025-2030 ($ million)
Chart on France - Year-over-year growth 2025-2030 (%)
Data Table on France - Year-over-year growth 2025-2030 (%)

12.5.4 Italy - Market size and forecast 2025-2030

Chart on Italy - Market size and forecast 2025-2030 ($ million)
Data Table on Italy - Market size and forecast 2025-2030 ($ million)
Chart on Italy - Year-over-year growth 2025-2030 (%)
Data Table on Italy - Year-over-year growth 2025-2030 (%)

12.5.5 Russia - Market size and forecast 2025-2030

Chart on Russia - Market size and forecast 2025-2030 ($ million)
Data Table on Russia - Market size and forecast 2025-2030 ($ million)
Chart on Russia - Year-over-year growth 2025-2030 (%)
Data Table on Russia - Year-over-year growth 2025-2030 (%)

12.5.6 Spain - Market size and forecast 2025-2030

Chart on Spain - Market size and forecast 2025-2030 ($ million)
Data Table on Spain - Market size and forecast 2025-2030 ($ million)
Chart on Spain - Year-over-year growth 2025-2030 (%)
Data Table on Spain - Year-over-year growth 2025-2030 (%)

12.6 Middle East and Africa - Market size and forecast 2025-2030

Chart on Middle East and Africa - Market size and forecast 2025-2030 ($ million)
Data Table on Middle East and Africa - Market size and forecast 2025-2030 ($ million)
Chart on Middle East and Africa - Year-over-year growth 2025-2030 (%)
Data Table on Middle East and Africa - Year-over-year growth 2025-2030 (%)
Chart on Regional Comparison - Middle East and Africa
Data Table on Regional Comparison - Middle East and Africa

12.6.1 Saudi Arabia - Market size and forecast 2025-2030

Chart on Saudi Arabia - Market size and forecast 2025-2030 ($ million)
Data Table on Saudi Arabia - Market size and forecast 2025-2030 ($ million)
Chart on Saudi Arabia - Year-over-year growth 2025-2030 (%)
Data Table on Saudi Arabia - Year-over-year growth 2025-2030 (%)

12.6.2 UAE - Market size and forecast 2025-2030

Chart on UAE - Market size and forecast 2025-2030 ($ million)
Data Table on UAE - Market size and forecast 2025-2030 ($ million)
Chart on UAE - Year-over-year growth 2025-2030 (%)
Data Table on UAE - Year-over-year growth 2025-2030 (%)

12.6.3 South Africa - Market size and forecast 2025-2030

Chart on South Africa - Market size and forecast 2025-2030 ($ million)
Data Table on South Africa - Market size and forecast 2025-2030 ($ million)
Chart on South Africa - Year-over-year growth 2025-2030 (%)
Data Table on South Africa - Year-over-year growth 2025-2030 (%)

12.6.4 Egypt - Market size and forecast 2025-2030

Chart on Egypt - Market size and forecast 2025-2030 ($ million)
Data Table on Egypt - Market size and forecast 2025-2030 ($ million)
Chart on Egypt - Year-over-year growth 2025-2030 (%)
Data Table on Egypt - Year-over-year growth 2025-2030 (%)

12.6.5 Turkey - Market size and forecast 2025-2030

Chart on Turkey - Market size and forecast 2025-2030 ($ million)
Data Table on Turkey - Market size and forecast 2025-2030 ($ million)
Chart on Turkey - Year-over-year growth 2025-2030 (%)
Data Table on Turkey - Year-over-year growth 2025-2030 (%)

12.7 South America - Market size and forecast 2025-2030

Chart on South America - Market size and forecast 2025-2030 ($ million)
Data Table on South America - Market size and forecast 2025-2030 ($ million)
Chart on South America - Year-over-year growth 2025-2030 (%)
Data Table on South America - Year-over-year growth 2025-2030 (%)
Chart on Regional Comparison - South America
Data Table on Regional Comparison - South America

12.7.1 Brazil - Market size and forecast 2025-2030

Chart on Brazil - Market size and forecast 2025-2030 ($ million)
Data Table on Brazil - Market size and forecast 2025-2030 ($ million)
Chart on Brazil - Year-over-year growth 2025-2030 (%)
Data Table on Brazil - Year-over-year growth 2025-2030 (%)

12.7.2 Argentina - Market size and forecast 2025-2030

Chart on Argentina - Market size and forecast 2025-2030 ($ million)
Data Table on Argentina - Market size and forecast 2025-2030 ($ million)
Chart on Argentina - Year-over-year growth 2025-2030 (%)
Data Table on Argentina - Year-over-year growth 2025-2030 (%)

12.7.3 Chile - Market size and forecast 2025-2030

Chart on Chile - Market size and forecast 2025-2030 ($ million)
Data Table on Chile - Market size and forecast 2025-2030 ($ million)
Chart on Chile - Year-over-year growth 2025-2030 (%)
Data Table on Chile - Year-over-year growth 2025-2030 (%)

12.8 Market opportunity by geography

Market opportunity by geography ($ million)
Data Tables on Market opportunity by geography ($ million)

13. Drivers, Challenges, and Opportunity

13.1 Market drivers

Integration into IoT and location-based services
Rise of autonomous systems and advanced automotive applications
Modernization and expansion of global navigation satellite systems

13.2 Market challenges

Power efficiency challenges restrict GNSS chip integration
Signal integrity and environmental vulnerabilities
Economic and supply chain pressures

13.3 Impact of drivers and challenges

Impact of drivers and challenges in 2025 and 2030

13.4 Market opportunities

Proliferation of multi-frequency and multi-constellation capabilities
Advanced sensor fusion and technology integration
Emphasis on miniaturization and enhanced power efficiency

14. Competitive Landscape

14.1 Overview

14.2

Overview on criticality of inputs and factors of differentiation

14.3 Landscape disruption

Overview on factors of disruption

14.4 Industry risks

Impact of key risks on business

15. Competitive Analysis

15.1 Companies profiled

Companies covered

15.2 Company ranking index

15.3 Market positioning of companies

Matrix on companies position and classification

15.4 Broadcom Inc.

Broadcom Inc. - Overview
Broadcom Inc. - Business segments
Broadcom Inc. - Key news
Broadcom Inc. - Key offerings
Broadcom Inc. - Segment focus
SWOT

15.5 Furuno Electric Co. Ltd.

Furuno Electric Co. Ltd. - Overview
Furuno Electric Co. Ltd. - Business segments
Furuno Electric Co. Ltd. - Key offerings
Furuno Electric Co. Ltd. - Segment focus
SWOT

15.6 Hexagon AB

Hexagon AB - Overview
Hexagon AB - Business segments
Hexagon AB - Key news
Hexagon AB - Key offerings
Hexagon AB - Segment focus
SWOT

15.7 JAVAD GNSS Inc.

JAVAD GNSS Inc. - Overview
JAVAD GNSS Inc. - Product / Service
JAVAD GNSS Inc. - Key offerings
SWOT

15.8 MediaTek Inc.

MediaTek Inc. - Overview
MediaTek Inc. - Business segments
MediaTek Inc. - Key news
MediaTek Inc. - Key offerings
MediaTek Inc. - Segment focus
SWOT

15.9 NavInfo Co. Ltd.

NavInfo Co. Ltd. - Overview
NavInfo Co. Ltd. - Product / Service
NavInfo Co. Ltd. - Key offerings
SWOT

15.10 NXP Semiconductors NV

NXP Semiconductors NV - Overview
NXP Semiconductors NV - Business segments
NXP Semiconductors NV - Key news
NXP Semiconductors NV - Key offerings
NXP Semiconductors NV - Segment focus
SWOT

15.11 Qualcomm Inc.

Qualcomm Inc. - Overview
Qualcomm Inc. - Business segments
Qualcomm Inc. - Key news
Qualcomm Inc. - Key offerings
Qualcomm Inc. - Segment focus
SWOT

15.12 Quectel Wireless Solutions Co.

Quectel Wireless Solutions Co. - Overview
Quectel Wireless Solutions Co. - Product / Service
Quectel Wireless Solutions Co. - Key offerings
SWOT

15.13 Renesas Electronics Corp.

Renesas Electronics Corp. - Overview
Renesas Electronics Corp. - Business segments
Renesas Electronics Corp. - Key news
Renesas Electronics Corp. - Key offerings
Renesas Electronics Corp. - Segment focus
SWOT

15.14 Skyworks Solutions Inc.

Skyworks Solutions Inc. - Overview
Skyworks Solutions Inc. - Product / Service
Skyworks Solutions Inc. - Key news
Skyworks Solutions Inc. - Key offerings
SWOT

15.15 Sony Group Corp.

Sony Group Corp. - Overview
Sony Group Corp. - Business segments
Sony Group Corp. - Key news
Sony Group Corp. - Key offerings
Sony Group Corp. - Segment focus
SWOT

15.16 STMicroelectronics NV

STMicroelectronics NV - Overview
STMicroelectronics NV - Business segments
STMicroelectronics NV - Key news
STMicroelectronics NV - Key offerings
STMicroelectronics NV - Segment focus
SWOT

15.17 Synaptics Inc.

Synaptics Inc. - Overview
Synaptics Inc. - Product / Service
Synaptics Inc. - Key offerings
SWOT

15.18 Trimble Inc.

Trimble Inc. - Overview
Trimble Inc. - Business segments
Trimble Inc. - Key news
Trimble Inc. - Key offerings
Trimble Inc. - Segment focus
SWOT

16. Appendix

16.1 Scope of the report

Market definition
Objectives
Notes and caveats

16.2 Inclusions and exclusions checklist

Inclusions checklist
Exclusions checklist

16.3 Currency conversion rates for US$

16.4 Research methodology

16.5 Data procurement

Information sources

16.6 Data validation

16.7 Validation techniques employed for market sizing

16.8 Data synthesis

16.9 360 degree market analysis

16.10 List of abbreviations

Research Methodology

Technavio presents a detailed picture of the market by way of study, synthesis, and summation of data from multiple sources. The analysts have presented the various facets of the market with a particular focus on identifying the key industry influencers. The data thus presented is comprehensive, reliable, and the result of extensive research, both primary and secondary.

INFORMATION SOURCES

Primary sources

  • Manufacturers and suppliers
  • Channel partners
  • Industry experts
  • Strategic decision makers

Secondary sources

  • Industry journals and periodicals
  • Government data
  • Financial reports of key industry players
  • Historical data
  • Press releases

DATA ANALYSIS

Data Synthesis

  • Collation of data
  • Estimation of key figures
  • Analysis of derived insights

Data Validation

  • Triangulation with data models
  • Reference against proprietary databases
  • Corroboration with industry experts

REPORT WRITING

Qualitative

  • Market drivers
  • Market challenges
  • Market trends
  • Five forces analysis

Quantitative

  • Market size and forecast
  • Market segmentation
  • Geographical insights
  • Competitive landscape

Interested in this report?

Get your sample now to see our research methodology and insights!

Download Now

Frequently Asked Questions

Gnss Chip market growth will increase by USD 2069.7 million during 2026-2030.

The Gnss Chip market is expected to grow at a CAGR of 5.5% during 2026-2030.

Gnss Chip market is segmented by Device (Smartphones, Tablets and wearables, In-vehicle systems, Personal tracking devices, Others) Type (Consumer electronics, Automotive and transportation, Military and defense, Others) Application (Navigation, Positioning, Location-based services, Tracking, Others)

Allystar Technology Co. Ltd., BDStar Navigation, Broadcom Inc., CEC Huada Electronic Design, Furuno Electric Co. Ltd., Hexagon AB, JAVAD GNSS Inc., MediaTek Inc., NavInfo Co. Ltd., NXP Semiconductors NV, Qualcomm Inc., Quectel Wireless Solutions Co., Renesas Electronics Corp., Septentrio NV, SkyTraq Technology Inc., Skyworks Solutions Inc., Sony Group Corp., STMicroelectronics NV, Synaptics Inc., Trimble Inc. are a few of the key vendors in the Gnss Chip market.

APAC will register the highest growth rate of 42.5% among the other regions. Therefore, the Gnss Chip market in APAC is expected to garner significant business opportunities for the vendors during the forecast period.

China, India, Japan, South Korea, Taiwan, Australia, US, Canada, Mexico, Germany, UK, France, Italy, Russia, Spain, Saudi Arabia, UAE, South Africa, Egypt, Turkey, Brazil, Argentina, Chile

  • Integration into IoT and location-based services is the driving factor this market.

The Gnss Chip market vendors should focus on grabbing business opportunities from the Device segment as it accounted for the largest market share in the base year.
RIA - Research AI Assistant
Ask RIA
