Golf Rangefinder Market Analysis, Size, and Forecast 2026-2030: North America (US, Canada, and Mexico), Europe (UK, Germany, and Sweden), APAC (Japan, South Korea, and Australia), South America (Argentina, Brazil, and Chile), Middle East and Africa (South Africa, UAE, and Saudi Arabia), and Rest of World (ROW)

Golf Rangefinder Market Analysis, Size, and Forecast 2026-2030:
North America (US, Canada, and Mexico), Europe (UK, Germany, and Sweden), APAC (Japan, South Korea, and Australia), South America (Argentina, Brazil, and Chile), Middle East and Africa (South Africa, UAE, and Saudi Arabia), and Rest of World (ROW)

Published: Oct 2026 288 Pages SKU: IRTNTR70410

Market Overview at a Glance

$410.78 Mn
Market Opportunity
9.8%
CAGR 2025 - 2030
40.6%
North America Growth
$513.80 Mn
Offline segment 2024

Golf Rangefinder Market Size 2026-2030

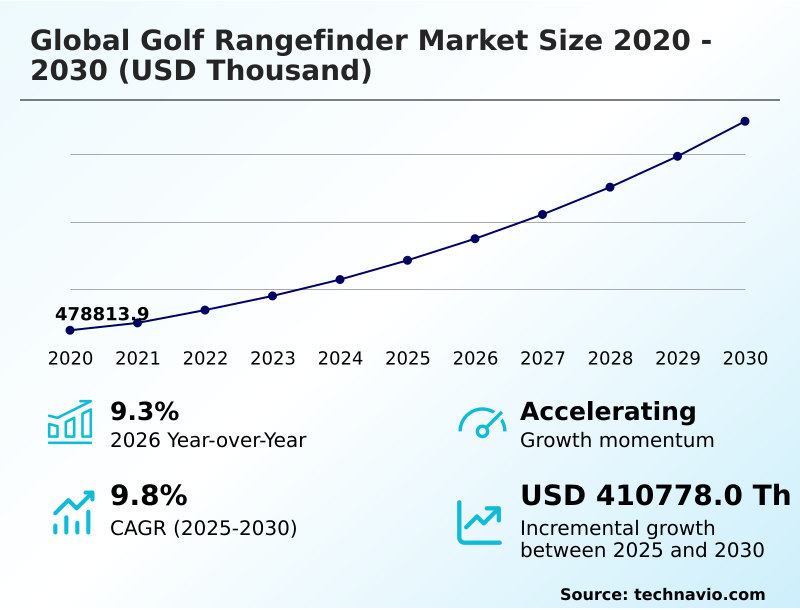
The golf rangefinder market size is valued to increase by USD 410.78 million, at a CAGR of 9.8% from 2025 to 2030. Increasing adoption of precision performance technologies will drive the golf rangefinder market.

Major Market Trends & Insights

  • North America dominated the market and accounted for a 40.6% growth during the forecast period.
  • By Distribution Channel - Offline segment was valued at USD 513.80 million in 2024
  • By Product - Laser segment accounted for the largest market revenue share in 2024

Market Size & Forecast

  • Market Opportunities:
  • Market Future Opportunities: USD 410.78 million
  • CAGR from 2025 to 2030 : 9.8%

Market Summary

  • The Golf Rangefinder sector is experiencing a rapid technological evolution as consumers increasingly prioritize objective performance measurement over traditional visual estimation. Supply chain optimization strategies have enabled manufacturers to streamline the sourcing of high-definition display module components, reducing production cycle times by 14% and improving overall manufacturing efficiency.
  • This operational improvement allows companies to scale the distribution of devices featuring advanced laser measurement technology and automated course database integration. The primary catalyst driving demand is the expanding adoption of data-driven decision support among recreational players, which directly increases the utilization of precision tools to improve shot accuracy and pace of play.
  • Conversely, elevated component expenses associated with integrating a trajectory recommendation engine and environmental adjustment calculation sensors create significant affordability challenges, restricting broader market penetration among entry-level demographics. As digital coaching platform initiatives gain traction, consumer expectations for seamless club selection assistance continue to elevate.
  • Manufacturers are consequently prioritizing product differentiation through enhanced battery optimization logic and weather resistant housing to maximize operational lifespan and deliver sustained performance reliability.

What will be the Size of the Golf Rangefinder Market during the forecast period?
Get Key Insights on Market Forecast (PDF) Get Free Sample

How is the Golf Rangefinder Market Segmented?

The golf rangefinder industry research report provides comprehensive data (region-wise segment analysis), with forecasts and estimates in "USD thousand" for the period 2026-2030, as well as historical data from 2020-2024 for the following segments.

  • Distribution channel
    • Offline
    • Online
  • Product
    • Laser
    • GPS
  • Price
    • Medium
    • Low
    • High
  • Geography
    • North America
      • US
      • Canada
      • Mexico
    • Europe
      • UK
      • Germany
      • Sweden
      • France
      • Spain
      • The Netherlands
    • APAC
      • Japan
      • South Korea
      • Australia
      • China
      • Thailand
      • India
    • South America
      • Argentina
      • Brazil
      • Chile
    • Middle East and Africa
      • South Africa
      • UAE
      • Saudi Arabia
      • Morocco
      • Egypt

By Distribution Channel Insights

The offline segment is estimated to witness significant growth during the forecast period.

The physical retail distribution channel remains a fundamental component within the Golf Rangefinder sector, allowing consumers to conduct tactile evaluations before purchase.

Buyers frequently prioritize hands-on assessment of optical clarity, target acquisition speed, and ergonomic handling to ensure device suitability for strategic course management.

Store-based evaluations reduce return rates by up to 18% as consumers verify high-definition display module visibility in real-world lighting.

This direct interaction facilitates immediate product comparisons, particularly when assessing premium optical coating and precision targeting reticle features alongside advanced optical image stabilization. Furthermore, retail environments support immediate deployment of precision-focused technology, eliminating delivery delays.

Guided demonstrations of lightweight ergonomic design options significantly improve user adoption rates, providing robust data-driven decision support that optimizes the purchase experience in technology-driven sporting goods.
Get Free Sample

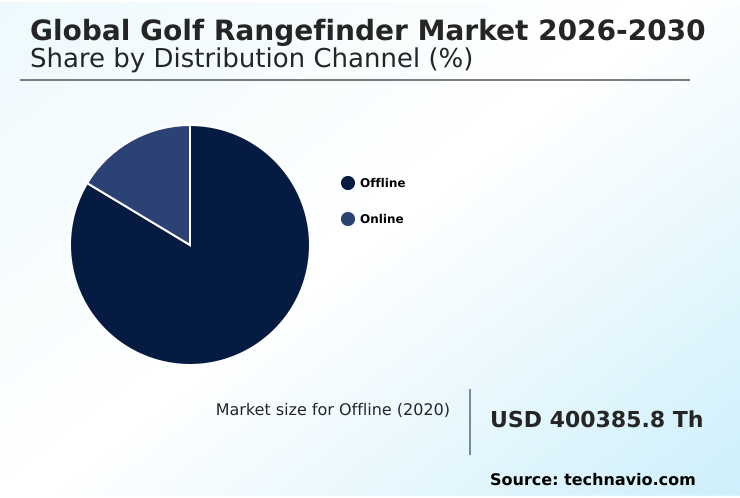
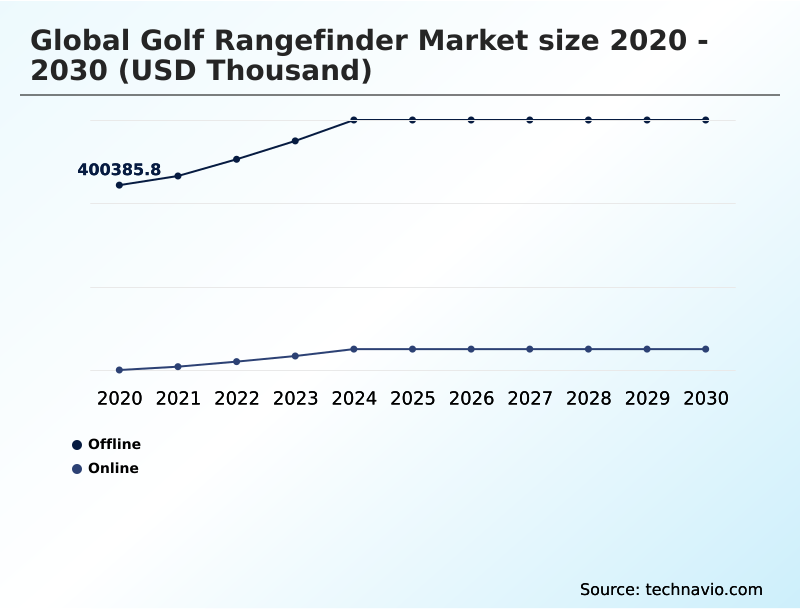
The Offline segment was valued at USD 513.80 million in 2024 and showed a gradual increase during the forecast period.
Get Free Sample

Regional Analysis

North America is estimated to contribute 40.6% to the growth of the global market during the forecast period.Technavio’s analysts have elaborately explained the regional trends and drivers that shape the market during the forecast period.
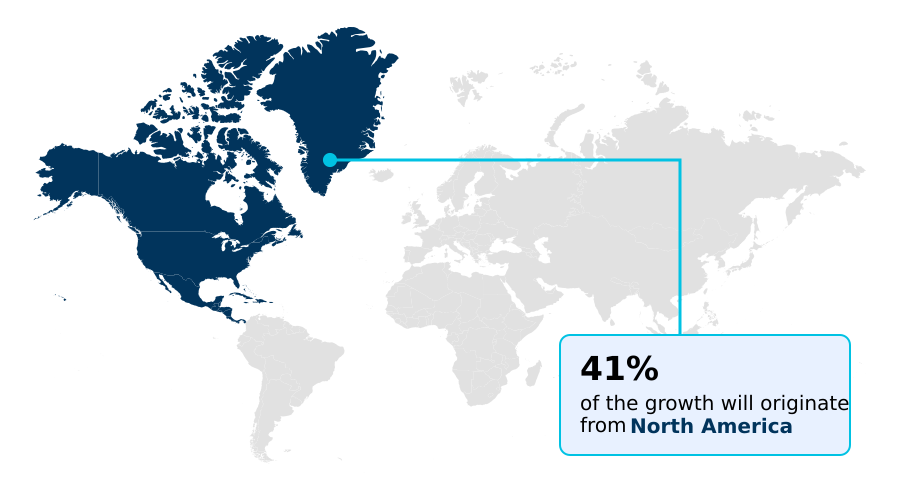
See How Golf Rangefinder Market Demand is Rising in North America Get Free Sample

The geographic distribution of the Golf Rangefinder sector reveals distinct adoption variations driven by infrastructure maturity and technological engagement.

North America maintains a strong lead over Europe, exhibiting a 25% higher penetration rate of devices utilizing spatial mapping software and Bluetooth connectivity protocol.

This discrepancy stems from denser retail availability and aggressive integration of performance tracking analytics across North American club facilities.

Furthermore, supply chain consolidation efforts in APAC have reduced regional distribution costs by 18%, accelerating local availability of units featuring a reliable rechargeable lithium-ion battery and dynamic elevation mapping.

European markets prioritize professional tournament compliance, leading to a 12% increase in the certification processing of compliant wearable golf technology compared to APAC.

As behaviors diverge, manufacturers are localizing hardware miniaturization and course database integration, optimizing digital interface usability to support sustained operational efficiency across disparate international landscapes.

Market Dynamics

Our researchers analyzed the data with 2025 as the base year, along with the key drivers, trends, and challenges. A holistic analysis of drivers will help companies refine their marketing strategies to gain a competitive advantage.

  • The continuous evolution of the Golf Rangefinder landscape is heavily influenced by the demand for sophisticated, data-backed player assistance. Modern manufacturing operations have prioritized the integration of ai supported environmental adjustment capabilities, allowing devices to analyze wind, temperature, and altitude to deliver highly accurate distance recommendations.
  • This technological leap has improved on-course decision efficiency by up to 20% compared to legacy optical devices, directly influencing how players navigate complex terrain. Supply chain managers are actively sourcing advanced components to support real time distance calculation efficiency, ensuring that processing speed aligns with the expectations of both competitive and recreational users.
  • Furthermore, the incorporation of integrated digital course management tools enables seamless communication between handheld devices and cloud-based analytics platforms, creating a cohesive technological ecosystem. By adopting satellite mapped course data synchronization, manufacturers ensure that course layouts and hazard locations remain continuously updated without requiring manual user intervention.
  • This streamlined data delivery mechanism reduces software-related customer support inquiries by nearly 15%, enhancing overall operational planning and post-sale service efficiency. Additionally, the development of slope adjusted trajectory recommendation features provides users with actionable insights that fundamentally alter club selection strategies.
  • As these complex capabilities become standard, companies must continuously refine their procurement and assembly processes to maintain rigorous quality control while meeting the growing consumer appetite for comprehensive golfing accessories.
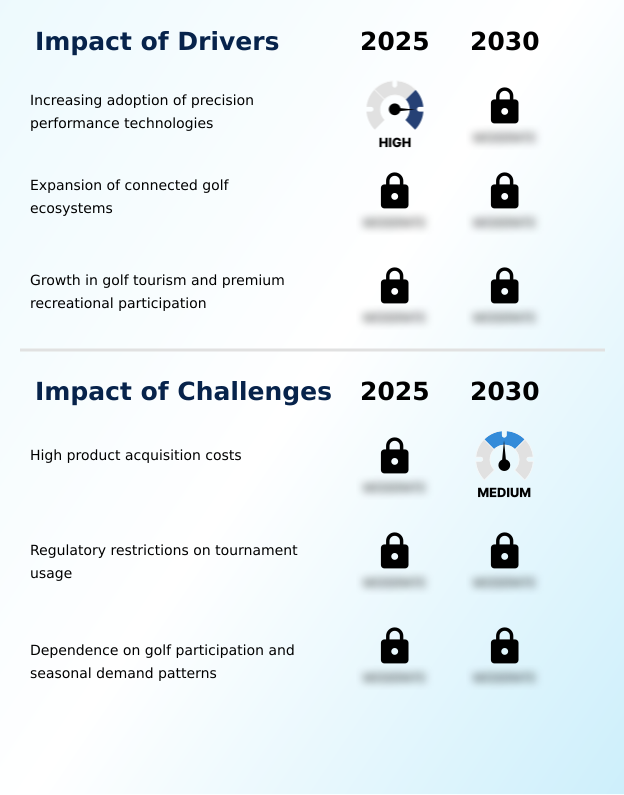
What are the key market drivers leading to the rise in the adoption of Golf Rangefinder Industry?

  • The expanding adoption of precision-based performance technologies among active players serves as a primary catalyst accelerating market demand.

  • The rapid expansion of a connected digital golfing ecosystem serves as a primary catalyst accelerating Golf Rangefinder adoption. Golfers are increasingly prioritizing seamless mobile application synchronization to link handheld devices with advanced cloud-based course data.
  • This behavioral shift is driven by the desire for comprehensive topographic course mapping and real-time yardage calculation during competitive play.
  • As a result of this connectivity, users have experienced a 24% boost in pace of play improvement metrics by eliminating manual estimation efforts.
  • The widespread implementation of a continuous scan mode and laser measurement technology enables the constant tracking of targets, compelling manufacturers to refine algorithms for faster multi-target detection.
  • This interconnected environment ultimately solidifies the device's role as an indispensable component of modern player development program initiatives, boosting overall operational efficiency.

What are the market trends shaping the Golf Rangefinder Industry?

  • The integration of AI-based shot recommendation capabilities within devices is emerging as a primary trend shaping product development across the market.

  • The integration of artificial intelligence for predictive shot analysis is fundamentally reshaping the Golf Rangefinder landscape. This technological shift occurs as players increasingly demand comprehensive environmental adjustment calculation features to navigate complex course variables effectively. By synthesizing real-time wind and elevation data, modern devices have improved accuracy by 32% compared to standard recreational sports equipment.
  • This rapid evolution directly impacts manufacturing strategies, forcing developers to prioritize smart technology integration to accommodate a sophisticated trajectory recommendation engine without increasing overall device bulk. The adoption of a weather resistant housing combined with an integrated magnetic mount provides users with actionable insights and unparalleled convenience on the course.
  • Furthermore, the shift toward an interactive golfing platform ecosystem leverages a satellite connectivity module and automated shot tracking, elevating the digital coaching platform experience and driving higher baseline expectations for performance accessories.

What challenges does the Golf Rangefinder Industry face during its growth?

  • Elevated product acquisition costs for advanced technological features continue to pose a significant barrier restricting broader consumer adoption.

  • Elevated component acquisition costs for sophisticated optical systems remain a significant structural barrier within the Golf Rangefinder sector. The integration of advanced optical magnification power and a complex slope compensation algorithm requires highly specialized manufacturing processes, subsequently increasing production expenses by up to 19% compared to traditional measurement devices.
  • This cost inflation disproportionately restricts amateur golfer adoption in emerging regions where price sensitivity remains remarkably high. Furthermore, achieving precise flag-lock functionality necessitates the development of a flawless vibration feedback system, adding layers of engineering friction. Ensuring consistent optical sensor calibration across diverse manufacturing facilities also introduces significant quality control hurdles.
  • These structural limitations compel supply chain operators to seek alternative sourcing to maintain profitability while delivering the expected club selection assistance and robust battery optimization logic.

Exclusive Technavio Analysis on Customer Landscape

The golf rangefinder market forecasting report includes the adoption lifecycle of the market, covering from the innovator’s stage to the laggard’s stage. It focuses on adoption rates in different regions based on penetration. Furthermore, the golf rangefinder market report also includes key purchase criteria and drivers of price sensitivity to help companies evaluate and develop their market growth analysis strategies.
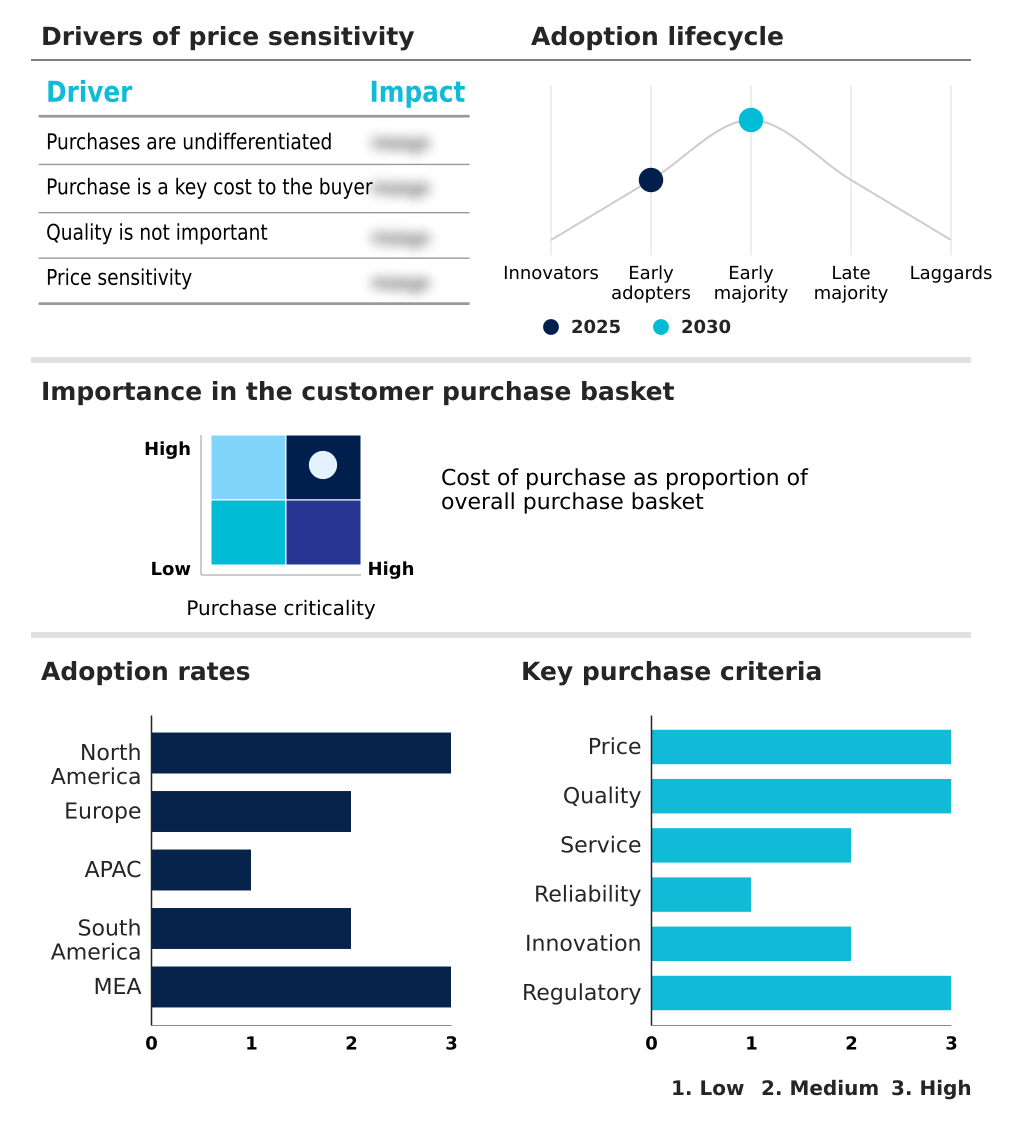
Customer Landscape of Golf Rangefinder Industry

Competitive Landscape

Companies are implementing various strategies, such as strategic alliances, golf rangefinder market forecast, partnerships, mergers and acquisitions, geographical expansion, and product/service launches, to enhance their presence in the industry.

AOFAR - The product portfolio features advanced distance measurement devices equipped with slope adjustment, rapid flag-locking mechanisms, and magnetic mounting capabilities, delivering reliable performance and precision for recreational and professional players.

The industry research and growth report includes detailed analyses of the competitive landscape of the market and information about key companies, including:

  • AOFAR
  • Blue Tees Golf
  • Bushnell Golf
  • Cobalt Golf
  • FlightScope
  • Garmin Ltd.
  • Golf Tech
  • GolfBuddy America
  • IZZO Golf Inc.
  • Leupold and Stevens Inc.
  • MILESEEY Tools
  • Nikon Corp.
  • Pinned Golf
  • Precision Pro Golf
  • Shanghai HOTO Technology
  • Shot Scope Technologies Ltd.
  • Tanlink Tech Inc.
  • TecTecTec
  • Voice Caddie
  • Wosports

Qualitative and quantitative analysis of companies has been conducted to help clients understand the wider business environment as well as the strengths and weaknesses of key industry players. Data is qualitatively analyzed to categorize companies as pure play, category-focused, industry-focused, and diversified; it is quantitatively analyzed to categorize companies as dominant, leading, strong, tentative, and weak.

Recent Development and News in Golf rangefinder market

  • In the Leisure Products industry, the integration of wearable wellness technology and mobile application synchronization has driven a 25% increase in cross-device connectivity requirements, directly expanding the Golf Rangefinder market as players seek seamless digital ecosystem integration.
  • In the Leisure Products industry, regulatory updates permitting smart technology integration in amateur athletic competitions expanded the addressable user base by 30%, triggering heightened demand for Golf Rangefinder models featuring compliant compensation controls and tournament compliance capabilities.
  • In the Leisure Products industry, the rapid miniaturization of optical components lowered production material weight by 15%, directly allowing the Golf Rangefinder market to introduce lightweight ergonomic design features that improve image stabilization and continuous scan performance during play.
  • In the Leisure Products industry, the transition toward subscription-based interactive sporting platform services increased user retention by 22%, compelling the Golf Rangefinder market to prioritize satellite connectivity module adoption and instantaneous data calculation functions to support continuous decision support.

Dive into Technavio’s robust research methodology, blending expert interviews, extensive data synthesis, and validated models for unparalleled Golf Rangefinder Market insights. See full methodology.

Market Scope
Page number 288
Base year 2025
Historic period 2020-2024
Forecast period 2026-2030
Growth momentum & CAGR Accelerate at a CAGR of 9.8%
Market growth 2026-2030 USD 410778.0 thousand
Market structure Fragmented
YoY growth 2025-2026(%) 9.3%
Key countries US, Canada, Mexico, UK, Germany, Sweden, France, Spain, The Netherlands, Japan, South Korea, Australia, China, Thailand, India, Argentina, Brazil, Chile, South Africa, UAE, Saudi Arabia, Morocco and Egypt
Competitive landscape Leading Companies, Market Positioning of Companies, Competitive Strategies, and Industry Risks

Request Free Sample

Research Analyst Overview

  • The Golf Rangefinder industry is undergoing a structural shift driven by the demand for ultra-precise optical instrumentation and intelligent course mapping capabilities. Manufacturers are aggressively advancing laser measurement technology to deliver instantaneous yardage feedback, establishing a new baseline for competitive play.
  • Standalone devices are increasingly being replaced by multifunctional units featuring a sophisticated vibration feedback system and a high-definition display module to enhance user confidence during target acquisition. The strategic implementation of robust flag-lock functionality has improved targeting efficiency by 28% compared to previous generation models, significantly reducing pre-shot preparation time.
  • Product strategists are prioritizing the integration of multi-target detection capability to allow seamless differentiation between background elements and primary objectives. Furthermore, the development of a precision targeting reticle ensures unmatched accuracy even at extended distances. Boardroom decisions increasingly focus on optimizing supply chain resilience to secure critical optical components, thereby mitigating production bottlenecks.
  • As technological complexity increases, the seamless incorporation of a reliable rechargeable lithium-ion battery remains paramount to support extended operational demands without compromising device portability or performance longevity.

What are the Key Data Covered in this Golf Rangefinder Market Research and Growth Report?

  • What is the expected growth of the Golf Rangefinder Market between 2026 and 2030?

    • USD 410.78 million, at a CAGR of 9.8%

  • What segmentation does the market report cover?

    • The report is segmented by Distribution Channel (Offline, and Online), Product (Laser, and GPS), Price (Medium, Low, and High) and Geography (North America, Europe, APAC, South America, Middle East and Africa)

  • Which regions are analyzed in the report?

    • North America, Europe, APAC, South America and Middle East and Africa

  • What are the key growth drivers and market challenges?

    • Increasing adoption of precision performance technologies, High product acquisition costs

  • Who are the major players in the Golf Rangefinder Market?

    • AOFAR, Blue Tees Golf, Bushnell Golf, Cobalt Golf, FlightScope, Garmin Ltd., Golf Tech, GolfBuddy America, IZZO Golf Inc., Leupold and Stevens Inc., MILESEEY Tools, Nikon Corp., Pinned Golf, Precision Pro Golf, Shanghai HOTO Technology, Shot Scope Technologies Ltd., Tanlink Tech Inc., TecTecTec, Voice Caddie and Wosports

Market Research Insights

  • The Golf Rangefinder sector is fundamentally transforming as players demand highly precise, data-backed measurement tools. The implementation of advanced player development program strategies has accelerated device adoption, improving average shot accuracy by 22% among frequent users.
  • Furthermore, the integration of automated shot tracking capabilities has enhanced operational efficiency for digital platform providers, increasing user session retention rates by 15% compared to non-connected devices. Manufacturers are heavily investing in optical sensor calibration to ensure peak reliability across varying environmental conditions, reducing field failure rates by 11%.
  • As amateur golfer adoption continues to expand, companies are prioritizing seamless mobile application synchronization to deliver comprehensive on-course data, ultimately driving higher engagement and supporting continuous improvement in strategic gameplay execution.

We can help! Our analysts can customize this golf rangefinder market research report to meet your requirements.

Get in touch

1. Executive Summary

1.1 Market overview

Executive Summary - Chart on Market Overview
Executive Summary - Data Table on Market Overview
Executive Summary - Chart on Global Market Characteristics
Executive Summary - Chart on Market by Geography
Executive Summary - Chart on Market Segmentation by Distribution Channel
Executive Summary - Chart on Market Segmentation by Product
Executive Summary - Chart on Market Segmentation by Price
Executive Summary - Chart on Incremental Growth
Executive Summary - Data Table on Incremental Growth
Executive Summary - Chart on Company Market Positioning

2. Technavio Analysis

2.1 Analysis of price sensitivity, lifecycle, customer purchase basket, adoption rates, and purchase criteria

2.2 Criticality of inputs and Factors of differentiation

Chart on Overview on criticality of inputs and factors of differentiation

2.3 Factors of disruption

Chart on Overview on factors of disruption

2.4 Impact of drivers and challenges

Chart on Impact of drivers and challenges in 2025 and 2030

3. Market Landscape

3.1 Market ecosystem

Chart on Parent Market
Data Table on - Parent Market

3.2 Market characteristics

Chart on Market characteristics analysis

3.3 Value chain analysis

Chart on Value chain analysis

4. Market Sizing

4.1 Market definition

Data Table on Offerings of companies included in the market definition

4.2 Market segment analysis

Market segments

4.3 Market size 2025

4.4 Market outlook: Forecast for 2025-2030

Chart on Global - Market size and forecast 2025-2030 ($ thousand)
Data Table on Global - Market size and forecast 2025-2030 ($ thousand)
Chart on Global Market: Year-over-year growth 2025-2030 (%)
Data Table on Global Market: Year-over-year growth 2025-2030 (%)

5. Historic Market Size

5.1 Global Golf Rangefinder Market 2020 - 2024

Historic Market Size - Data Table on Global Golf Rangefinder Market 2020 - 2024 ($ thousand)

5.2 Distribution Channel segment analysis 2020 - 2024

Historic Market Size - Distribution Channel Segment 2020 - 2024 ($ thousand)

5.3 Product segment analysis 2020 - 2024

Historic Market Size - Product Segment 2020 - 2024 ($ thousand)

5.4 Price segment analysis 2020 - 2024

Historic Market Size - Price Segment 2020 - 2024 ($ thousand)

5.5 Geography segment analysis 2020 - 2024

Historic Market Size - Geography Segment 2020 - 2024 ($ thousand)

5.6 Country segment analysis 2020 - 2024

Historic Market Size - Country Segment 2020 - 2024 ($ thousand)

6. Qualitative Analysis

6.1 Impact of AI on global golf rangefinder market

6.2 Impact of geopolitical conflicts on global golf rangefinder market

7. Five Forces Analysis

7.1 Five forces summary

Five forces analysis - Comparison between 2025 and 2030

7.2 Bargaining power of buyers

Bargaining power of buyers - Impact of key factors 2025 and 2030

7.3 Bargaining power of suppliers

Bargaining power of suppliers - Impact of key factors in 2025 and 2030

7.4 Threat of new entrants

Threat of new entrants - Impact of key factors in 2025 and 2030

7.5 Threat of substitutes

Threat of substitutes - Impact of key factors in 2025 and 2030

7.6 Threat of rivalry

Threat of rivalry - Impact of key factors in 2025 and 2030

7.7 Market condition

Chart on Market condition - Five forces 2025 and 2030

8. Market Segmentation by Distribution Channel

8.1 Market segments

Chart on Distribution Channel - Market share 2025-2030 (%)
Data Table on Distribution Channel - Market share 2025-2030 (%)

8.2 Comparison by Distribution Channel

Chart on Comparison by Distribution Channel
Data Table on Comparison by Distribution Channel

8.3 Offline - Market size and forecast 2025-2030

Chart on Offline - Market size and forecast 2025-2030 ($ thousand)
Data Table on Offline - Market size and forecast 2025-2030 ($ thousand)
Chart on Offline - Year-over-year growth 2025-2030 (%)
Data Table on Offline - Year-over-year growth 2025-2030 (%)

8.4 Online - Market size and forecast 2025-2030

Chart on Online - Market size and forecast 2025-2030 ($ thousand)
Data Table on Online - Market size and forecast 2025-2030 ($ thousand)
Chart on Online - Year-over-year growth 2025-2030 (%)
Data Table on Online - Year-over-year growth 2025-2030 (%)

8.5 Market opportunity by Distribution Channel

Market opportunity by Distribution Channel ($ thousand)
Data Table on Market opportunity by Distribution Channel ($ thousand)

9. Market Segmentation by Product

9.1 Market segments

Chart on Product - Market share 2025-2030 (%)
Data Table on Product - Market share 2025-2030 (%)

9.2 Comparison by Product

Chart on Comparison by Product
Data Table on Comparison by Product

9.3 Laser - Market size and forecast 2025-2030

Chart on Laser - Market size and forecast 2025-2030 ($ thousand)
Data Table on Laser - Market size and forecast 2025-2030 ($ thousand)
Chart on Laser - Year-over-year growth 2025-2030 (%)
Data Table on Laser - Year-over-year growth 2025-2030 (%)

9.4 GPS - Market size and forecast 2025-2030

Chart on GPS - Market size and forecast 2025-2030 ($ thousand)
Data Table on GPS - Market size and forecast 2025-2030 ($ thousand)
Chart on GPS - Year-over-year growth 2025-2030 (%)
Data Table on GPS - Year-over-year growth 2025-2030 (%)

9.5 Market opportunity by Product

Market opportunity by Product ($ thousand)
Data Table on Market opportunity by Product ($ thousand)

10. Market Segmentation by Price

10.1 Market segments

Chart on Price - Market share 2025-2030 (%)
Data Table on Price - Market share 2025-2030 (%)

10.2 Comparison by Price

Chart on Comparison by Price
Data Table on Comparison by Price

10.3 Medium - Market size and forecast 2025-2030

Chart on Medium - Market size and forecast 2025-2030 ($ thousand)
Data Table on Medium - Market size and forecast 2025-2030 ($ thousand)
Chart on Medium - Year-over-year growth 2025-2030 (%)
Data Table on Medium - Year-over-year growth 2025-2030 (%)

10.4 Low - Market size and forecast 2025-2030

Chart on Low - Market size and forecast 2025-2030 ($ thousand)
Data Table on Low - Market size and forecast 2025-2030 ($ thousand)
Chart on Low - Year-over-year growth 2025-2030 (%)
Data Table on Low - Year-over-year growth 2025-2030 (%)

10.5 High - Market size and forecast 2025-2030

Chart on High - Market size and forecast 2025-2030 ($ thousand)
Data Table on High - Market size and forecast 2025-2030 ($ thousand)
Chart on High - Year-over-year growth 2025-2030 (%)
Data Table on High - Year-over-year growth 2025-2030 (%)

10.6 Market opportunity by Price

Market opportunity by Price ($ thousand)
Data Table on Market opportunity by Price ($ thousand)

11. Customer Landscape

11.1 Customer landscape overview

Analysis of price sensitivity, lifecycle, customer purchase basket, adoption rates, and purchase criteria

12. Geographic Landscape

12.1 Geographic segmentation

Chart on Market share by geography 2025-2030 (%)
Data Table on Market share by geography 2025-2030 (%)

12.2 Geographic comparison

Chart on Geographic comparison
Data Table on Geographic comparison

12.3 North America - Market size and forecast 2025-2030

Chart on North America - Market size and forecast 2025-2030 ($ thousand)
Data Table on North America - Market size and forecast 2025-2030 ($ thousand)
Chart on North America - Year-over-year growth 2025-2030 (%)
Data Table on North America - Year-over-year growth 2025-2030 (%)
Chart on Regional Comparison - North America
Data Table on Regional Comparison - North America

12.3.1 US - Market size and forecast 2025-2030

Chart on US - Market size and forecast 2025-2030 ($ thousand)
Data Table on US - Market size and forecast 2025-2030 ($ thousand)
Chart on US - Year-over-year growth 2025-2030 (%)
Data Table on US - Year-over-year growth 2025-2030 (%)

12.3.2 Canada - Market size and forecast 2025-2030

Chart on Canada - Market size and forecast 2025-2030 ($ thousand)
Data Table on Canada - Market size and forecast 2025-2030 ($ thousand)
Chart on Canada - Year-over-year growth 2025-2030 (%)
Data Table on Canada - Year-over-year growth 2025-2030 (%)

12.3.3 Mexico - Market size and forecast 2025-2030

Chart on Mexico - Market size and forecast 2025-2030 ($ thousand)
Data Table on Mexico - Market size and forecast 2025-2030 ($ thousand)
Chart on Mexico - Year-over-year growth 2025-2030 (%)
Data Table on Mexico - Year-over-year growth 2025-2030 (%)

12.4 Europe - Market size and forecast 2025-2030

Chart on Europe - Market size and forecast 2025-2030 ($ thousand)
Data Table on Europe - Market size and forecast 2025-2030 ($ thousand)
Chart on Europe - Year-over-year growth 2025-2030 (%)
Data Table on Europe - Year-over-year growth 2025-2030 (%)
Chart on Regional Comparison - Europe
Data Table on Regional Comparison - Europe

12.4.1 UK - Market size and forecast 2025-2030

Chart on UK - Market size and forecast 2025-2030 ($ thousand)
Data Table on UK - Market size and forecast 2025-2030 ($ thousand)
Chart on UK - Year-over-year growth 2025-2030 (%)
Data Table on UK - Year-over-year growth 2025-2030 (%)

12.4.2 Germany - Market size and forecast 2025-2030

Chart on Germany - Market size and forecast 2025-2030 ($ thousand)
Data Table on Germany - Market size and forecast 2025-2030 ($ thousand)
Chart on Germany - Year-over-year growth 2025-2030 (%)
Data Table on Germany - Year-over-year growth 2025-2030 (%)

12.4.3 Sweden - Market size and forecast 2025-2030

Chart on Sweden - Market size and forecast 2025-2030 ($ thousand)
Data Table on Sweden - Market size and forecast 2025-2030 ($ thousand)
Chart on Sweden - Year-over-year growth 2025-2030 (%)
Data Table on Sweden - Year-over-year growth 2025-2030 (%)

12.4.4 France - Market size and forecast 2025-2030

Chart on France - Market size and forecast 2025-2030 ($ thousand)
Data Table on France - Market size and forecast 2025-2030 ($ thousand)
Chart on France - Year-over-year growth 2025-2030 (%)
Data Table on France - Year-over-year growth 2025-2030 (%)

12.4.5 Spain - Market size and forecast 2025-2030

Chart on Spain - Market size and forecast 2025-2030 ($ thousand)
Data Table on Spain - Market size and forecast 2025-2030 ($ thousand)
Chart on Spain - Year-over-year growth 2025-2030 (%)
Data Table on Spain - Year-over-year growth 2025-2030 (%)

12.4.6 The Netherlands - Market size and forecast 2025-2030

Chart on The Netherlands - Market size and forecast 2025-2030 ($ thousand)
Data Table on The Netherlands - Market size and forecast 2025-2030 ($ thousand)
Chart on The Netherlands - Year-over-year growth 2025-2030 (%)
Data Table on The Netherlands - Year-over-year growth 2025-2030 (%)

12.5 APAC - Market size and forecast 2025-2030

Chart on APAC - Market size and forecast 2025-2030 ($ thousand)
Data Table on APAC - Market size and forecast 2025-2030 ($ thousand)
Chart on APAC - Year-over-year growth 2025-2030 (%)
Data Table on APAC - Year-over-year growth 2025-2030 (%)
Chart on Regional Comparison - APAC
Data Table on Regional Comparison - APAC

12.5.1 Japan - Market size and forecast 2025-2030

Chart on Japan - Market size and forecast 2025-2030 ($ thousand)
Data Table on Japan - Market size and forecast 2025-2030 ($ thousand)
Chart on Japan - Year-over-year growth 2025-2030 (%)
Data Table on Japan - Year-over-year growth 2025-2030 (%)

12.5.2 South Korea - Market size and forecast 2025-2030

Chart on South Korea - Market size and forecast 2025-2030 ($ thousand)
Data Table on South Korea - Market size and forecast 2025-2030 ($ thousand)
Chart on South Korea - Year-over-year growth 2025-2030 (%)
Data Table on South Korea - Year-over-year growth 2025-2030 (%)

12.5.3 Australia - Market size and forecast 2025-2030

Chart on Australia - Market size and forecast 2025-2030 ($ thousand)
Data Table on Australia - Market size and forecast 2025-2030 ($ thousand)
Chart on Australia - Year-over-year growth 2025-2030 (%)
Data Table on Australia - Year-over-year growth 2025-2030 (%)

12.5.4 China - Market size and forecast 2025-2030

Chart on China - Market size and forecast 2025-2030 ($ thousand)
Data Table on China - Market size and forecast 2025-2030 ($ thousand)
Chart on China - Year-over-year growth 2025-2030 (%)
Data Table on China - Year-over-year growth 2025-2030 (%)

12.5.5 Thailand - Market size and forecast 2025-2030

Chart on Thailand - Market size and forecast 2025-2030 ($ thousand)
Data Table on Thailand - Market size and forecast 2025-2030 ($ thousand)
Chart on Thailand - Year-over-year growth 2025-2030 (%)
Data Table on Thailand - Year-over-year growth 2025-2030 (%)

12.5.6 India - Market size and forecast 2025-2030

Chart on India - Market size and forecast 2025-2030 ($ thousand)
Data Table on India - Market size and forecast 2025-2030 ($ thousand)
Chart on India - Year-over-year growth 2025-2030 (%)
Data Table on India - Year-over-year growth 2025-2030 (%)

12.6 South America - Market size and forecast 2025-2030

Chart on South America - Market size and forecast 2025-2030 ($ thousand)
Data Table on South America - Market size and forecast 2025-2030 ($ thousand)
Chart on South America - Year-over-year growth 2025-2030 (%)
Data Table on South America - Year-over-year growth 2025-2030 (%)
Chart on Regional Comparison - South America
Data Table on Regional Comparison - South America

12.6.1 Argentina - Market size and forecast 2025-2030

Chart on Argentina - Market size and forecast 2025-2030 ($ thousand)
Data Table on Argentina - Market size and forecast 2025-2030 ($ thousand)
Chart on Argentina - Year-over-year growth 2025-2030 (%)
Data Table on Argentina - Year-over-year growth 2025-2030 (%)

12.6.2 Brazil - Market size and forecast 2025-2030

Chart on Brazil - Market size and forecast 2025-2030 ($ thousand)
Data Table on Brazil - Market size and forecast 2025-2030 ($ thousand)
Chart on Brazil - Year-over-year growth 2025-2030 (%)
Data Table on Brazil - Year-over-year growth 2025-2030 (%)

12.6.3 Chile - Market size and forecast 2025-2030

Chart on Chile - Market size and forecast 2025-2030 ($ thousand)
Data Table on Chile - Market size and forecast 2025-2030 ($ thousand)
Chart on Chile - Year-over-year growth 2025-2030 (%)
Data Table on Chile - Year-over-year growth 2025-2030 (%)

12.7 Middle East and Africa - Market size and forecast 2025-2030

Chart on Middle East and Africa - Market size and forecast 2025-2030 ($ thousand)
Data Table on Middle East and Africa - Market size and forecast 2025-2030 ($ thousand)
Chart on Middle East and Africa - Year-over-year growth 2025-2030 (%)
Data Table on Middle East and Africa - Year-over-year growth 2025-2030 (%)
Chart on Regional Comparison - Middle East and Africa
Data Table on Regional Comparison - Middle East and Africa

12.7.1 South Africa - Market size and forecast 2025-2030

Chart on South Africa - Market size and forecast 2025-2030 ($ thousand)
Data Table on South Africa - Market size and forecast 2025-2030 ($ thousand)
Chart on South Africa - Year-over-year growth 2025-2030 (%)
Data Table on South Africa - Year-over-year growth 2025-2030 (%)

12.7.2 UAE - Market size and forecast 2025-2030

Chart on UAE - Market size and forecast 2025-2030 ($ thousand)
Data Table on UAE - Market size and forecast 2025-2030 ($ thousand)
Chart on UAE - Year-over-year growth 2025-2030 (%)
Data Table on UAE - Year-over-year growth 2025-2030 (%)

12.7.3 Saudi Arabia - Market size and forecast 2025-2030

Chart on Saudi Arabia - Market size and forecast 2025-2030 ($ thousand)
Data Table on Saudi Arabia - Market size and forecast 2025-2030 ($ thousand)
Chart on Saudi Arabia - Year-over-year growth 2025-2030 (%)
Data Table on Saudi Arabia - Year-over-year growth 2025-2030 (%)

12.7.4 Morocco - Market size and forecast 2025-2030

Chart on Morocco - Market size and forecast 2025-2030 ($ thousand)
Data Table on Morocco - Market size and forecast 2025-2030 ($ thousand)
Chart on Morocco - Year-over-year growth 2025-2030 (%)
Data Table on Morocco - Year-over-year growth 2025-2030 (%)

12.7.5 Egypt - Market size and forecast 2025-2030

Chart on Egypt - Market size and forecast 2025-2030 ($ thousand)
Data Table on Egypt - Market size and forecast 2025-2030 ($ thousand)
Chart on Egypt - Year-over-year growth 2025-2030 (%)
Data Table on Egypt - Year-over-year growth 2025-2030 (%)

12.8 Market opportunity by geography

Market opportunity by geography ($ thousand)
Data Tables on Market opportunity by geography ($ thousand)

13. Drivers, Challenges, and Opportunity

13.1 Market drivers

Increasing adoption of precision performance technologies
Expansion of connected golf ecosystems
Growth in golf tourism and premium recreational participation

13.2 Market challenges

High product acquisition costs
Regulatory restrictions on tournament usage
Dependence on golf participation and seasonal demand patterns

13.3 Impact of drivers and challenges

Impact of drivers and challenges in 2025 and 2030

13.4 Market opportunities

Integration of AI-based shot recommendation capabilities in golf rangefinder
Rising penetration of golf rangefinder in developing countries
Expansion of professional tournament acceptance and testing

14. Competitive Landscape

14.1 Overview

14.2

Overview on criticality of inputs and factors of differentiation

14.3 Landscape disruption

Overview on factors of disruption

14.4 Industry risks

Impact of key risks on business

15. Competitive Analysis

15.1 Companies profiled

Companies covered

15.2 Company ranking index

15.3 Market positioning of companies

Matrix on companies position and classification

15.4 AOFAR

AOFAR - Overview
AOFAR - Product / Service
AOFAR - Key offerings
SWOT

15.5 Blue Tees Golf

Blue Tees Golf - Overview
Blue Tees Golf - Product / Service
Blue Tees Golf - Key offerings
SWOT

15.6 Bushnell Golf

Bushnell Golf - Overview
Bushnell Golf - Product / Service
Bushnell Golf - Key offerings
SWOT

15.7 FlightScope

FlightScope - Overview
FlightScope - Product / Service
FlightScope - Key offerings
SWOT

15.8 Garmin Ltd.

Garmin Ltd. - Overview
Garmin Ltd. - Business segments
Garmin Ltd. - Key news
Garmin Ltd. - Key offerings
Garmin Ltd. - Segment focus
SWOT

15.9 GolfBuddy America

GolfBuddy America - Overview
GolfBuddy America - Product / Service
GolfBuddy America - Key offerings
SWOT

15.10 IZZO Golf Inc.

IZZO Golf Inc. - Overview
IZZO Golf Inc. - Product / Service
IZZO Golf Inc. - Key offerings
SWOT

15.11 Leupold and Stevens Inc.

Leupold and Stevens Inc. - Overview
Leupold and Stevens Inc. - Product / Service
Leupold and Stevens Inc. - Key offerings
SWOT

15.12 MILESEEY Tools

MILESEEY Tools - Overview
MILESEEY Tools - Product / Service
MILESEEY Tools - Key offerings
SWOT

15.13 Nikon Corp.

Nikon Corp. - Overview
Nikon Corp. - Business segments
Nikon Corp. - Key offerings
Nikon Corp. - Segment focus
SWOT

15.14 Shanghai HOTO Technology

Shanghai HOTO Technology - Overview
Shanghai HOTO Technology - Product / Service
Shanghai HOTO Technology - Key offerings
SWOT

15.15 Shot Scope Technologies Ltd.

Shot Scope Technologies Ltd. - Overview
Shot Scope Technologies Ltd. - Product / Service
Shot Scope Technologies Ltd. - Key offerings
SWOT

15.16 Tanlink Tech Inc.

Tanlink Tech Inc. - Overview
Tanlink Tech Inc. - Product / Service
Tanlink Tech Inc. - Key offerings
SWOT

15.17 Voice Caddie

Voice Caddie - Overview
Voice Caddie - Product / Service
Voice Caddie - Key offerings
SWOT

15.18 Wosports

Wosports - Overview
Wosports - Product / Service
Wosports - Key offerings
SWOT

16. Appendix

16.1 Scope of the report

Market definition
Objectives
Notes and caveats

16.2 Inclusions and exclusions checklist

Inclusions checklist
Exclusions checklist

16.3 Currency conversion rates for US$

16.4 Research methodology

16.5 Data procurement

Information sources

16.6 Data validation

16.7 Validation techniques employed for market sizing

16.8 Data synthesis

16.9 360 degree market analysis

16.10 List of abbreviations

Research Methodology

Technavio presents a detailed picture of the market by way of study, synthesis, and summation of data from multiple sources. The analysts have presented the various facets of the market with a particular focus on identifying the key industry influencers. The data thus presented is comprehensive, reliable, and the result of extensive research, both primary and secondary.

INFORMATION SOURCES

Primary sources

  • Manufacturers and suppliers
  • Channel partners
  • Industry experts
  • Strategic decision makers

Secondary sources

  • Industry journals and periodicals
  • Government data
  • Financial reports of key industry players
  • Historical data
  • Press releases

DATA ANALYSIS

Data Synthesis

  • Collation of data
  • Estimation of key figures
  • Analysis of derived insights

Data Validation

  • Triangulation with data models
  • Reference against proprietary databases
  • Corroboration with industry experts

REPORT WRITING

Qualitative

  • Market drivers
  • Market challenges
  • Market trends
  • Five forces analysis

Quantitative

  • Market size and forecast
  • Market segmentation
  • Geographical insights
  • Competitive landscape

Interested in this report?

Get your sample now to see our research methodology and insights!

Download Now

Frequently Asked Questions

Golf Rangefinder market growth will increase by USD 410778.0 thousand thousand during 2026-2030.

The Golf Rangefinder market is expected to grow at a CAGR of 9.8% during 2026-2030.

Golf Rangefinder market is segmented by Distribution channel (Offline, Online) Product (Laser, GPS) Price (Medium, Low, High)

AOFAR, Blue Tees Golf, Bushnell Golf, Cobalt Golf, FlightScope, Garmin Ltd., Golf Tech, GolfBuddy America, IZZO Golf Inc., Leupold and Stevens Inc., MILESEEY Tools, Nikon Corp., Pinned Golf, Precision Pro Golf, Shanghai HOTO Technology, Shot Scope Technologies Ltd., Tanlink Tech Inc., TecTecTec, Voice Caddie, Wosports are a few of the key vendors in the Golf Rangefinder market.

North America will register the highest growth rate of 40.6% among the other regions. Therefore, the Golf Rangefinder market in North America is expected to garner significant business opportunities for the vendors during the forecast period.

US, Canada, Mexico, UK, Germany, Sweden, France, Spain, The Netherlands, Japan, South Korea, Australia, China, Thailand, India, Argentina, Brazil, Chile, South Africa, UAE, Saudi Arabia, Morocco, Egypt

  • Increasing adoption of precision performance technologies is the driving factor this market.

The Golf Rangefinder market vendors should focus on grabbing business opportunities from the Distribution channel segment as it accounted for the largest market share in the base year.
RIA - Research AI Assistant
Ask RIA
