
Healthcare Interoperability Solution Market Analysis, Size, and Forecast 2026-2030: North America (US, Canada, and Mexico), Europe (Germany, UK, and France), Asia (China, Japan, and India), South America (Brazil, Colombia, and Argentina), Middle East and Africa (Saudi Arabia, UAE, and Israel), Rest of World (ROW)

Healthcare Interoperability Solution Market Analysis, Size, and Forecast 2026-2030:
North America (US, Canada, and Mexico), Europe (Germany, UK, and France), Asia (China, Japan, and India), South America (Brazil, Colombia, and Argentina), Middle East and Africa (Saudi Arabia, UAE, and Israel), Rest of World (ROW)

Published: Oct 2026 281 Pages SKU: IRTNTR74954

Market Overview at a Glance

$5.21 B
Market Opportunity
14.5%
CAGR 2025 - 2030
39.4%
North America Growth
$3.11 B
On-premises segment 2024

Healthcare Interoperability Solution Market Size 2026-2030

The healthcare interoperability solution market size is valued to increase by USD 5.21 billion, at a CAGR of 14.5% from 2025 to 2030. Growing demand for coordinated patient care and longitudinal health records will drive the healthcare interoperability solution market.

Major Market Trends & Insights

  • North America dominated the market and accounted for a 39.4% growth during the forecast period.
  • By Deployment - On-premises segment was valued at USD 3.11 billion in 2024
  • By Type - Structural segment accounted for the largest market revenue share in 2024

Market Size & Forecast

  • Market Opportunities: USD 7.54 billion
  • Market Future Opportunities: USD 5.21 billion
  • CAGR from 2025 to 2030 : 14.5%

Market Summary

  • The Healthcare Interoperability Solution Market is experiencing robust expansion as medical institutions increasingly prioritize seamless information exchange across disparate clinical and administrative platforms. In a typical hospital network scenario, integrating fragmented electronic health records with pharmacy and laboratory systems allows clinicians to access comprehensive longitudinal patient records instantly, reducing redundant diagnostic testing by up to 20%.
  • This operational efficiency is primarily driven by the growing demand for coordinated care delivery, which compels organizations to invest heavily in advanced clinical data integration and robust application programming interfaces. However, the market faces substantial headwinds due to complex legacy system integration barriers.
  • Many healthcare facilities still operate on decades-old infrastructure lacking modern data standardization protocols, making the transition to unified digital health ecosystems highly resource-intensive. Overcoming these structural interoperability hurdles requires sophisticated data transformation technologies.
  • As healthcare data connectivity becomes paramount for population health management, the deployment of secure data exchange frameworks continues to reshape how patient-centric care models are executed across the healthcare continuum.

What will be the Size of the Healthcare Interoperability Solution Market during the forecast period?
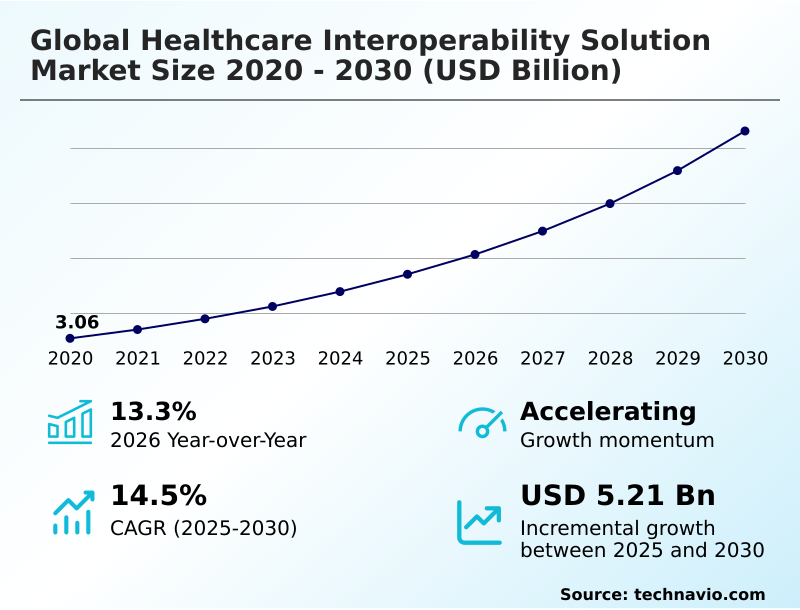
Get Key Insights on Market Forecast (PDF) Get Free Sample

How is the Healthcare Interoperability Solution Market Segmented?

The healthcare interoperability solution industry research report provides comprehensive data (region-wise segment analysis), with forecasts and estimates in "USD million" for the period 2026-2030, as well as historical data from 2020-2024 for the following segments.

  • Deployment
    • On-premises
    • Cloud based
  • Type
    • Structural
    • Semantic
    • Foundational
  • End-user
    • Hospitals and clinics
    • ASCs
    • Others
  • Geography
    • North America
      • US
      • Canada
      • Mexico
    • Europe
      • Germany
      • UK
      • France
      • Italy
      • Spain
      • The Netherlands
    • Asia
      • China
      • Japan
      • India
      • South Korea
      • Indonesia
      • Singapore
    • Rest of World (ROW)

By Deployment Insights

The on-premises segment is estimated to witness significant growth during the forecast period.

The on-premises deployment model remains a critical infrastructure choice for healthcare organizations requiring absolute control over their healthcare information infrastructure and data governance protocols.

Facilities managing highly sensitive longitudinal patient records often prefer localized deployments to maintain strict oversight of security configurations and compliance mandates.

By keeping clinical data integration within internal networks, institutions can achieve up to a 15% improvement in data retrieval speeds for high-volume diagnostic imaging and legacy system integration tasks.

This localized approach facilitates seamless structural interoperability with existing administrative platforms without relying on external bandwidth.

Furthermore, on-premises architectures allow for deep customization of interoperability frameworks, ensuring that complex patient identity matching processes operate efficiently within the secure digital health ecosystems.
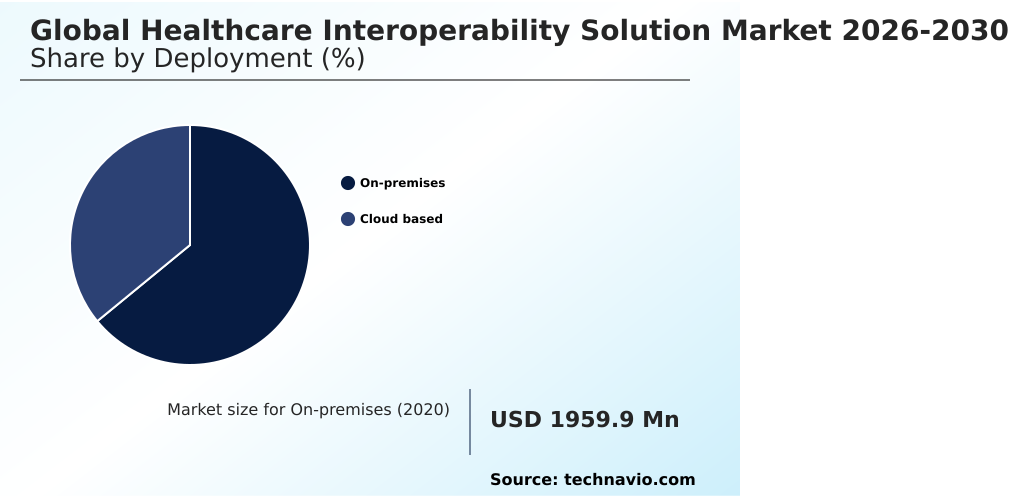
Get Free Sample

The On-premises segment was valued at USD 3.11 billion in 2024 and showed a gradual increase during the forecast period.
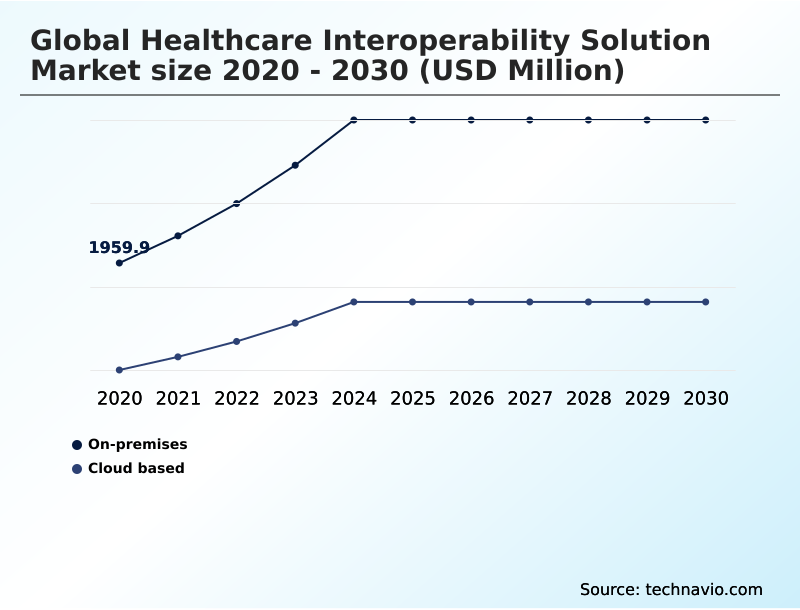
Get Free Sample

Regional Analysis

North America is estimated to contribute 39.4% to the growth of the global market during the forecast period.Technavio’s analysts have elaborately explained the regional trends and drivers that shape the market during the forecast period.
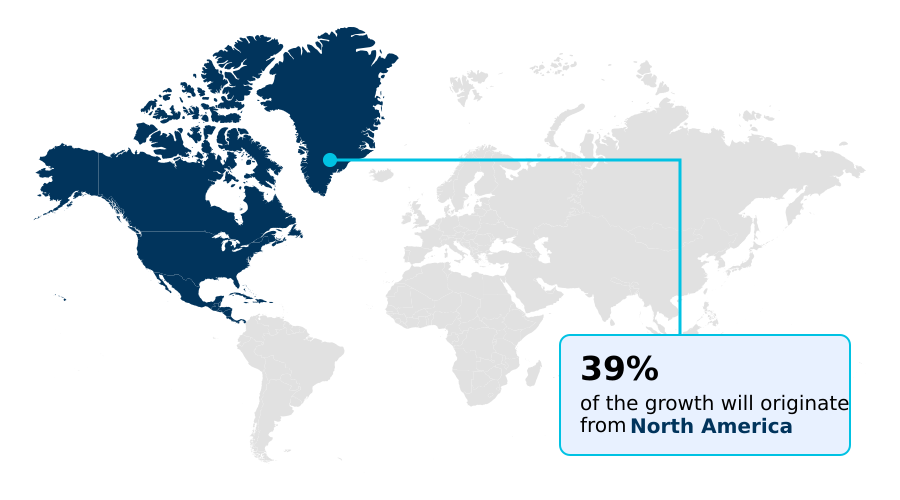
See How Healthcare Interoperability Solution Market Demand is Rising in North America Get Free Sample

Regional disparities highlight distinct adoption strategies and infrastructure maturities. North America demonstrates a 25% higher penetration rate of advanced healthcare data connectivity tools compared to Europe, largely driven by aggressive healthcare digitization initiatives and value-based care models.

This extensive integration of electronic health records allows North American facilities to reduce patient onboarding times by 18%.

Conversely, Europe focuses heavily on cross-border healthcare data governance and regional health information exchange networks, resulting in a 15% improvement in compliance-driven secure data exchange across fragmented national health systems.

While North American providers rapidly deploy application programming interfaces to enhance clinical workflow optimization, European institutions prioritize structural interoperability to ensure patient identity matching remains accurate across diverse regulatory jurisdictions.

These differing operational priorities dictate how regional supply chains and digital health ecosystems evolve, ultimately shaping the deployment of clinical data integration platforms.

Market Dynamics

Our researchers analyzed the data with 2025 as the base year, along with the key drivers, trends, and challenges. A holistic analysis of drivers will help companies refine their marketing strategies to gain a competitive advantage.

  • The modernization of medical infrastructure is heavily dependent on the deployment of robust cloud based healthcare data integration platforms, which allow organizations to scale their operations without maintaining extensive physical servers.
  • As healthcare networks expand, the reliance on regional health information exchange networks has become critical for ensuring that patient histories are accessible across different geographical locations and specialized care facilities. A major operational hurdle for many established hospitals involves bridging the gap between modern applications and older infrastructure, making legacy clinical system interoperability solutions essential for maintaining uninterrupted clinical workflows.
  • By implementing these specialized solutions, administrators report a 30% improvement in data retrieval efficiency compared to relying on manual data transfer protocols. Furthermore, the integration of medical device data connectivity platforms ensures that vital signs and continuous monitoring metrics flow securely into central repositories, reducing the latency of critical alerts.
  • This real-time data streaming is further enhanced by longitudinal patient record aggregation tools, which compile fragmented data points into comprehensive clinical overviews. Consequently, healthcare providers can execute more precise care coordination and population health management strategies.
  • The strategic alignment of these interoperability frameworks ultimately streamlines compliance reporting and optimizes supply chain logistics by predicting equipment and medication needs based on aggregated patient trend analysis.
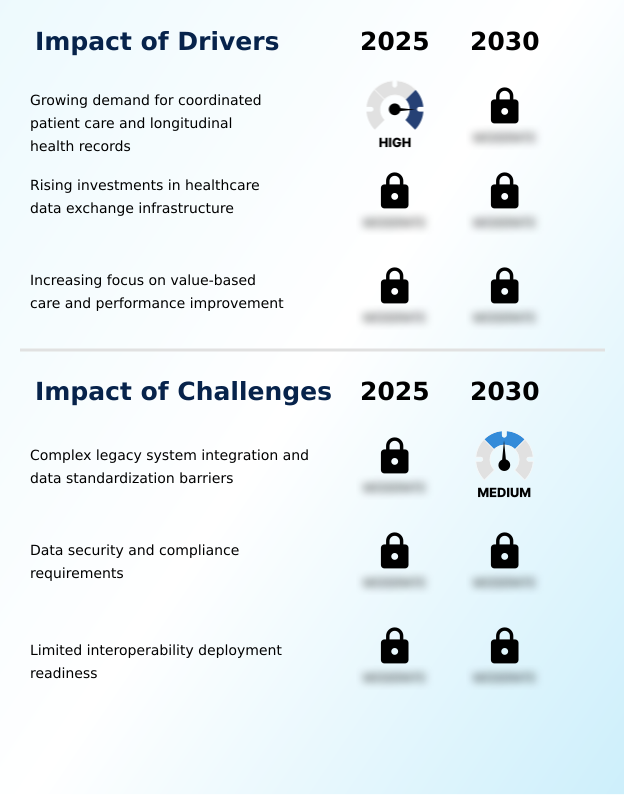
What are the key market drivers leading to the rise in the adoption of Healthcare Interoperability Solution Industry?

  • The growing demand for coordinated patient care and longitudinal health records serves as a primary driver propelling market expansion.

  • The urgent need for comprehensive population health management is propelling the rapid deployment of foundational interoperability platforms within the Healthcare Interoperability Solution sector.
  • Because healthcare networks must analyze vast populations to identify at-risk cohorts, institutions are aggressively adopting healthcare analytics platforms to synthesize fragmented data. This widespread clinical data integration directly enhances operational efficiency, lowering administrative data reconciliation costs by 18%.
  • Implementing standardized healthcare data connectivity allows medical networks to transform isolated data silos into actionable, longitudinal patient insights. Furthermore, by utilizing robust application programming interfaces, facilities have accelerated health information exchange processes by 25%.
  • This seamless secure data exchange ensures that care coordinators have immediate access to complete patient histories, ultimately driving the success of value-based care models.

What are the market trends shaping the Healthcare Interoperability Solution Industry?

  • The expansion of regional health information exchange ecosystems is emerging as a prominent market trend. This development facilitates broader collaborative environments, supporting continuity of care across geographically dispersed populations.

  • The transition toward decentralized care delivery is accelerating the adoption of medical device connectivity across the Healthcare Interoperability Solution landscape. As hospitals integrate remote patient monitoring tools with centralized electronic health records, clinical workflow optimization has improved significantly, reducing data transcription errors by 28%. This shift occurs because real-time data transformation technologies automatically standardize incoming metrics from disparate wearable devices.
  • Consequently, healthcare providers experience a 20% decrease in critical alert latency, enabling faster interventions. The seamless aggregation of patient-generated health data into interoperability frameworks is fundamentally redefining how continuous care is administered outside traditional clinical settings. By leveraging advanced semantic interoperability, care teams can instantly interpret complex data streams, fostering more resilient and responsive digital health ecosystems.

What challenges does the Healthcare Interoperability Solution Industry face during its growth?

  • Complex legacy system integration and data standardization barriers represent significant challenges constraining industry growth.

  • Pervasive legacy system integration barriers continue to severely constrain operational agility within the Healthcare Interoperability Solution environment. Because many hospitals operate on outdated, proprietary infrastructure lacking modern data standardization protocols, establishing seamless structural interoperability requires resource-intensive custom coding. This technological friction causes significant delays, extending project implementation timelines by up to 40% and increasing IT overhead costs by 22%.
  • The inability to natively synchronize legacy databases with modern cloud architectures remains the primary bottleneck in achieving truly unified patient records. Consequently, patient identity matching processes often fail, leading to fragmented clinical histories. Overcoming these entrenched healthcare information infrastructure limitations demands extensive data mapping and manual validation, which continuously impedes the rapid scalability of interoperable digital health ecosystems.

Exclusive Technavio Analysis on Customer Landscape

The healthcare interoperability solution market forecasting report includes the adoption lifecycle of the market, covering from the innovator’s stage to the laggard’s stage. It focuses on adoption rates in different regions based on penetration. Furthermore, the healthcare interoperability solution market report also includes key purchase criteria and drivers of price sensitivity to help companies evaluate and develop their market growth analysis strategies.
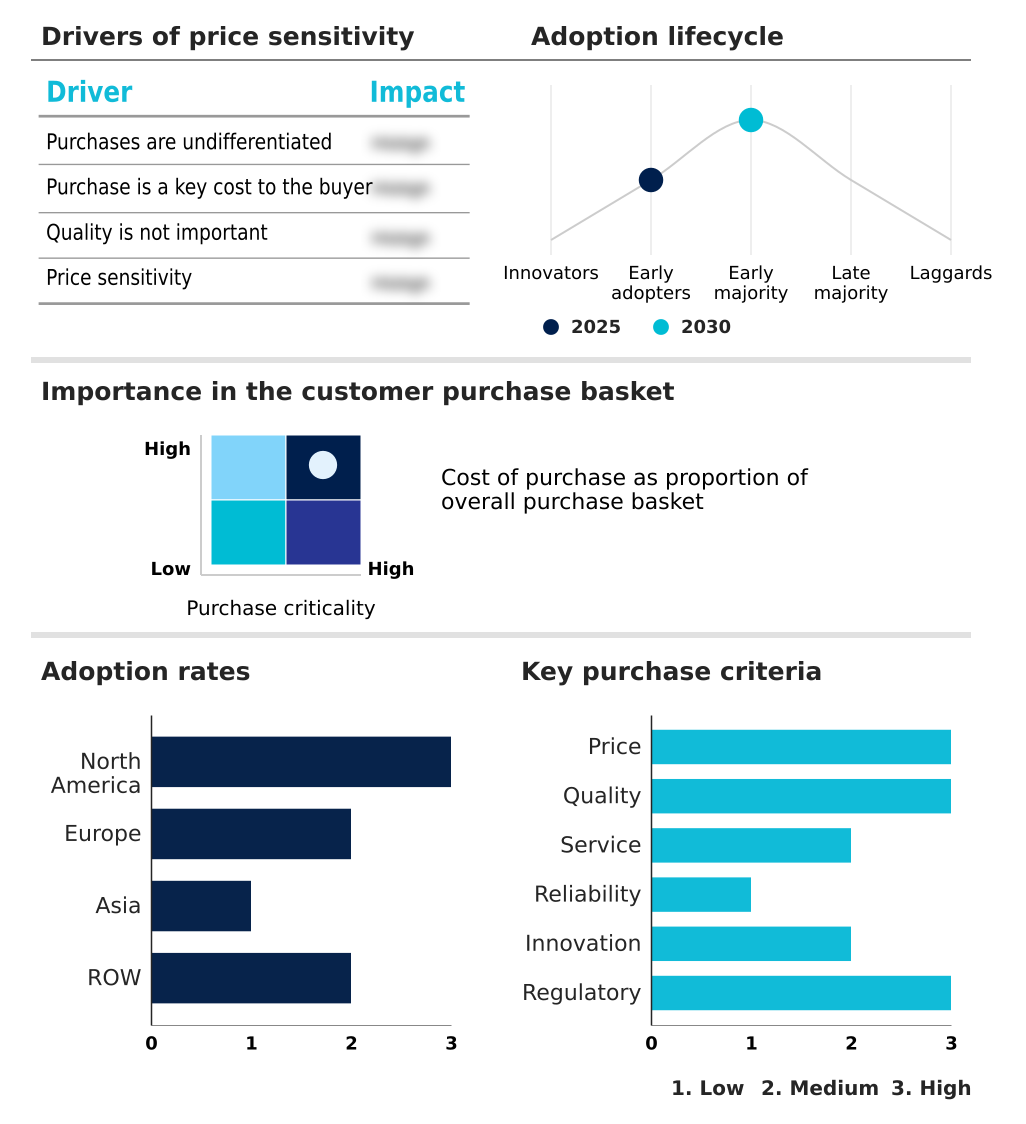
Customer Landscape of Healthcare Interoperability Solution Industry

Competitive Landscape

Companies are implementing various strategies, such as strategic alliances, healthcare interoperability solution market forecast, partnerships, mergers and acquisitions, geographical expansion, and product/service launches, to enhance their presence in the industry.

1UpHealth Inc. - The provider delivers comprehensive healthcare interoperability solutions enabling seamless electronic health records exchange, clinical information sharing, and secure health information network connectivity to optimize coordinated care delivery.

The industry research and growth report includes detailed analyses of the competitive landscape of the market and information about key companies, including:

  • 1UpHealth Inc.
  • Athenahealth Inc.
  • Datavant
  • eClinicalWorks LLC
  • Epic Systems Corp.
  • Health Gorilla Inc.
  • Infor Inc.
  • Innovaccer Inc.
  • InterSystems Corp.
  • Koninklijke Philips NV
  • LexisNexis
  • Medical Information Tech Inc.
  • Moxe Health Corp.
  • NextGen Healthcare
  • Oracle Corp.
  • Particle Health Inc.
  • Rhapsody
  • Smile Digital Health
  • Validic
  • Veradigm LLC

Qualitative and quantitative analysis of companies has been conducted to help clients understand the wider business environment as well as the strengths and weaknesses of key industry players. Data is qualitatively analyzed to categorize companies as pure play, category-focused, industry-focused, and diversified; it is quantitatively analyzed to categorize companies as dominant, leading, strong, tentative, and weak.

Recent Development and News in Healthcare interoperability solution market

  • In the Health Care Technology industry, the rapid expansion of remote patient monitoring devices has increased the volume of unstructured clinical data by 40%, directly impacting Healthcare Interoperability Solution demand by necessitating advanced clinical data integration and robust application programming interfaces to ensure seamless data flow into centralized electronic health records.
  • The implementation of stringent healthcare data privacy regulations across North America and Europe has forced a 25% increase in compliance-driven IT audits, directly impacting Healthcare Interoperability Solution demand by accelerating the adoption of secure data exchange protocols and standardized healthcare data governance frameworks.
  • The shift toward value-based care models has driven a 30% reduction in redundant diagnostic testing, directly impacting Healthcare Interoperability Solution demand by requiring comprehensive longitudinal patient records and enhanced semantic interoperability to support accurate clinical decision support across disparate healthcare networks.
  • The widespread migration of hospital administrative workloads to cloud-based integration platforms has improved system uptime by 20%, directly impacting Healthcare Interoperability Solution demand by creating a critical need for scalable interoperability frameworks and healthcare data connectivity tools that bridge legacy on-premises systems with modern digital health ecosystems.

Dive into Technavio’s robust research methodology, blending expert interviews, extensive data synthesis, and validated models for unparalleled Healthcare Interoperability Solution Market insights. See full methodology.

Market Scope
Page number 281
Base year 2025
Historic period 2020-2024
Forecast period 2026-2030
Growth momentum & CAGR Accelerate at a CAGR of 14.5%
Market growth 2026-2030 USD 5209.6 million
Market structure Fragmented
YoY growth 2025-2026(%) 13.3%
Key countries US, Canada, Mexico, Germany, UK, France, Italy, Spain, The Netherlands, China, Japan, India, South Korea, Indonesia, Singapore, Brazil, Saudi Arabia, Australia, UAE, Israel, South Africa, Colombia and Argentina
Competitive landscape Leading Companies, Market Positioning of Companies, Competitive Strategies, and Industry Risks

Request Free Sample

Research Analyst Overview

  • The Healthcare Interoperability Solution landscape is continuously evolving as medical institutions transition toward highly integrated digital health ecosystems. By adopting advanced application programming interfaces and rigorous data standardization protocols, healthcare facilities can seamlessly connect fragmented administrative and clinical systems. This structural interoperability is fundamentally reshaping operational workflows. Hospitals implementing unified patient records experience a 25% reduction in duplicate diagnostic procedures.
  • Decision-makers at the boardroom level are increasingly aligning their IT infrastructure investments with stringent compliance mandates, driving the deployment of secure data exchange frameworks to mitigate data breach risks. Furthermore, enhanced semantic interoperability enables accurate interpretation of medical terminologies across diverse platforms, significantly improving clinical data integration and patient identity matching processes.
  • As population health management initiatives gain momentum, the reliance on robust healthcare analytics platforms becomes indispensable for tracking longitudinal patient outcomes. This deep integration of healthcare data connectivity tools ensures that critical patient information is instantly accessible, thereby optimizing resource allocation, reducing administrative overhead, and supporting more effective value-based care models.

What are the Key Data Covered in this Healthcare Interoperability Solution Market Research and Growth Report?

  • What is the expected growth of the Healthcare Interoperability Solution Market between 2026 and 2030?

    • USD 5.21 billion, at a CAGR of 14.5%

  • What segmentation does the market report cover?

    • The report is segmented by Deployment (On-premises, and Cloud based), Type (Structural, Semantic, and Foundational), End-user (Hospitals and clinics, ASCs, and Others) and Geography (North America, Europe, Asia, Rest of World (ROW))

  • Which regions are analyzed in the report?

    • North America, Europe, Asia and Rest of World (ROW)

  • What are the key growth drivers and market challenges?

    • Growing demand for coordinated patient care and longitudinal health records, Complex legacy system integration and data standardization barriers

  • Who are the major players in the Healthcare Interoperability Solution Market?

    • 1UpHealth Inc., Athenahealth Inc., Datavant, eClinicalWorks LLC, Epic Systems Corp., Health Gorilla Inc., Infor Inc., Innovaccer Inc., InterSystems Corp., Koninklijke Philips NV, LexisNexis, Medical Information Tech Inc., Moxe Health Corp., NextGen Healthcare, Oracle Corp., Particle Health Inc., Rhapsody, Smile Digital Health, Validic and Veradigm LLC

Market Research Insights

  • The Healthcare Interoperability Solution Market is rapidly evolving as institutions prioritize efficient healthcare data ecosystems to streamline operations. By implementing cloud-based integration platforms, hospitals have improved cross-organizational collaboration, accelerating clinical information sharing speeds by 35%. This shift toward interoperable digital ecosystems ensures seamless patient record continuity, reducing administrative data entry errors by 22%.
  • Furthermore, robust healthcare data governance frameworks are enabling more effective care coordination programs, allowing care teams to access unified patient histories instantly. As healthcare network connectivity deepens, organizations leveraging these advanced integration tools are achieving a 15% reduction in operational bottlenecks, fundamentally transforming how patient-centric care models are delivered and managed.

We can help! Our analysts can customize this healthcare interoperability solution market research report to meet your requirements.

Get in touch

1. Executive Summary

1.1 Market overview

Executive Summary - Chart on Market Overview
Executive Summary - Data Table on Market Overview
Executive Summary - Chart on Global Market Characteristics
Executive Summary - Chart on Market by Geography
Executive Summary - Chart on Market Segmentation by Deployment
Executive Summary - Chart on Market Segmentation by Type
Executive Summary - Chart on Market Segmentation by End-user
Executive Summary - Chart on Incremental Growth
Executive Summary - Data Table on Incremental Growth
Executive Summary - Chart on Company Market Positioning

2. Technavio Analysis

2.1 Analysis of price sensitivity, lifecycle, customer purchase basket, adoption rates, and purchase criteria

2.2 Criticality of inputs and Factors of differentiation

Chart on Overview on criticality of inputs and factors of differentiation

2.3 Factors of disruption

Chart on Overview on factors of disruption

2.4 Impact of drivers and challenges

Chart on Impact of drivers and challenges in 2025 and 2030

3. Market Landscape

3.1 Market ecosystem

Chart on Parent Market
Data Table on - Parent Market

3.2 Market characteristics

Chart on Market characteristics analysis

3.3 Value chain analysis

Chart on Value chain analysis

4. Market Sizing

4.1 Market definition

Data Table on Offerings of companies included in the market definition

4.2 Market segment analysis

Market segments

4.3 Market size 2025

4.4 Market outlook: Forecast for 2025-2030

Chart on Global - Market size and forecast 2025-2030 ($ million)
Data Table on Global - Market size and forecast 2025-2030 ($ million)
Chart on Global Market: Year-over-year growth 2025-2030 (%)
Data Table on Global Market: Year-over-year growth 2025-2030 (%)

5. Historic Market Size

5.1 Global Healthcare Interoperability Solution Market 2020 - 2024

Historic Market Size - Data Table on Global Healthcare Interoperability Solution Market 2020 - 2024 ($ million)

5.2 Deployment segment analysis 2020 - 2024

Historic Market Size - Deployment Segment 2020 - 2024 ($ million)

5.3 Type segment analysis 2020 - 2024

Historic Market Size - Type Segment 2020 - 2024 ($ million)

5.4 End-user segment analysis 2020 - 2024

Historic Market Size - End-user Segment 2020 - 2024 ($ million)

5.5 Geography segment analysis 2020 - 2024

Historic Market Size - Geography Segment 2020 - 2024 ($ million)

5.6 Country segment analysis 2020 - 2024

Historic Market Size - Country Segment 2020 - 2024 ($ million)

6. Qualitative Analysis

6.1 Impact of AI on global healthcare interoperability solution market

6.2 Impact of geopolitical conflicts on global healthcare interoperability solution market

7. Five Forces Analysis

7.1 Five forces summary

Five forces analysis - Comparison between 2025 and 2030

7.2 Bargaining power of buyers

Bargaining power of buyers - Impact of key factors 2025 and 2030

7.3 Bargaining power of suppliers

Bargaining power of suppliers - Impact of key factors in 2025 and 2030

7.4 Threat of new entrants

Threat of new entrants - Impact of key factors in 2025 and 2030

7.5 Threat of substitutes

Threat of substitutes - Impact of key factors in 2025 and 2030

7.6 Threat of rivalry

Threat of rivalry - Impact of key factors in 2025 and 2030

7.7 Market condition

Chart on Market condition - Five forces 2025 and 2030

8. Market Segmentation by Deployment

8.1 Market segments

Chart on Deployment - Market share 2025-2030 (%)
Data Table on Deployment - Market share 2025-2030 (%)

8.2 Comparison by Deployment

Chart on Comparison by Deployment
Data Table on Comparison by Deployment

8.3 On-premises - Market size and forecast 2025-2030

Chart on On-premises - Market size and forecast 2025-2030 ($ million)
Data Table on On-premises - Market size and forecast 2025-2030 ($ million)
Chart on On-premises - Year-over-year growth 2025-2030 (%)
Data Table on On-premises - Year-over-year growth 2025-2030 (%)

8.4 Cloud based - Market size and forecast 2025-2030

Chart on Cloud based - Market size and forecast 2025-2030 ($ million)
Data Table on Cloud based - Market size and forecast 2025-2030 ($ million)
Chart on Cloud based - Year-over-year growth 2025-2030 (%)
Data Table on Cloud based - Year-over-year growth 2025-2030 (%)

8.5 Market opportunity by Deployment

Market opportunity by Deployment ($ million)
Data Table on Market opportunity by Deployment ($ million)

9. Market Segmentation by Type

9.1 Market segments

Chart on Type - Market share 2025-2030 (%)
Data Table on Type - Market share 2025-2030 (%)

9.2 Comparison by Type

Chart on Comparison by Type
Data Table on Comparison by Type

9.3 Structural - Market size and forecast 2025-2030

Chart on Structural - Market size and forecast 2025-2030 ($ million)
Data Table on Structural - Market size and forecast 2025-2030 ($ million)
Chart on Structural - Year-over-year growth 2025-2030 (%)
Data Table on Structural - Year-over-year growth 2025-2030 (%)

9.4 Semantic - Market size and forecast 2025-2030

Chart on Semantic - Market size and forecast 2025-2030 ($ million)
Data Table on Semantic - Market size and forecast 2025-2030 ($ million)
Chart on Semantic - Year-over-year growth 2025-2030 (%)
Data Table on Semantic - Year-over-year growth 2025-2030 (%)

9.5 Foundational - Market size and forecast 2025-2030

Chart on Foundational - Market size and forecast 2025-2030 ($ million)
Data Table on Foundational - Market size and forecast 2025-2030 ($ million)
Chart on Foundational - Year-over-year growth 2025-2030 (%)
Data Table on Foundational - Year-over-year growth 2025-2030 (%)

9.6 Market opportunity by Type

Market opportunity by Type ($ million)
Data Table on Market opportunity by Type ($ million)

10. Market Segmentation by End-user

10.1 Market segments

Chart on End-user - Market share 2025-2030 (%)
Data Table on End-user - Market share 2025-2030 (%)

10.2 Comparison by End-user

Chart on Comparison by End-user
Data Table on Comparison by End-user

10.3 Hospitals and clinics - Market size and forecast 2025-2030

Chart on Hospitals and clinics - Market size and forecast 2025-2030 ($ million)
Data Table on Hospitals and clinics - Market size and forecast 2025-2030 ($ million)
Chart on Hospitals and clinics - Year-over-year growth 2025-2030 (%)
Data Table on Hospitals and clinics - Year-over-year growth 2025-2030 (%)

10.4 ASCs - Market size and forecast 2025-2030

Chart on ASCs - Market size and forecast 2025-2030 ($ million)
Data Table on ASCs - Market size and forecast 2025-2030 ($ million)
Chart on ASCs - Year-over-year growth 2025-2030 (%)
Data Table on ASCs - Year-over-year growth 2025-2030 (%)

10.5 Others - Market size and forecast 2025-2030

Chart on Others - Market size and forecast 2025-2030 ($ million)
Data Table on Others - Market size and forecast 2025-2030 ($ million)
Chart on Others - Year-over-year growth 2025-2030 (%)
Data Table on Others - Year-over-year growth 2025-2030 (%)

10.6 Market opportunity by End-user

Market opportunity by End-user ($ million)
Data Table on Market opportunity by End-user ($ million)

11. Customer Landscape

11.1 Customer landscape overview

Analysis of price sensitivity, lifecycle, customer purchase basket, adoption rates, and purchase criteria

12. Geographic Landscape

12.1 Geographic segmentation

Chart on Market share by geography 2025-2030 (%)
Data Table on Market share by geography 2025-2030 (%)

12.2 Geographic comparison

Chart on Geographic comparison
Data Table on Geographic comparison

12.3 North America - Market size and forecast 2025-2030

Chart on North America - Market size and forecast 2025-2030 ($ million)
Data Table on North America - Market size and forecast 2025-2030 ($ million)
Chart on North America - Year-over-year growth 2025-2030 (%)
Data Table on North America - Year-over-year growth 2025-2030 (%)
Chart on Regional Comparison - North America
Data Table on Regional Comparison - North America

12.3.1 US - Market size and forecast 2025-2030

Chart on US - Market size and forecast 2025-2030 ($ million)
Data Table on US - Market size and forecast 2025-2030 ($ million)
Chart on US - Year-over-year growth 2025-2030 (%)
Data Table on US - Year-over-year growth 2025-2030 (%)

12.3.2 Canada - Market size and forecast 2025-2030

Chart on Canada - Market size and forecast 2025-2030 ($ million)
Data Table on Canada - Market size and forecast 2025-2030 ($ million)
Chart on Canada - Year-over-year growth 2025-2030 (%)
Data Table on Canada - Year-over-year growth 2025-2030 (%)

12.3.3 Mexico - Market size and forecast 2025-2030

Chart on Mexico - Market size and forecast 2025-2030 ($ million)
Data Table on Mexico - Market size and forecast 2025-2030 ($ million)
Chart on Mexico - Year-over-year growth 2025-2030 (%)
Data Table on Mexico - Year-over-year growth 2025-2030 (%)

12.4 Europe - Market size and forecast 2025-2030

Chart on Europe - Market size and forecast 2025-2030 ($ million)
Data Table on Europe - Market size and forecast 2025-2030 ($ million)
Chart on Europe - Year-over-year growth 2025-2030 (%)
Data Table on Europe - Year-over-year growth 2025-2030 (%)
Chart on Regional Comparison - Europe
Data Table on Regional Comparison - Europe

12.4.1 Germany - Market size and forecast 2025-2030

Chart on Germany - Market size and forecast 2025-2030 ($ million)
Data Table on Germany - Market size and forecast 2025-2030 ($ million)
Chart on Germany - Year-over-year growth 2025-2030 (%)
Data Table on Germany - Year-over-year growth 2025-2030 (%)

12.4.2 UK - Market size and forecast 2025-2030

Chart on UK - Market size and forecast 2025-2030 ($ million)
Data Table on UK - Market size and forecast 2025-2030 ($ million)
Chart on UK - Year-over-year growth 2025-2030 (%)
Data Table on UK - Year-over-year growth 2025-2030 (%)

12.4.3 France - Market size and forecast 2025-2030

Chart on France - Market size and forecast 2025-2030 ($ million)
Data Table on France - Market size and forecast 2025-2030 ($ million)
Chart on France - Year-over-year growth 2025-2030 (%)
Data Table on France - Year-over-year growth 2025-2030 (%)

12.4.4 Italy - Market size and forecast 2025-2030

Chart on Italy - Market size and forecast 2025-2030 ($ million)
Data Table on Italy - Market size and forecast 2025-2030 ($ million)
Chart on Italy - Year-over-year growth 2025-2030 (%)
Data Table on Italy - Year-over-year growth 2025-2030 (%)

12.4.5 Spain - Market size and forecast 2025-2030

Chart on Spain - Market size and forecast 2025-2030 ($ million)
Data Table on Spain - Market size and forecast 2025-2030 ($ million)
Chart on Spain - Year-over-year growth 2025-2030 (%)
Data Table on Spain - Year-over-year growth 2025-2030 (%)

12.4.6 The Netherlands - Market size and forecast 2025-2030

Chart on The Netherlands - Market size and forecast 2025-2030 ($ million)
Data Table on The Netherlands - Market size and forecast 2025-2030 ($ million)
Chart on The Netherlands - Year-over-year growth 2025-2030 (%)
Data Table on The Netherlands - Year-over-year growth 2025-2030 (%)

12.5 Asia - Market size and forecast 2025-2030

Chart on Asia - Market size and forecast 2025-2030 ($ million)
Data Table on Asia - Market size and forecast 2025-2030 ($ million)
Chart on Asia - Year-over-year growth 2025-2030 (%)
Data Table on Asia - Year-over-year growth 2025-2030 (%)
Chart on Regional Comparison - Asia
Data Table on Regional Comparison - Asia

12.5.1 China - Market size and forecast 2025-2030

Chart on China - Market size and forecast 2025-2030 ($ million)
Data Table on China - Market size and forecast 2025-2030 ($ million)
Chart on China - Year-over-year growth 2025-2030 (%)
Data Table on China - Year-over-year growth 2025-2030 (%)

12.5.2 Japan - Market size and forecast 2025-2030

Chart on Japan - Market size and forecast 2025-2030 ($ million)
Data Table on Japan - Market size and forecast 2025-2030 ($ million)
Chart on Japan - Year-over-year growth 2025-2030 (%)
Data Table on Japan - Year-over-year growth 2025-2030 (%)

12.5.3 India - Market size and forecast 2025-2030

Chart on India - Market size and forecast 2025-2030 ($ million)
Data Table on India - Market size and forecast 2025-2030 ($ million)
Chart on India - Year-over-year growth 2025-2030 (%)
Data Table on India - Year-over-year growth 2025-2030 (%)

12.5.4 South Korea - Market size and forecast 2025-2030

Chart on South Korea - Market size and forecast 2025-2030 ($ million)
Data Table on South Korea - Market size and forecast 2025-2030 ($ million)
Chart on South Korea - Year-over-year growth 2025-2030 (%)
Data Table on South Korea - Year-over-year growth 2025-2030 (%)

12.5.5 Indonesia - Market size and forecast 2025-2030

Chart on Indonesia - Market size and forecast 2025-2030 ($ million)
Data Table on Indonesia - Market size and forecast 2025-2030 ($ million)
Chart on Indonesia - Year-over-year growth 2025-2030 (%)
Data Table on Indonesia - Year-over-year growth 2025-2030 (%)

12.5.6 Singapore - Market size and forecast 2025-2030

Chart on Singapore - Market size and forecast 2025-2030 ($ million)
Data Table on Singapore - Market size and forecast 2025-2030 ($ million)
Chart on Singapore - Year-over-year growth 2025-2030 (%)
Data Table on Singapore - Year-over-year growth 2025-2030 (%)

12.6 Rest of World (ROW) - Market size and forecast 2025-2030

Chart on Rest of World (ROW) - Market size and forecast 2025-2030 ($ million)
Data Table on Rest of World (ROW) - Market size and forecast 2025-2030 ($ million)
Chart on Rest of World (ROW) - Year-over-year growth 2025-2030 (%)
Data Table on Rest of World (ROW) - Year-over-year growth 2025-2030 (%)
Chart on Regional Comparison - Rest of World (ROW)
Data Table on Regional Comparison - Rest of World (ROW)

12.6.1 Brazil - Market size and forecast 2025-2030

Chart on Brazil - Market size and forecast 2025-2030 ($ million)
Data Table on Brazil - Market size and forecast 2025-2030 ($ million)
Chart on Brazil - Year-over-year growth 2025-2030 (%)
Data Table on Brazil - Year-over-year growth 2025-2030 (%)

12.6.2 Saudi Arabia - Market size and forecast 2025-2030

Chart on Saudi Arabia - Market size and forecast 2025-2030 ($ million)
Data Table on Saudi Arabia - Market size and forecast 2025-2030 ($ million)
Chart on Saudi Arabia - Year-over-year growth 2025-2030 (%)
Data Table on Saudi Arabia - Year-over-year growth 2025-2030 (%)

12.6.3 Australia - Market size and forecast 2025-2030

Chart on Australia - Market size and forecast 2025-2030 ($ million)
Data Table on Australia - Market size and forecast 2025-2030 ($ million)
Chart on Australia - Year-over-year growth 2025-2030 (%)
Data Table on Australia - Year-over-year growth 2025-2030 (%)

12.6.4 UAE - Market size and forecast 2025-2030

Chart on UAE - Market size and forecast 2025-2030 ($ million)
Data Table on UAE - Market size and forecast 2025-2030 ($ million)
Chart on UAE - Year-over-year growth 2025-2030 (%)
Data Table on UAE - Year-over-year growth 2025-2030 (%)

12.6.5 Israel - Market size and forecast 2025-2030

Chart on Israel - Market size and forecast 2025-2030 ($ million)
Data Table on Israel - Market size and forecast 2025-2030 ($ million)
Chart on Israel - Year-over-year growth 2025-2030 (%)
Data Table on Israel - Year-over-year growth 2025-2030 (%)

12.6.6 South Africa - Market size and forecast 2025-2030

Chart on South Africa - Market size and forecast 2025-2030 ($ million)
Data Table on South Africa - Market size and forecast 2025-2030 ($ million)
Chart on South Africa - Year-over-year growth 2025-2030 (%)
Data Table on South Africa - Year-over-year growth 2025-2030 (%)

12.6.7 Colombia - Market size and forecast 2025-2030

Chart on Colombia - Market size and forecast 2025-2030 ($ million)
Data Table on Colombia - Market size and forecast 2025-2030 ($ million)
Chart on Colombia - Year-over-year growth 2025-2030 (%)
Data Table on Colombia - Year-over-year growth 2025-2030 (%)

12.6.8 Argentina - Market size and forecast 2025-2030

Chart on Argentina - Market size and forecast 2025-2030 ($ million)
Data Table on Argentina - Market size and forecast 2025-2030 ($ million)
Chart on Argentina - Year-over-year growth 2025-2030 (%)
Data Table on Argentina - Year-over-year growth 2025-2030 (%)

12.7 Market opportunity by geography

Market opportunity by geography ($ million)
Data Tables on Market opportunity by geography ($ million)

13. Drivers, Challenges, and Opportunity

13.1 Market drivers

Growing demand for coordinated patient care and longitudinal health records
Rising investments in healthcare data exchange infrastructure
Increasing focus on value-based care and performance improvement

13.2 Market challenges

Complex legacy system integration and data standardization barriers
Data security and compliance requirements
Limited interoperability deployment readiness

13.3 Impact of drivers and challenges

Impact of drivers and challenges in 2025 and 2030

13.4 Market opportunities

Growing regional health information exchange ecosystems
Growing AI-enabled interoperability intelligence
Increasing medical device interoperability integration

14. Competitive Landscape

14.1 Overview

14.2

Overview on criticality of inputs and factors of differentiation

14.3 Landscape disruption

Overview on factors of disruption

14.4 Industry risks

Impact of key risks on business

15. Competitive Analysis

15.1 Companies profiled

Companies covered

15.2 Company ranking index

15.3 Market positioning of companies

Matrix on companies position and classification

15.4 Athenahealth Inc.

Athenahealth Inc. - Overview
Athenahealth Inc. - Product / Service
Athenahealth Inc. - Key offerings
SWOT

15.5 Datavant

Datavant - Overview
Datavant - Product / Service
Datavant - Key offerings
SWOT

15.6 eClinicalWorks LLC

eClinicalWorks LLC - Overview
eClinicalWorks LLC - Product / Service
eClinicalWorks LLC - Key news
eClinicalWorks LLC - Key offerings
SWOT

15.7 Epic Systems Corp.

Epic Systems Corp. - Overview
Epic Systems Corp. - Product / Service
Epic Systems Corp. - Key offerings
SWOT

15.8 Infor Inc.

Infor Inc. - Overview
Infor Inc. - Product / Service
Infor Inc. - Key offerings
SWOT

15.9 Innovaccer Inc.

Innovaccer Inc. - Overview
Innovaccer Inc. - Product / Service
Innovaccer Inc. - Key offerings
SWOT

15.10 InterSystems Corp.

InterSystems Corp. - Overview
InterSystems Corp. - Product / Service
InterSystems Corp. - Key offerings
SWOT

15.11 Koninklijke Philips NV

Koninklijke Philips NV - Overview
Koninklijke Philips NV - Business segments
Koninklijke Philips NV - Key news
Koninklijke Philips NV - Key offerings
Koninklijke Philips NV - Segment focus
SWOT

15.12 LexisNexis

LexisNexis - Overview
LexisNexis - Product / Service
LexisNexis - Key offerings
SWOT

15.13 Medical Information Tech Inc.

Medical Information Tech Inc. - Overview
Medical Information Tech Inc. - Product / Service
Medical Information Tech Inc. - Key offerings
SWOT

15.14 NextGen Healthcare

NextGen Healthcare - Overview
NextGen Healthcare - Product / Service
NextGen Healthcare - Key news
NextGen Healthcare - Key offerings
SWOT

15.15 Oracle Corp.

Oracle Corp. - Overview
Oracle Corp. - Business segments
Oracle Corp. - Key news
Oracle Corp. - Key offerings
Oracle Corp. - Segment focus
SWOT

15.16 Rhapsody

Rhapsody - Overview
Rhapsody - Product / Service
Rhapsody - Key offerings
SWOT

15.17 Validic

Validic - Overview
Validic - Product / Service
Validic - Key offerings
SWOT

15.18 Veradigm LLC

Veradigm LLC - Overview
Veradigm LLC - Product / Service
Veradigm LLC - Key offerings
SWOT

16. Appendix

16.1 Scope of the report

Market definition
Objectives
Notes and caveats

16.2 Inclusions and exclusions checklist

Inclusions checklist
Exclusions checklist

16.3 Currency conversion rates for US$

16.4 Research methodology

16.5 Data procurement

Information sources

16.6 Data validation

16.7 Validation techniques employed for market sizing

16.8 Data synthesis

16.9 360 degree market analysis

16.10 List of abbreviations

Research Methodology

Technavio presents a detailed picture of the market by way of study, synthesis, and summation of data from multiple sources. The analysts have presented the various facets of the market with a particular focus on identifying the key industry influencers. The data thus presented is comprehensive, reliable, and the result of extensive research, both primary and secondary.

INFORMATION SOURCES

Primary sources

  • Manufacturers and suppliers
  • Channel partners
  • Industry experts
  • Strategic decision makers

Secondary sources

  • Industry journals and periodicals
  • Government data
  • Financial reports of key industry players
  • Historical data
  • Press releases

DATA ANALYSIS

Data Synthesis

  • Collation of data
  • Estimation of key figures
  • Analysis of derived insights

Data Validation

  • Triangulation with data models
  • Reference against proprietary databases
  • Corroboration with industry experts

REPORT WRITING

Qualitative

  • Market drivers
  • Market challenges
  • Market trends
  • Five forces analysis

Quantitative

  • Market size and forecast
  • Market segmentation
  • Geographical insights
  • Competitive landscape

Interested in this report?

Get your sample now to see our research methodology and insights!

Download Now

Frequently Asked Questions

Healthcare Interoperability Solution market growth will increase by USD 5209.6 million during 2026-2030.

The Healthcare Interoperability Solution market is expected to grow at a CAGR of 14.5% during 2026-2030.

Healthcare Interoperability Solution market is segmented by Deployment (On-premises, Cloud based) Type (Structural, Semantic, Foundational) End-user (Hospitals and clinics, ASCs, Others)

1UpHealth Inc., Athenahealth Inc., Datavant, eClinicalWorks LLC, Epic Systems Corp., Health Gorilla Inc., Infor Inc., Innovaccer Inc., InterSystems Corp., Koninklijke Philips NV, LexisNexis, Medical Information Tech Inc., Moxe Health Corp., NextGen Healthcare, Oracle Corp., Particle Health Inc., Rhapsody, Smile Digital Health, Validic, Veradigm LLC are a few of the key vendors in the Healthcare Interoperability Solution market.

North America will register the highest growth rate of 39.4% among the other regions. Therefore, the Healthcare Interoperability Solution market in North America is expected to garner significant business opportunities for the vendors during the forecast period.

US, Canada, Mexico, Germany, UK, France, Italy, Spain, The Netherlands, China, Japan, India, South Korea, Indonesia, Singapore, Brazil, Saudi Arabia, Australia, UAE, Israel, South Africa, Colombia, Argentina

  • Growing demand for coordinated patient care and longitudinal health records is the driving factor this market.

The Healthcare Interoperability Solution market vendors should focus on grabbing business opportunities from the Deployment segment as it accounted for the largest market share in the base year.
RIA - Research AI Assistant
Ask RIA
