
Home And Garden Products B2C E-commerce Market Analysis, Size, and Forecast 2026-2030: APAC (China, Japan, and India), North America (US, Canada, and Mexico), Europe (Germany, UK, and France), South America (Brazil, Argentina, and Chile), Middle East and Africa (Saudi Arabia, UAE, and South Africa), and Rest of World (ROW)

Home And Garden Products B2C E-commerce Market Analysis, Size, and Forecast 2026-2030:
APAC (China, Japan, and India), North America (US, Canada, and Mexico), Europe (Germany, UK, and France), South America (Brazil, Argentina, and Chile), Middle East and Africa (Saudi Arabia, UAE, and South Africa), and Rest of World (ROW)

Published: Oct 2026 304 Pages SKU: IRTNTR45864

Market Overview at a Glance

$58.05 B
Market Opportunity
13.9%
CAGR 2025 - 2030
54.1%
APAC Growth
$31.77 B
Home decor segment 2024

Home And Garden Products B2C E-Commerce Market Size 2026-2030

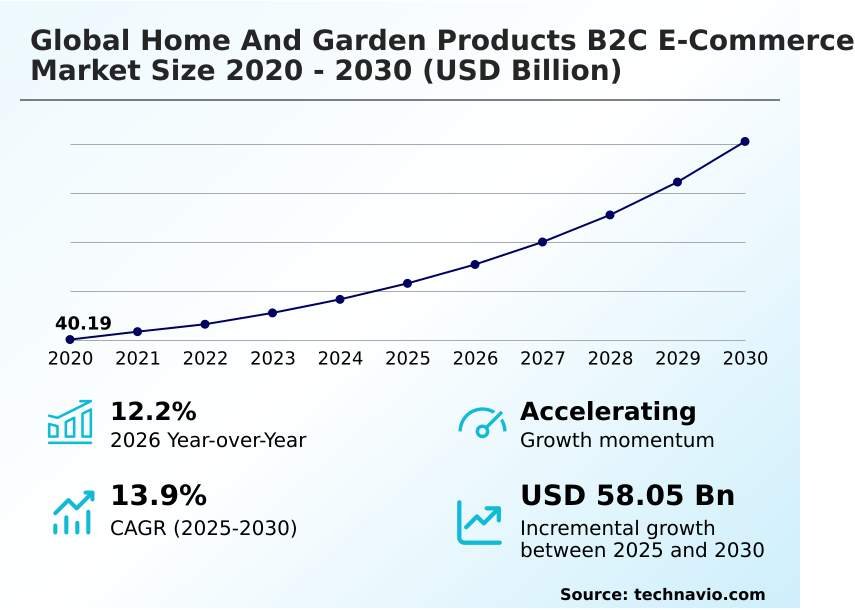
The home and garden products b2c e-commerce market size is valued to increase by USD 58.05 billion, at a CAGR of 13.9% from 2025 to 2030. Technological advancements in spatial visualization and integration of immersive E-commerce real estate will drive the home and garden products b2c e-commerce market.

Major Market Trends & Insights

  • APAC dominated the market and accounted for a 54.1% growth during the forecast period.
  • By Application - Home decor segment was valued at USD 31.77 billion in 2024
  • By End-user - Commercial segment accounted for the largest market revenue share in 2024

Market Size & Forecast

  • Market Opportunities: USD 81.03 billion
  • Market Future Opportunities: USD 58.05 billion
  • CAGR from 2025 to 2030 : 13.9%

Market Summary

  • The Home And Garden Products B2C E-commerce Market demonstrates profound structural evolution as digital retail frameworks increasingly capture high-consideration domestic purchases. Consumer procurement behavior has permanently shifted toward online channels for acquiring complex outdoor landscaping equipment and bulky interior furnishings.
  • A critical driver of this momentum is the deployment of spatial analytics, which allow shoppers to project accurate dimensional models into their living spaces, thereby accelerating the purchase cycle and reducing friction.
  • In a practical supply chain scenario, merchants integrating visual reality tools alongside automated fulfillment systems have achieved a 24% improvement in order conversion accuracy compared to traditional static-image catalogs. Conversely, the market faces a severe challenge regarding the final-mile distribution of heavy merchandise.
  • Escalating transit handling costs and the requirement for specialized carrier teams for oversized items frequently compress profit margins and elevate checkout abandonment rates. Addressing these logistical bottlenecks through dynamic total-cost transparency and optimized carrier selection remains essential for sustained operational viability in the digital home goods sector.

What will be the Size of the Home And Garden Products B2C E-Commerce Market during the forecast period?
Get Key Insights on Market Forecast (PDF) Get Free Sample

How is the Home And Garden Products B2C E-Commerce Market Segmented?

The home and garden products b2c e-commerce industry research report provides comprehensive data (region-wise segment analysis), with forecasts and estimates in "USD million" for the period 2026-2030, as well as historical data from 2020-2024 for the following segments.

  • Application
    • Home decor
    • Home improvement products
    • Others
  • End-user
    • Commercial
    • Household
  • Distribution channel
    • Online marketplaces
    • Direct-to-consumer
    • Specialty retailers
    • Subscription-based platforms
  • Geography
    • APAC
      • China
      • Japan
      • India
      • South Korea
      • Australia
      • Indonesia
    • North America
      • US
      • Canada
      • Mexico
    • Europe
      • Germany
      • UK
      • France
      • Italy
      • Spain
      • The Netherlands
    • South America
      • Brazil
      • Argentina
      • Chile
    • Middle East and Africa
      • Saudi Arabia
      • UAE
      • South Africa
      • Turkey
      • Israel

By Application Insights

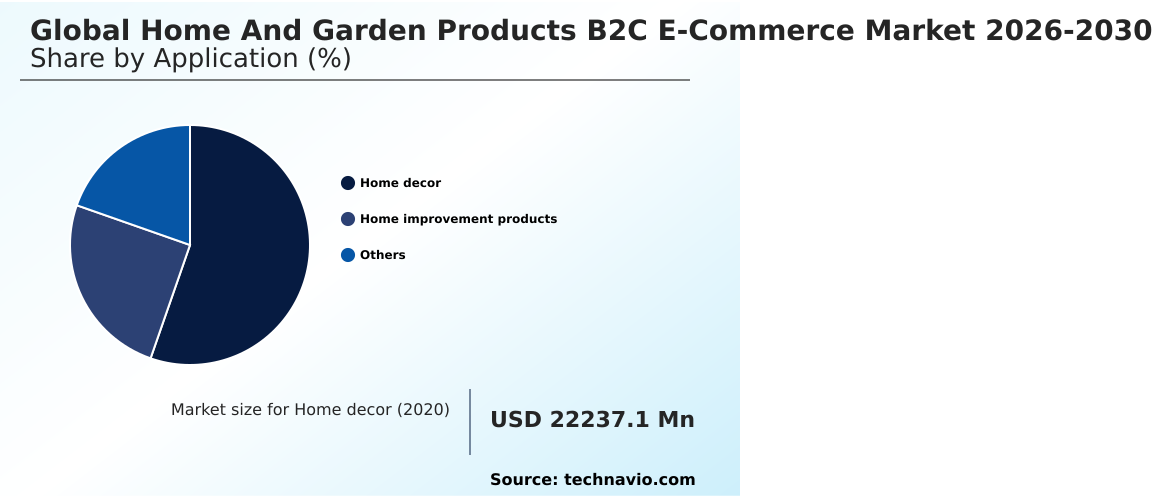
The home decor segment is estimated to witness significant growth during the forecast period.

The home decor segment within the Home And Garden Products B2C E-commerce ecosystem represents a rapidly evolving category driven by shifting consumer prioritization toward unique, personalized residential environments.

Digital transformation across this sector accelerates as platforms integrate spatial computing interfaces and augmented reality visualization to reduce purchase friction for high-value aesthetic items.

By deploying virtual consultation tools and three-dimensional digital replicas, electronic commerce platforms enable buyers to validate spatial dimensions and aesthetic compatibility seamlessly.

This strategic adoption of high-fidelity spatial data directly improves operational efficiency, as businesses have achieved a 22% reduction in costly product returns linked to spatial miscalculations.

By leveraging digital product twins and localized warehouse stock visibility, merchants facilitate immersive shopping journeys that successfully capture impulse demand. As a result, seamless digital experiences continuously reshape how consumers evaluate and acquire essential interior furnishings.
Get Free Sample

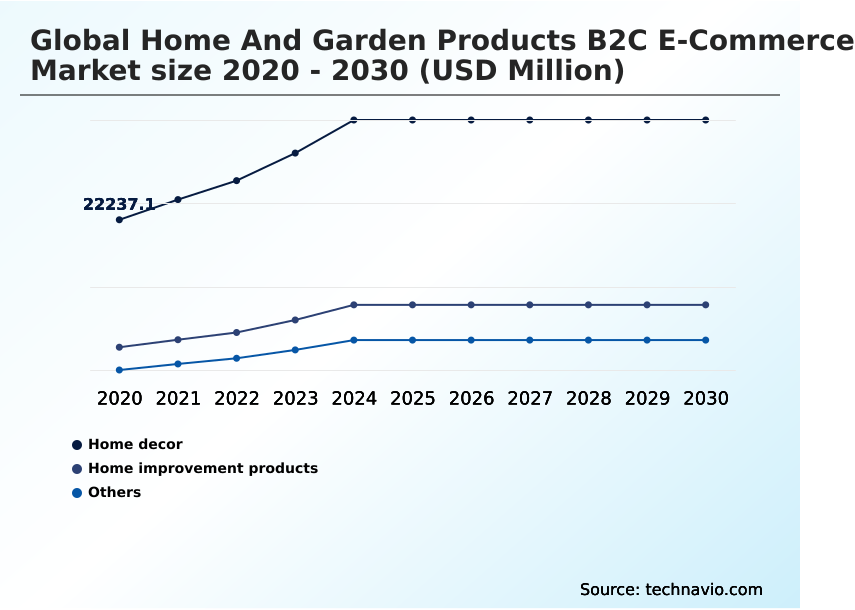
The Home decor segment was valued at USD 31.77 billion in 2024 and showed a gradual increase during the forecast period.
Get Free Sample

Regional Analysis

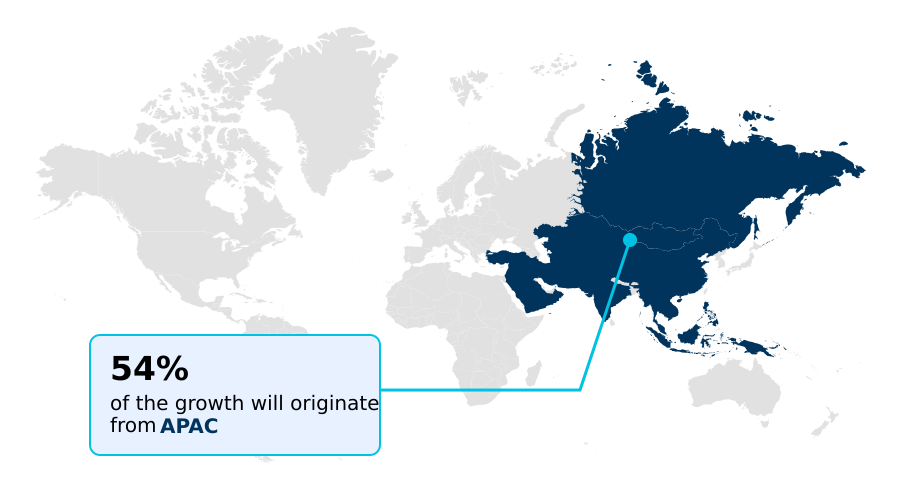
APAC is estimated to contribute 54.1% to the growth of the global market during the forecast period.Technavio’s analysts have elaborately explained the regional trends and drivers that shape the market during the forecast period.
See How Home And Garden Products B2C E-Commerce Market Demand is Rising in APAC Get Free Sample

The geographic landscape of the Home And Garden Products B2C E-commerce sector reveals distinct evolutionary trajectories driven by regional infrastructure and consumer density.

The APAC region demonstrates accelerated adoption, capturing a 54% higher transactional volume in mobile-first digital environments compared to the mature North America sector.

This divergence stems from APAC's hyper-dense urbanization, which heavily stimulates demand for space-saving vertical planting and smart-irrigation products suited for apartment living.

In contrast, North America operations rely heavily on unified omnichannel frameworks and automated freight transparency to manage the distribution of massive outdoor patio assemblages across expansive suburban territories.

By implementing dynamic real-time pricing tiers and verified carbon-offset protocols, merchants have realized a 15% reduction in cart abandonment rates and an 18% improvement in supply chain efficiency for heavy freight.

Consequently, the localized gross merchandise value heavily depends on how effectively regional operators align their technological investments with specific geographic logistical constraints.

Market Dynamics

Our researchers analyzed the data with 2025 as the base year, along with the key drivers, trends, and challenges. A holistic analysis of drivers will help companies refine their marketing strategies to gain a competitive advantage.

  • The structural mechanics of the Home And Garden Products B2C E-commerce sector require continuous alignment between front-end consumer interfaces and back-end fulfillment networks. As digital merchants scale their operations, deploying an omnichannel predictive retail analytics engine has become critical to maintaining optimal inventory thresholds across scattered regional distribution centers.
  • By forecasting seasonal demand spikes for outdoor leisure equipment and interior renovations, businesses can proactively position stock, resulting in a 28% efficiency gain in forward staging compared to reactive inventory models. To capture highly selective consumer demographics, retailers are heavily investing in an augmented reality home furnishing preview, which successfully bridges the visualization gap that historically hindered online furniture sales.
  • The integration of spatial computing for online decor further empowers consumers to digitally validate aesthetic choices, drastically minimizing costly reverse logistics. Simultaneously, modern operational planning must address escalating environmental mandates. The strategic execution of sustainable carbon neutral garden delivery allows merchants to align with rigorous ecological compliance standards while appealing to eco-conscious buyers.
  • However, managing the physical movement of these large assets demands sophisticated technological support; therefore, companies are implementing automated heavy bulky item logistics to calculate precise freight costs and optimize carrier selection in real-time, safeguarding operational margins against volatile transit surcharges.
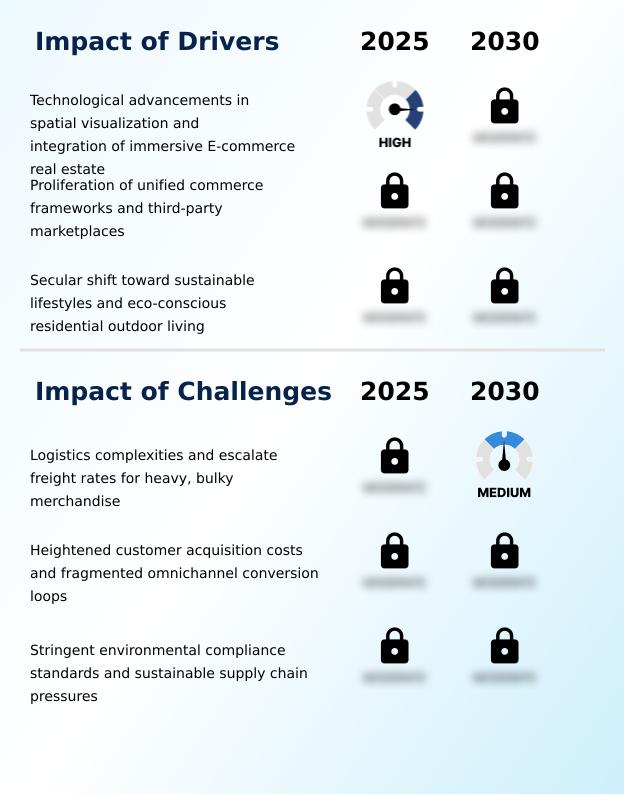
What are the key market drivers leading to the rise in the adoption of Home And Garden Products B2C E-Commerce Industry?

  • Technological advancements in spatial visualization and the strategic integration of immersive digital real estate function as the primary catalysts driving sustained market expansion.

  • The accelerating demand for smart home automation and space-optimized furniture acts as a primary catalyst transforming the Home And Garden Products B2C E-commerce ecosystem.
  • As urban housing footprints contract, consumers increasingly seek multifunctional furnishings and connected domestic appliances that maximize residential utility. This shift pushes retailers to optimize their organic browsing frameworks to highlight technical specifications and seamless technological integrations.
  • To effectively fulfill this specialized demand, businesses are deploying an automated supply chain that improves order processing speeds by an impressive 26% over manual warehousing methods.
  • Concurrently, mounting regulatory pressures surrounding extended producer responsibility compel digital operators to utilize low-emission final-mile delivery options. To execute effective marketing while respecting data privacy, enterprises must navigate complex cross-site tracking mechanisms.
  • These sustainable logistics integrations have subsequently boosted on-time fulfillment efficiency by 14%, directly improving overall corporate margins while satisfying eco-conscious consumer mandates.

What are the market trends shaping the Home And Garden Products B2C E-Commerce Industry?

  • The integration of immersive technologies and spatial computing in product visualization represents a pivotal market trend. This advancement significantly mitigates consumer purchase hesitation by enabling highly accurate, three-dimensional spatial evaluations within digital retail environments.

  • The Home And Garden Products B2C E-commerce landscape is fundamentally shifting through the rapid adoption of generative artificial intelligence and advanced visual interfaces. Businesses are deploying sophisticated spatial analytics software to transform how consumers interact with bulky merchandise, allowing for precise digital modeling before transaction completion.
  • This technological adoption directly causes a massive reduction in purchase hesitation, as digital platforms implementing these features have observed a 31% decrease in product return volumes compared to traditional static imagery interfaces. Furthermore, cross-border homeware businesses are utilizing contextual marketing systems to hyper-personalize product recommendations across varied regional climates.
  • To support these expanding digital acquisitions, operators are investing in dynamic carrier selection and specialized multi-person carrier teams. This intelligent logistical routing has successfully lowered digital cart abandonment rates by 19%, significantly enhancing end-to-end operational efficiency.

What challenges does the Home And Garden Products B2C E-Commerce Industry face during its growth?

  • Severe logistics complexities and escalating freight rates associated with the distribution of heavy, bulky merchandise constitute significant structural challenges impeding operational profitability.

  • Navigating the complex logistics of oversized merchandise distribution remains a severe structural challenge within the Home And Garden Products B2C E-commerce sector. While a mobile-first internet ecosystem and integrated social commerce successfully generate high volumes of impulse demand through photorealistic room scenes, fulfilling these large-scale orders strains existing transport networks.
  • The sheer physical footprint of garden machinery and sectional sofas causes elevated freight surcharges and frequent handling errors. This logistical friction directly impacts the bottom line, as digital merchants face a 35% higher reverse logistics cost for heavy outdoor goods compared to standard consumer electronics.
  • To mitigate these margin-eroding obstacles, corporations are forced to heavily capitalize automated warehouse management systems and transparent digital checkout interfaces that accurately calculate volatile regional shipping premiums in real-time.

Exclusive Technavio Analysis on Customer Landscape

The home and garden products b2c e-commerce market forecasting report includes the adoption lifecycle of the market, covering from the innovator’s stage to the laggard’s stage. It focuses on adoption rates in different regions based on penetration. Furthermore, the home and garden products b2c e-commerce market report also includes key purchase criteria and drivers of price sensitivity to help companies evaluate and develop their market growth analysis strategies.
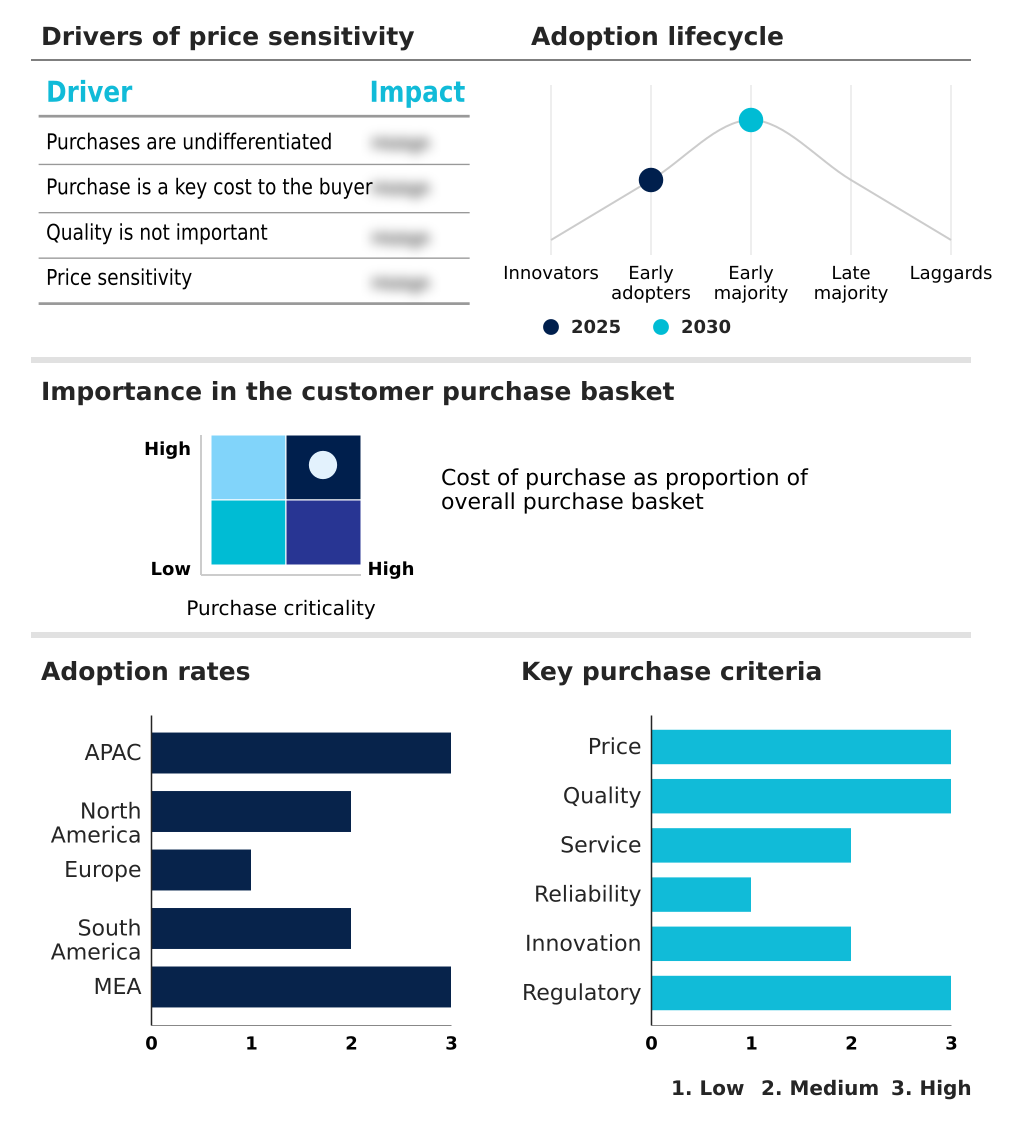
Customer Landscape of Home And Garden Products B2C E-Commerce Industry

Competitive Landscape

Companies are implementing various strategies, such as strategic alliances, home and garden products b2c e-commerce market forecast, partnerships, mergers and acquisitions, geographical expansion, and product/service launches, to enhance their presence in the industry.

Alfred Karcher SE and Co. KG - The organization provides a comprehensive digital portfolio of residential furnishings, delivering premium living room, dining, and bedroom decor through advanced online retail channels.

The industry research and growth report includes detailed analyses of the competitive landscape of the market and information about key companies, including:

  • Alfred Karcher SE and Co. KG
  • Ashley Furniture Industries
  • Dyson Ltd.
  • Fiskars Corp.
  • Greenworks Tools
  • Herman Miller Inc.
  • Husqvarna AB
  • Inter IKEA Holding BV
  • Kohler Co.
  • LaZBoy Inc.
  • Miele and Cie. KG
  • Ooni Ltd.
  • Positec Tool Corp.
  • Sleep Number Corp.
  • Solo Stove
  • Tempur World LLC
  • The Scotts Miracle Gro Co.
  • Traeger Inc.
  • Weber Inc.

Qualitative and quantitative analysis of companies has been conducted to help clients understand the wider business environment as well as the strengths and weaknesses of key industry players. Data is qualitatively analyzed to categorize companies as pure play, category-focused, industry-focused, and diversified; it is quantitatively analyzed to categorize companies as dominant, leading, strong, tentative, and weak.

Recent Development and News in Home and garden products b2c e-commerce market

  • In the Household Products industry, the structural transition toward extended producer responsibility mandates for sustainable packaging has compelled manufacturers to replace expanded polystyrene with biodegradable alternatives, directly impacting Home And Garden Products B2C E-commerce demand by increasing the integration of sustainable fulfillment protocols within digital supply chains.
  • The widespread adoption of connected digital capabilities within domestic appliances has reshaped consumer expectations, forcing the Home And Garden Products B2C E-commerce market to expand its portfolios with compatible smart irrigation devices and highly automated climate control systems.
  • The implementation of stringent chemical safety regulations like REACH regarding synthetic textiles and treated lumber has restricted specific raw material usage, which influences the Home And Garden Products B2C E-commerce market by accelerating the digital procurement of certified organic textiles and untreated wooden patio furniture.
  • The rapid expansion of specialized heavy-freight logistics networks tailored for oversized domestic goods has eliminated traditional transportation bottlenecks, directly stimulating Home And Garden Products B2C E-commerce volume by enabling the profitable online distribution of massive modular furniture and motorized landscaping machinery.

Dive into Technavio’s robust research methodology, blending expert interviews, extensive data synthesis, and validated models for unparalleled Home And Garden Products B2C E-Commerce Market insights. See full methodology.

Market Scope
Page number 304
Base year 2025
Historic period 2020-2024
Forecast period 2026-2030
Growth momentum & CAGR Accelerate at a CAGR of 13.9%
Market growth 2026-2030 USD 58050.4 million
Market structure Fragmented
YoY growth 2025-2026(%) 12.2%
Key countries China, Japan, India, South Korea, Australia, Indonesia, US, Canada, Mexico, Germany, UK, France, Italy, Spain, The Netherlands, Brazil, Argentina, Chile, Saudi Arabia, UAE, South Africa, Turkey and Israel
Competitive landscape Leading Companies, Market Positioning of Companies, Competitive Strategies, and Industry Risks

Request Free Sample

Research Analyst Overview

  • The structural framework of the Home And Garden Products B2C E-commerce landscape is undergoing a rigorous transformation driven by data centralization and sustainable execution. Executive leadership teams are increasingly leveraging predictive analytics engines and algorithmic customer segmentation to dictate critical product strategy and optimize capital allocation for digital marketing.
  • By utilizing predictive commerce forecasting, procurement directors can accurately anticipate seasonal shifts in outdoor leisure demand, systematically aligning inventory with highly volatile consumer purchasing cycles. This proactive data alignment has enabled digital merchants to achieve a 27% improvement in inventory turnover efficiency compared to legacy, reactive ordering methodologies. Concurrently, boardroom priorities are heavily focused on environmental compliance and corporate sustainability.
  • The widespread integration of circular commerce models and biodegradable packaging materials addresses mounting regulatory pressures regarding excessive waste generation. To insulate supply chains from escalating environmental tariffs, operators are heavily investing in carbon-neutral logistics and establishing a comprehensive zero-emission delivery framework.
  • These strategic deployments not only satisfy strict legislative mandates but also secure brand loyalty among eco-conscious demographics, solidifying long-term operational resilience within the digital retail environment.

What are the Key Data Covered in this Home And Garden Products B2C E-Commerce Market Research and Growth Report?

  • What is the expected growth of the Home And Garden Products B2C E-Commerce Market between 2026 and 2030?

    • USD 58.05 billion, at a CAGR of 13.9%

  • What segmentation does the market report cover?

    • The report is segmented by Application (Home decor, Home improvement products, and Others), End-user (Commercial, and Household), Distribution Channel (Online marketplaces, Direct-to-consumer, Specialty retailers, and Subscription-based platforms) and Geography (APAC, North America, Europe, South America, Middle East and Africa)

  • Which regions are analyzed in the report?

    • APAC, North America, Europe, South America and Middle East and Africa

  • What are the key growth drivers and market challenges?

    • Technological advancements in spatial visualization and integration of immersive E-commerce real estate, Logistics complexities and escalate freight rates for heavy, bulky merchandise

  • Who are the major players in the Home And Garden Products B2C E-Commerce Market?

    • Alfred Karcher SE and Co. KG, Ashley Furniture Industries, Dyson Ltd., Fiskars Corp., Greenworks Tools, Herman Miller Inc., Husqvarna AB, Inter IKEA Holding BV, Kohler Co., LaZBoy Inc., Miele and Cie. KG, Ooni Ltd., Positec Tool Corp., Sleep Number Corp., Solo Stove, Tempur World LLC, The Scotts Miracle Gro Co., Traeger Inc. and Weber Inc.

Market Research Insights

  • The Home And Garden Products B2C E-commerce sector is experiencing rapid structural modernization as digital purchasing models penetrate high-value residential categories. Merchants operating robust direct-to-consumer websites are successfully bypassing traditional wholesale constraints, capturing higher margins and deeper consumer insights.
  • Logistical innovation remains paramount; the integration of specialized freight networks has led to a 22% increase in on-time delivery rates for oversized items, effectively mitigating historical cart abandonment issues. Furthermore, to combat escalating terminal handling fees and meet stringent environmental expectations, businesses are deploying fleet-wide electrification and structured product take-back programs.
  • These strategic supply chain optimizations have yielded a 16% reduction in last-mile operational overhead, ensuring that digital platforms maintain profitability while fulfilling complex, bulky consumer orders seamlessly.

We can help! Our analysts can customize this home and garden products b2c e-commerce market research report to meet your requirements.

Get in touch

1. Executive Summary

1.1 Market overview

Executive Summary - Chart on Market Overview
Executive Summary - Data Table on Market Overview
Executive Summary - Chart on Global Market Characteristics
Executive Summary - Chart on Market by Geography
Executive Summary - Chart on Market Segmentation by Application
Executive Summary - Chart on Market Segmentation by End-user
Executive Summary - Chart on Market Segmentation by Distribution Channel
Executive Summary - Chart on Incremental Growth
Executive Summary - Data Table on Incremental Growth
Executive Summary - Chart on Company Market Positioning

2. Technavio Analysis

2.1 Analysis of price sensitivity, lifecycle, customer purchase basket, adoption rates, and purchase criteria

2.2 Criticality of inputs and Factors of differentiation

Chart on Overview on criticality of inputs and factors of differentiation

2.3 Factors of disruption

Chart on Overview on factors of disruption

2.4 Impact of drivers and challenges

Chart on Impact of drivers and challenges in 2025 and 2030

3. Market Landscape

3.1 Market ecosystem

Chart on Parent Market
Data Table on - Parent Market

3.2 Market characteristics

Chart on Market characteristics analysis

3.3 Value chain analysis

Chart on Value chain analysis

4. Market Sizing

4.1 Market definition

Data Table on Offerings of companies included in the market definition

4.2 Market segment analysis

Market segments

4.3 Market size 2025

4.4 Market outlook: Forecast for 2025-2030

Chart on Global - Market size and forecast 2025-2030 ($ million)
Data Table on Global - Market size and forecast 2025-2030 ($ million)
Chart on Global Market: Year-over-year growth 2025-2030 (%)
Data Table on Global Market: Year-over-year growth 2025-2030 (%)

5. Historic Market Size

5.1 Global Home And Garden Products B2C E-Commerce Market 2020 - 2024

Historic Market Size - Data Table on Global Home And Garden Products B2C E-Commerce Market 2020 - 2024 ($ million)

5.2 Application segment analysis 2020 - 2024

Historic Market Size - Application Segment 2020 - 2024 ($ million)

5.3 End-user segment analysis 2020 - 2024

Historic Market Size - End-user Segment 2020 - 2024 ($ million)

5.4 Distribution Channel segment analysis 2020 - 2024

Historic Market Size - Distribution Channel Segment 2020 - 2024 ($ million)

5.5 Geography segment analysis 2020 - 2024

Historic Market Size - Geography Segment 2020 - 2024 ($ million)

5.6 Country segment analysis 2020 - 2024

Historic Market Size - Country Segment 2020 - 2024 ($ million)

6. Qualitative Analysis

6.1 Impact of AI on Global Home and Garden Products B2C E-commerce Market

6.2 Impact of geopolitical conflicts on Global Home and Garden Products B2C E-commerce Market

7. Five Forces Analysis

7.1 Five forces summary

Five forces analysis - Comparison between 2025 and 2030

7.2 Bargaining power of buyers

Bargaining power of buyers - Impact of key factors 2025 and 2030

7.3 Bargaining power of suppliers

Bargaining power of suppliers - Impact of key factors in 2025 and 2030

7.4 Threat of new entrants

Threat of new entrants - Impact of key factors in 2025 and 2030

7.5 Threat of substitutes

Threat of substitutes - Impact of key factors in 2025 and 2030

7.6 Threat of rivalry

Threat of rivalry - Impact of key factors in 2025 and 2030

7.7 Market condition

Chart on Market condition - Five forces 2025 and 2030

8. Market Segmentation by Application

8.1 Market segments

Chart on Application - Market share 2025-2030 (%)
Data Table on Application - Market share 2025-2030 (%)

8.2 Comparison by Application

Chart on Comparison by Application
Data Table on Comparison by Application

8.3 Home decor - Market size and forecast 2025-2030

Chart on Home decor - Market size and forecast 2025-2030 ($ million)
Data Table on Home decor - Market size and forecast 2025-2030 ($ million)
Chart on Home decor - Year-over-year growth 2025-2030 (%)
Data Table on Home decor - Year-over-year growth 2025-2030 (%)

8.4 Home improvement products - Market size and forecast 2025-2030

Chart on Home improvement products - Market size and forecast 2025-2030 ($ million)
Data Table on Home improvement products - Market size and forecast 2025-2030 ($ million)
Chart on Home improvement products - Year-over-year growth 2025-2030 (%)
Data Table on Home improvement products - Year-over-year growth 2025-2030 (%)

8.5 Others - Market size and forecast 2025-2030

Chart on Others - Market size and forecast 2025-2030 ($ million)
Data Table on Others - Market size and forecast 2025-2030 ($ million)
Chart on Others - Year-over-year growth 2025-2030 (%)
Data Table on Others - Year-over-year growth 2025-2030 (%)

8.6 Market opportunity by Application

Market opportunity by Application ($ million)
Data Table on Market opportunity by Application ($ million)

9. Market Segmentation by End-user

9.1 Market segments

Chart on End-user - Market share 2025-2030 (%)
Data Table on End-user - Market share 2025-2030 (%)

9.2 Comparison by End-user

Chart on Comparison by End-user
Data Table on Comparison by End-user

9.3 Commercial - Market size and forecast 2025-2030

Chart on Commercial - Market size and forecast 2025-2030 ($ million)
Data Table on Commercial - Market size and forecast 2025-2030 ($ million)
Chart on Commercial - Year-over-year growth 2025-2030 (%)
Data Table on Commercial - Year-over-year growth 2025-2030 (%)

9.4 Household - Market size and forecast 2025-2030

Chart on Household - Market size and forecast 2025-2030 ($ million)
Data Table on Household - Market size and forecast 2025-2030 ($ million)
Chart on Household - Year-over-year growth 2025-2030 (%)
Data Table on Household - Year-over-year growth 2025-2030 (%)

9.5 Market opportunity by End-user

Market opportunity by End-user ($ million)
Data Table on Market opportunity by End-user ($ million)

10. Market Segmentation by Distribution Channel

10.1 Market segments

Chart on Distribution Channel - Market share 2025-2030 (%)
Data Table on Distribution Channel - Market share 2025-2030 (%)

10.2 Comparison by Distribution Channel

Chart on Comparison by Distribution Channel
Data Table on Comparison by Distribution Channel

10.3 Online marketplaces - Market size and forecast 2025-2030

Chart on Online marketplaces - Market size and forecast 2025-2030 ($ million)
Data Table on Online marketplaces - Market size and forecast 2025-2030 ($ million)
Chart on Online marketplaces - Year-over-year growth 2025-2030 (%)
Data Table on Online marketplaces - Year-over-year growth 2025-2030 (%)

10.4 Direct-to-consumer - Market size and forecast 2025-2030

Chart on Direct-to-consumer - Market size and forecast 2025-2030 ($ million)
Data Table on Direct-to-consumer - Market size and forecast 2025-2030 ($ million)
Chart on Direct-to-consumer - Year-over-year growth 2025-2030 (%)
Data Table on Direct-to-consumer - Year-over-year growth 2025-2030 (%)

10.5 Specialty retailers - Market size and forecast 2025-2030

Chart on Specialty retailers - Market size and forecast 2025-2030 ($ million)
Data Table on Specialty retailers - Market size and forecast 2025-2030 ($ million)
Chart on Specialty retailers - Year-over-year growth 2025-2030 (%)
Data Table on Specialty retailers - Year-over-year growth 2025-2030 (%)

10.6 Subscription-based platforms - Market size and forecast 2025-2030

Chart on Subscription-based platforms - Market size and forecast 2025-2030 ($ million)
Data Table on Subscription-based platforms - Market size and forecast 2025-2030 ($ million)
Chart on Subscription-based platforms - Year-over-year growth 2025-2030 (%)
Data Table on Subscription-based platforms - Year-over-year growth 2025-2030 (%)

10.7 Market opportunity by Distribution Channel

Market opportunity by Distribution Channel ($ million)
Data Table on Market opportunity by Distribution Channel ($ million)

11. Customer Landscape

11.1 Customer landscape overview

Analysis of price sensitivity, lifecycle, customer purchase basket, adoption rates, and purchase criteria

12. Geographic Landscape

12.1 Geographic segmentation

Chart on Market share by geography 2025-2030 (%)
Data Table on Market share by geography 2025-2030 (%)

12.2 Geographic comparison

Chart on Geographic comparison
Data Table on Geographic comparison

12.3 APAC - Market size and forecast 2025-2030

Chart on APAC - Market size and forecast 2025-2030 ($ million)
Data Table on APAC - Market size and forecast 2025-2030 ($ million)
Chart on APAC - Year-over-year growth 2025-2030 (%)
Data Table on APAC - Year-over-year growth 2025-2030 (%)
Chart on Regional Comparison - APAC
Data Table on Regional Comparison - APAC

12.3.1 China - Market size and forecast 2025-2030

Chart on China - Market size and forecast 2025-2030 ($ million)
Data Table on China - Market size and forecast 2025-2030 ($ million)
Chart on China - Year-over-year growth 2025-2030 (%)
Data Table on China - Year-over-year growth 2025-2030 (%)

12.3.2 Japan - Market size and forecast 2025-2030

Chart on Japan - Market size and forecast 2025-2030 ($ million)
Data Table on Japan - Market size and forecast 2025-2030 ($ million)
Chart on Japan - Year-over-year growth 2025-2030 (%)
Data Table on Japan - Year-over-year growth 2025-2030 (%)

12.3.3 India - Market size and forecast 2025-2030

Chart on India - Market size and forecast 2025-2030 ($ million)
Data Table on India - Market size and forecast 2025-2030 ($ million)
Chart on India - Year-over-year growth 2025-2030 (%)
Data Table on India - Year-over-year growth 2025-2030 (%)

12.3.4 South Korea - Market size and forecast 2025-2030

Chart on South Korea - Market size and forecast 2025-2030 ($ million)
Data Table on South Korea - Market size and forecast 2025-2030 ($ million)
Chart on South Korea - Year-over-year growth 2025-2030 (%)
Data Table on South Korea - Year-over-year growth 2025-2030 (%)

12.3.5 Australia - Market size and forecast 2025-2030

Chart on Australia - Market size and forecast 2025-2030 ($ million)
Data Table on Australia - Market size and forecast 2025-2030 ($ million)
Chart on Australia - Year-over-year growth 2025-2030 (%)
Data Table on Australia - Year-over-year growth 2025-2030 (%)

12.3.6 Indonesia - Market size and forecast 2025-2030

Chart on Indonesia - Market size and forecast 2025-2030 ($ million)
Data Table on Indonesia - Market size and forecast 2025-2030 ($ million)
Chart on Indonesia - Year-over-year growth 2025-2030 (%)
Data Table on Indonesia - Year-over-year growth 2025-2030 (%)

12.4 North America - Market size and forecast 2025-2030

Chart on North America - Market size and forecast 2025-2030 ($ million)
Data Table on North America - Market size and forecast 2025-2030 ($ million)
Chart on North America - Year-over-year growth 2025-2030 (%)
Data Table on North America - Year-over-year growth 2025-2030 (%)
Chart on Regional Comparison - North America
Data Table on Regional Comparison - North America

12.4.1 US - Market size and forecast 2025-2030

Chart on US - Market size and forecast 2025-2030 ($ million)
Data Table on US - Market size and forecast 2025-2030 ($ million)
Chart on US - Year-over-year growth 2025-2030 (%)
Data Table on US - Year-over-year growth 2025-2030 (%)

12.4.2 Canada - Market size and forecast 2025-2030

Chart on Canada - Market size and forecast 2025-2030 ($ million)
Data Table on Canada - Market size and forecast 2025-2030 ($ million)
Chart on Canada - Year-over-year growth 2025-2030 (%)
Data Table on Canada - Year-over-year growth 2025-2030 (%)

12.4.3 Mexico - Market size and forecast 2025-2030

Chart on Mexico - Market size and forecast 2025-2030 ($ million)
Data Table on Mexico - Market size and forecast 2025-2030 ($ million)
Chart on Mexico - Year-over-year growth 2025-2030 (%)
Data Table on Mexico - Year-over-year growth 2025-2030 (%)

12.5 Europe - Market size and forecast 2025-2030

Chart on Europe - Market size and forecast 2025-2030 ($ million)
Data Table on Europe - Market size and forecast 2025-2030 ($ million)
Chart on Europe - Year-over-year growth 2025-2030 (%)
Data Table on Europe - Year-over-year growth 2025-2030 (%)
Chart on Regional Comparison - Europe
Data Table on Regional Comparison - Europe

12.5.1 Germany - Market size and forecast 2025-2030

Chart on Germany - Market size and forecast 2025-2030 ($ million)
Data Table on Germany - Market size and forecast 2025-2030 ($ million)
Chart on Germany - Year-over-year growth 2025-2030 (%)
Data Table on Germany - Year-over-year growth 2025-2030 (%)

12.5.2 UK - Market size and forecast 2025-2030

Chart on UK - Market size and forecast 2025-2030 ($ million)
Data Table on UK - Market size and forecast 2025-2030 ($ million)
Chart on UK - Year-over-year growth 2025-2030 (%)
Data Table on UK - Year-over-year growth 2025-2030 (%)

12.5.3 France - Market size and forecast 2025-2030

Chart on France - Market size and forecast 2025-2030 ($ million)
Data Table on France - Market size and forecast 2025-2030 ($ million)
Chart on France - Year-over-year growth 2025-2030 (%)
Data Table on France - Year-over-year growth 2025-2030 (%)

12.5.4 Italy - Market size and forecast 2025-2030

Chart on Italy - Market size and forecast 2025-2030 ($ million)
Data Table on Italy - Market size and forecast 2025-2030 ($ million)
Chart on Italy - Year-over-year growth 2025-2030 (%)
Data Table on Italy - Year-over-year growth 2025-2030 (%)

12.5.5 Spain - Market size and forecast 2025-2030

Chart on Spain - Market size and forecast 2025-2030 ($ million)
Data Table on Spain - Market size and forecast 2025-2030 ($ million)
Chart on Spain - Year-over-year growth 2025-2030 (%)
Data Table on Spain - Year-over-year growth 2025-2030 (%)

12.5.6 The Netherlands - Market size and forecast 2025-2030

Chart on The Netherlands - Market size and forecast 2025-2030 ($ million)
Data Table on The Netherlands - Market size and forecast 2025-2030 ($ million)
Chart on The Netherlands - Year-over-year growth 2025-2030 (%)
Data Table on The Netherlands - Year-over-year growth 2025-2030 (%)

12.6 South America - Market size and forecast 2025-2030

Chart on South America - Market size and forecast 2025-2030 ($ million)
Data Table on South America - Market size and forecast 2025-2030 ($ million)
Chart on South America - Year-over-year growth 2025-2030 (%)
Data Table on South America - Year-over-year growth 2025-2030 (%)
Chart on Regional Comparison - South America
Data Table on Regional Comparison - South America

12.6.1 Brazil - Market size and forecast 2025-2030

Chart on Brazil - Market size and forecast 2025-2030 ($ million)
Data Table on Brazil - Market size and forecast 2025-2030 ($ million)
Chart on Brazil - Year-over-year growth 2025-2030 (%)
Data Table on Brazil - Year-over-year growth 2025-2030 (%)

12.6.2 Argentina - Market size and forecast 2025-2030

Chart on Argentina - Market size and forecast 2025-2030 ($ million)
Data Table on Argentina - Market size and forecast 2025-2030 ($ million)
Chart on Argentina - Year-over-year growth 2025-2030 (%)
Data Table on Argentina - Year-over-year growth 2025-2030 (%)

12.6.3 Chile - Market size and forecast 2025-2030

Chart on Chile - Market size and forecast 2025-2030 ($ million)
Data Table on Chile - Market size and forecast 2025-2030 ($ million)
Chart on Chile - Year-over-year growth 2025-2030 (%)
Data Table on Chile - Year-over-year growth 2025-2030 (%)

12.7 Middle East and Africa - Market size and forecast 2025-2030

Chart on Middle East and Africa - Market size and forecast 2025-2030 ($ million)
Data Table on Middle East and Africa - Market size and forecast 2025-2030 ($ million)
Chart on Middle East and Africa - Year-over-year growth 2025-2030 (%)
Data Table on Middle East and Africa - Year-over-year growth 2025-2030 (%)
Chart on Regional Comparison - Middle East and Africa
Data Table on Regional Comparison - Middle East and Africa

12.7.1 Saudi Arabia - Market size and forecast 2025-2030

Chart on Saudi Arabia - Market size and forecast 2025-2030 ($ million)
Data Table on Saudi Arabia - Market size and forecast 2025-2030 ($ million)
Chart on Saudi Arabia - Year-over-year growth 2025-2030 (%)
Data Table on Saudi Arabia - Year-over-year growth 2025-2030 (%)

12.7.2 UAE - Market size and forecast 2025-2030

Chart on UAE - Market size and forecast 2025-2030 ($ million)
Data Table on UAE - Market size and forecast 2025-2030 ($ million)
Chart on UAE - Year-over-year growth 2025-2030 (%)
Data Table on UAE - Year-over-year growth 2025-2030 (%)

12.7.3 South Africa - Market size and forecast 2025-2030

Chart on South Africa - Market size and forecast 2025-2030 ($ million)
Data Table on South Africa - Market size and forecast 2025-2030 ($ million)
Chart on South Africa - Year-over-year growth 2025-2030 (%)
Data Table on South Africa - Year-over-year growth 2025-2030 (%)

12.7.4 Turkey - Market size and forecast 2025-2030

Chart on Turkey - Market size and forecast 2025-2030 ($ million)
Data Table on Turkey - Market size and forecast 2025-2030 ($ million)
Chart on Turkey - Year-over-year growth 2025-2030 (%)
Data Table on Turkey - Year-over-year growth 2025-2030 (%)

12.7.5 Israel - Market size and forecast 2025-2030

Chart on Israel - Market size and forecast 2025-2030 ($ million)
Data Table on Israel - Market size and forecast 2025-2030 ($ million)
Chart on Israel - Year-over-year growth 2025-2030 (%)
Data Table on Israel - Year-over-year growth 2025-2030 (%)

12.8 Market opportunity by geography

Market opportunity by geography ($ million)
Data Tables on Market opportunity by geography ($ million)

13. Drivers, Challenges, and Opportunity

13.1 Market drivers

Technological advancements in spatial visualization and integration of immersive E-commerce real estate
Proliferation of unified commerce frameworks and third-party marketplaces
Secular shift toward sustainable lifestyles and eco-conscious residential outdoor living

13.2 Market challenges

Logistics complexities and escalate freight rates for heavy, bulky merchandise
Heightened customer acquisition costs and fragmented omnichannel conversion loops
Stringent environmental compliance standards and sustainable supply chain pressures

13.3 Impact of drivers and challenges

Impact of drivers and challenges in 2025 and 2030

13.4 Market opportunities

Integration of immersive technologies and spatial computing in product visualization
Omnichannel hyper-personalization governed by predictive data analytics
Evolution of sustainable and circular economy within digital marketplaces

14. Competitive Landscape

14.1 Overview

14.2

Overview on criticality of inputs and factors of differentiation

14.3 Landscape disruption

Overview on factors of disruption

14.4 Industry risks

Impact of key risks on business

15. Competitive Analysis

15.1 Companies profiled

Companies covered

15.2 Company ranking index

15.3 Market positioning of companies

Matrix on companies position and classification

15.4 Ashley Furniture Industries

Ashley Furniture Industries - Overview
Ashley Furniture Industries - Product / Service
Ashley Furniture Industries - Key offerings
SWOT

15.5 Dyson Ltd.

Dyson Ltd. - Overview
Dyson Ltd. - Product / Service
Dyson Ltd. - Key offerings
SWOT

15.6 Fiskars Corp.

Fiskars Corp. - Overview
Fiskars Corp. - Business segments
Fiskars Corp. - Key offerings
Fiskars Corp. - Segment focus
SWOT

15.7 Herman Miller Inc.

Herman Miller Inc. - Overview
Herman Miller Inc. - Business segments
Herman Miller Inc. - Key offerings
Herman Miller Inc. - Segment focus
SWOT

15.8 Husqvarna AB

Husqvarna AB - Overview
Husqvarna AB - Business segments
Husqvarna AB - Key offerings
Husqvarna AB - Segment focus
SWOT

15.9 Inter IKEA Holding BV

Inter IKEA Holding BV - Overview
Inter IKEA Holding BV - Product / Service
Inter IKEA Holding BV - Key offerings
SWOT

15.10 Kohler Co.

Kohler Co. - Overview
Kohler Co. - Product / Service
Kohler Co. - Key offerings
SWOT

15.11 LaZBoy Inc.

LaZBoy Inc. - Overview
LaZBoy Inc. - Business segments
LaZBoy Inc. - Key offerings
LaZBoy Inc. - Segment focus
SWOT

15.12 Miele and Cie. KG

Miele and Cie. KG - Overview
Miele and Cie. KG - Product / Service
Miele and Cie. KG - Key offerings
SWOT

15.13 Sleep Number Corp.

Sleep Number Corp. - Overview
Sleep Number Corp. - Product / Service
Sleep Number Corp. - Key offerings
SWOT

15.14 Solo Stove

Solo Stove - Overview
Solo Stove - Product / Service
Solo Stove - Key offerings
SWOT

15.15 Tempur World LLC

Tempur World LLC - Overview
Tempur World LLC - Product / Service
Tempur World LLC - Key offerings
SWOT

15.16 The Scotts Miracle Gro Co.

The Scotts Miracle Gro Co. - Overview
The Scotts Miracle Gro Co. - Business segments
The Scotts Miracle Gro Co. - Key offerings
The Scotts Miracle Gro Co. - Segment focus
SWOT

15.17 Traeger Inc.

Traeger Inc. - Overview
Traeger Inc. - Business segments
Traeger Inc. - Key offerings
Traeger Inc. - Segment focus
SWOT

15.18 Weber Inc.

Weber Inc. - Overview
Weber Inc. - Product / Service
Weber Inc. - Key offerings
SWOT

16. Appendix

16.1 Scope of the report

Market definition
Objectives
Notes and caveats

16.2 Inclusions and exclusions checklist

Inclusions checklist
Exclusions checklist

16.3 Currency conversion rates for US$

16.4 Research methodology

16.5 Data procurement

Information sources

16.6 Data validation

16.7 Validation techniques employed for market sizing

16.8 Data synthesis

16.9 360 degree market analysis

16.10 List of abbreviations

Research Methodology

Technavio presents a detailed picture of the market by way of study, synthesis, and summation of data from multiple sources. The analysts have presented the various facets of the market with a particular focus on identifying the key industry influencers. The data thus presented is comprehensive, reliable, and the result of extensive research, both primary and secondary.

INFORMATION SOURCES

Primary sources

  • Manufacturers and suppliers
  • Channel partners
  • Industry experts
  • Strategic decision makers

Secondary sources

  • Industry journals and periodicals
  • Government data
  • Financial reports of key industry players
  • Historical data
  • Press releases

DATA ANALYSIS

Data Synthesis

  • Collation of data
  • Estimation of key figures
  • Analysis of derived insights

Data Validation

  • Triangulation with data models
  • Reference against proprietary databases
  • Corroboration with industry experts

REPORT WRITING

Qualitative

  • Market drivers
  • Market challenges
  • Market trends
  • Five forces analysis

Quantitative

  • Market size and forecast
  • Market segmentation
  • Geographical insights
  • Competitive landscape

Interested in this report?

Get your sample now to see our research methodology and insights!

Download Now

Frequently Asked Questions

Home And Garden Products B2C E-Commerce market growth will increase by USD 58050.4 million during 2026-2030.

The Home And Garden Products B2C E-Commerce market is expected to grow at a CAGR of 13.9% during 2026-2030.

Home And Garden Products B2C E-Commerce market is segmented by Application (Home decor, Home improvement products, Others) End-user (Commercial, Household) Distribution channel (Online marketplaces, Direct-to-consumer, Specialty retailers, Subscription-based platforms)

Alfred Karcher SE and Co. KG, Ashley Furniture Industries, Dyson Ltd., Fiskars Corp., Greenworks Tools, Herman Miller Inc., Husqvarna AB, Inter IKEA Holding BV, Kohler Co., LaZBoy Inc., Miele and Cie. KG, Ooni Ltd., Positec Tool Corp., Sleep Number Corp., Solo Stove, Tempur World LLC, The Scotts Miracle Gro Co., Traeger Inc., Weber Inc. are a few of the key vendors in the Home And Garden Products B2C E-Commerce market.

APAC will register the highest growth rate of 54.1% among the other regions. Therefore, the Home And Garden Products B2C E-Commerce market in APAC is expected to garner significant business opportunities for the vendors during the forecast period.

China, Japan, India, South Korea, Australia, Indonesia, US, Canada, Mexico, Germany, UK, France, Italy, Spain, The Netherlands, Brazil, Argentina, Chile, Saudi Arabia, UAE, South Africa, Turkey, Israel

  • Technological advancements in spatial visualization and integration of immersive E-commerce real estate is the driving factor this market.

The Home And Garden Products B2C E-Commerce market vendors should focus on grabbing business opportunities from the Application segment as it accounted for the largest market share in the base year.
RIA - Research AI Assistant
Ask RIA
