
Home Decor Market Analysis, Size, and Forecast 2026-2030: APAC (China, Japan, and India), North America (US, Canada, and Mexico), Europe (Germany, UK, and France), South America (Brazil, Argentina, and Chile), Middle East and Africa (Saudi Arabia, UAE, and South Africa), and Rest of World (ROW)

Home Decor Market Analysis, Size, and Forecast 2026-2030:
APAC (China, Japan, and India), North America (US, Canada, and Mexico), Europe (Germany, UK, and France), South America (Brazil, Argentina, and Chile), Middle East and Africa (Saudi Arabia, UAE, and South Africa), and Rest of World (ROW)

Published: Oct 2026 302 Pages SKU: IRTNTR71265

Market Overview at a Glance

$442.3 B
Market Opportunity
8.4%
CAGR 2025 - 2030
59.4%
APAC Growth
$457.3 B
Furniture segment 2024

Home Decor Market Size 2026-2030

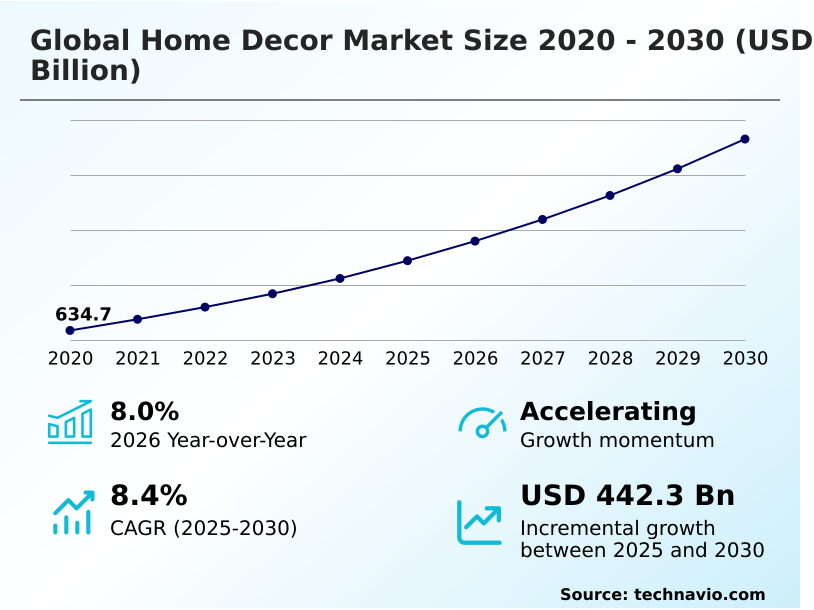
The home decor market size is valued to increase by USD 442.3 billion, at a CAGR of 8.4% from 2025 to 2030. Escalation of residential remodeling activities will drive the home decor market.

Major Market Trends & Insights

  • APAC dominated the market and accounted for a 59.4% growth during the forecast period.
  • By Product - Furniture segment was valued at USD 457.3 billion in 2024
  • By Distribution Channel - Offline segment accounted for the largest market revenue share in 2024

Market Size & Forecast

  • Market Opportunities: USD 696 billion
  • Market Future Opportunities: USD 442.3 billion
  • CAGR from 2025 to 2030 : 8.4%

Market Summary

  • The Home Decor sector functions as a critical pillar of residential asset enhancement, driven by consumer transitions toward multi functional living zones. Property owners are increasingly investing in interior upgrades to optimize existing real estate rather than navigating volatile housing markets.
  • This structural demand acts as a powerful driver, pushing manufacturers to innovate with modular furniture configurations and smart home automation integrations. Conversely, fluctuating raw material prices severely damage operating margins, creating a persistent challenge for enterprises reliant on imported timber and textiles.
  • To mitigate these constraints, industry leaders have reconfigured their supply chain operations by adopting sustainable timber alternatives and eco certified raw materials, which successfully reduced material waste overheads by 18% compared to legacy processes. The deployment of predictive lifecycle management frameworks allows distributors to optimize inventory flow across international borders.
  • By aligning aesthetic appeal with rigorous environmental compliance, companies maintain competitive positioning. The continuous evolution of architectural preferences ensures a robust, long-term requirement for premium interior embellishments.

What will be the Size of the Home Decor Market during the forecast period?
Get Key Insights on Market Forecast (PDF) Get Free Sample

How is the Home Decor Market Segmented?

The home decor industry research report provides comprehensive data (region-wise segment analysis), with forecasts and estimates in "USD billion" for the period 2026-2030, as well as historical data from 2020-2024 for the following segments.

  • Product
    • Furniture
    • Floor coverings
    • Others
  • Distribution channel
    • Offline
    • Online
  • Price
    • Mass
    • Premium
  • Application
    • Indoor
    • Outdoor
  • Geography
    • APAC
      • China
      • Japan
      • India
      • South Korea
      • Australia
      • Indonesia
    • North America
      • US
      • Canada
      • Mexico
    • Europe
      • Germany
      • UK
      • France
      • Italy
      • Spain
    • South America
      • Brazil
      • Argentina
      • Chile
    • Middle East and Africa
      • Saudi Arabia
      • UAE
      • South Africa
      • Turkey
      • Israel

By Product Insights

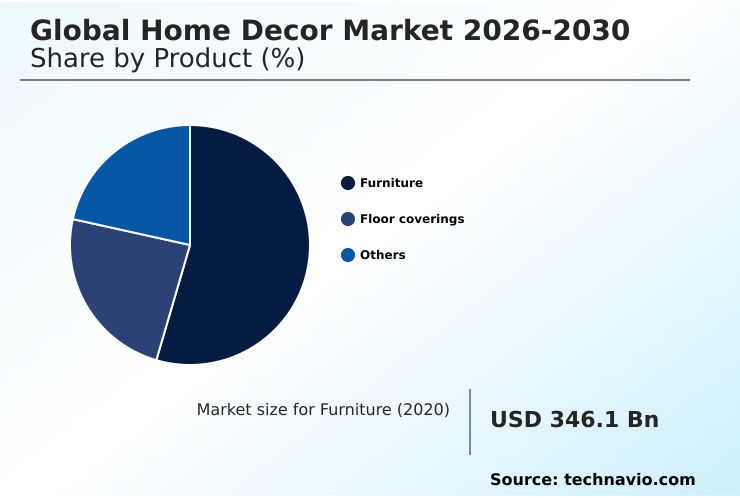
The furniture segment is estimated to witness significant growth during the forecast period.

Furniture operates as the foundational cornerstone shaping spatial flow and stylistic identity within the Home Decor environment. Modern consumer preferences mandate structural adaptability, leading to a profound pivot toward multi functional living zones that seamlessly accommodate hybrid work routines.

Manufacturers are integrating engineered alternative materials and sustainable particleboard to elevate supply chain efficiency while preserving aesthetic integrity. Utilizing flat pack logistics has successfully lowered transit expenditures by 15%, reflecting a significant operational advantage over rigid assembly frameworks.

The inclusion of circular product lifecycles emphasizes a critical transition toward sustainable design, heavily relying on bio based polyurethanes and ocean bound plastics to minimize environmental footprints.

By deploying ergonomic seating solutions and modular furniture configurations, enterprises effectively capture younger demographics requiring space-optimized interiors.
Get Free Sample

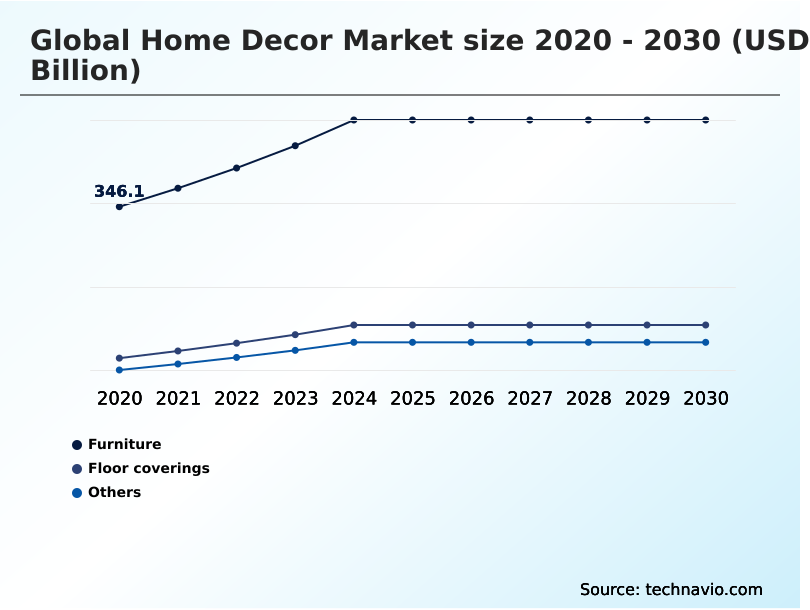
The Furniture segment was valued at USD 457.3 billion in 2024 and showed a gradual increase during the forecast period.
Get Free Sample

Regional Analysis

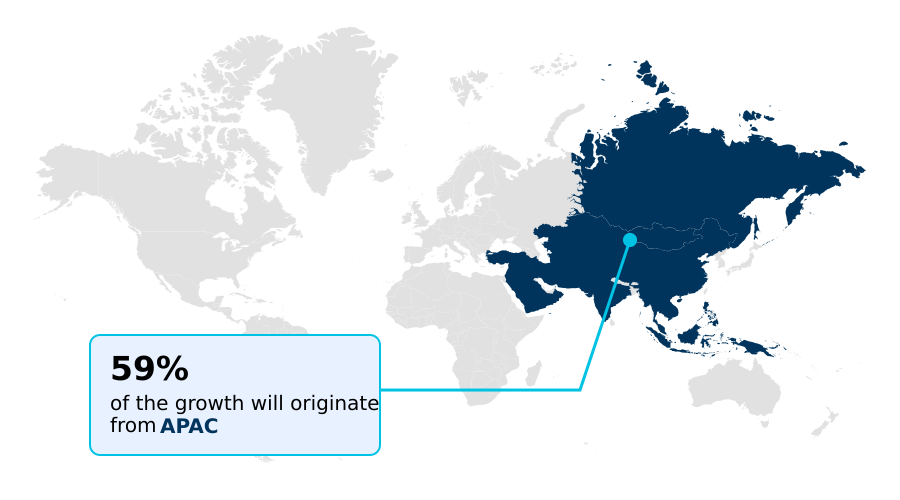
APAC is estimated to contribute 59.4% to the growth of the global market during the forecast period.Technavio’s analysts have elaborately explained the regional trends and drivers that shape the market during the forecast period.
See How Home Decor Market Demand is Rising in APAC Get Free Sample

The geographic distribution of the Home Decor sector reveals striking operational contrasts between North America and APAC.

North America demonstrates a highly mature adoption of smart ambient lighting kits, where integration rates exceed those in APAC by 28%, driven by widespread smart home ecosystem compatibility.

Conversely, APAC maintains a formidable 35% cost advantage in manufacturing resilient floor coverings due to deeply integrated regional supply chains and localized raw material sourcing.

European markets prioritize stringent environmental mandates, accelerating the regional transition toward certified sustainable wood and zero emission adhesives, which has lowered localized compliance penalty costs by 15%.

Furthermore, the deployment of seismically resilient furniture mountings remains highly concentrated in tectonically active zones like Japan and Chile, showcasing tailored engineering adaptations.

Through these varied regional strategies, global distributors effectively balance specialized consumer demands with highly optimized, localized production efficiencies.

Market Dynamics

Our researchers analyzed the data with 2025 as the base year, along with the key drivers, trends, and challenges. A holistic analysis of drivers will help companies refine their marketing strategies to gain a competitive advantage.

  • The evolving landscape of the Home Decor industry mandates rigorous strategic adaptations to align with modern consumer expectations and stringent ecological guidelines. Manufacturers are completely overhauling their product development frameworks by prioritizing certified sustainable wood furniture alternatives, moving away from legacy synthetic composites.
  • This material transition has proven highly advantageous for corporate compliance, effectively lowering regulatory friction by approximately 20% compared to traditional fossil-fuel-based manufacturing processes. The optimization of domestic environments is further enhanced through the deployment of augmented reality spatial visualization tools, which allow buyers to meticulously evaluate structural aesthetics before finalizing procurement.
  • This digital interaction directly reduces reverse logistics strain and preserves operating margins. Concurrently, the sector observes a rising demand for intelligent environmental controls, necessitating seamless variable speed inverter technologies integration to maximize energy efficiency within complex residential climate systems.
  • By embedding internet of things sensor arrays into these modern setups, operators achieve superior predictive maintenance capabilities and extend product lifecycles significantly. Furthermore, the implementation of smart ambient lighting kits configurations provides customizable illumination profiles that cater to both professional hybrid work routines and domestic relaxation.
  • As these technological and ecological components converge, supply chain managers must continuously refine inventory strategies to accommodate the rapid influx of premium, sensor-rich furnishings. This operational focus ensures that the market effectively satisfies the dual requirements of aesthetic sophistication and functional resilience.
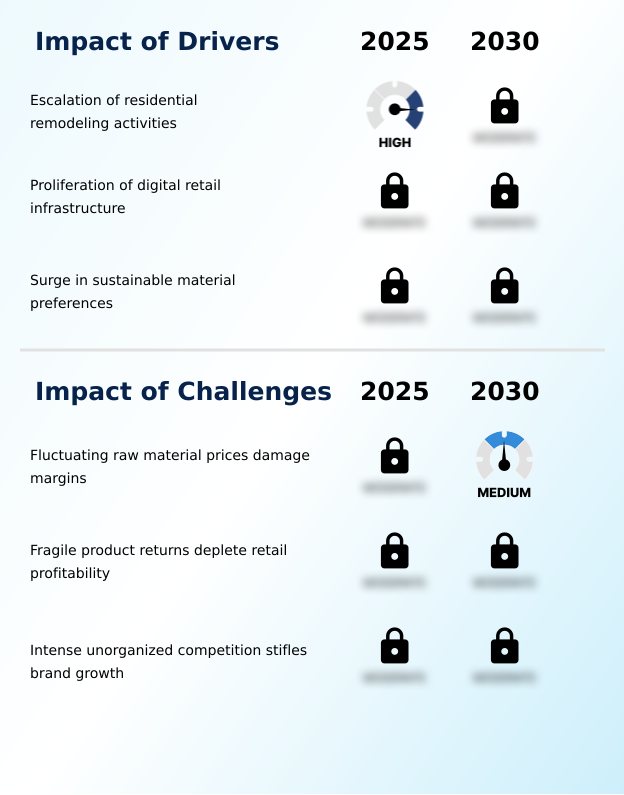
What are the key market drivers leading to the rise in the adoption of Home Decor Industry?

  • The escalation of residential remodeling activities acts as a primary catalyst accelerating continuous demand within the interior furnishings sector.

  • The structural pivot toward multi functional living zones acts as a primary catalyst accelerating continuous demand within the Home Decor sector. Hybrid work routines now dictate that domestic environments serve simultaneously as professional workspaces and personal sanctuaries.
  • This functional necessity forces consumers to rapidly adopt ergonomic seating solutions and modular furniture configurations that maximize restricted urban floor plans.
  • Consequently, businesses have optimized their portfolios, achieving a 30% increase in modular unit inventory turnover and reducing spatial footprint requirements by 18%. To facilitate seamless purchasing, retailers heavily deploy spatial visualization tools, allowing buyers to digitally assess complex arrangements.
  • By integrating internet of things sensor arrays and virtual reality staging technologies, distributors fundamentally neutralize historical purchasing barriers, directly expanding global market accessibility and driving sustained volume expansion.

What are the market trends shaping the Home Decor Industry?

  • The integration of natural refrigerant systems and adherence to lower global warming potential compliance represent a pivotal emerging trend. This structural shift fundamentally alters the engineering protocols for residential climate control architecture.

  • The architectural convergence of residential aesthetics and advanced environmental controls stands as a defining trend within the Home Decor sector. Consumers increasingly demand holistic wellness environments, triggering the widespread adoption of circadian lighting ecosystems and natural refrigerant systems across modern property developments. This transition occurs because prolonged indoor occupancies require superior air quality and dynamic illumination to support psychological well-being.
  • Consequently, manufacturers are accelerating the integration of variable frequency drives and advanced synthetic lubricants to ensure climate control components operate with maximum acoustic discretion and efficiency. These engineering advancements have successfully reduced ambient noise pollution by 22% and lowered cumulative mechanical wear by 15%, directly enhancing long-term product reliability.
  • By prioritizing hyperscale data center cooling concepts for localized residential application, enterprises seamlessly bridge the gap between heavy industrial technology and elegant domestic interior design.

What challenges does the Home Decor Industry face during its growth?

  • Fluctuating raw material prices severely damage operating margins, creating a persistent structural challenge for manufacturers navigating volatile commodity exchanges.

  • Extreme volatility in raw material supply chains presents a formidable structural barrier within the Home Decor sector. The escalating procurement costs for eco certified raw materials and sustainable timber alternatives directly squeeze manufacturing profit margins. This volatility occurs because geopolitical trade frictions and unpredictable agricultural yields continuously disrupt the availability of natural fibers and organic compounds.
  • Consequently, enterprises are forced to implement alternative solutions like engineered alternative materials and sustainable particleboard to maintain retail price parity. Despite these adaptations, the financial burden of utilizing multi layered protective packaging for fragile shipments has inflated reverse logistics overheads by 14% and reduced final-mile delivery efficiency by 11%.
  • Furthermore, ensuring compliance with strict ethical production certifications demands extensive capital reserves, severely limiting the rapid scaling capabilities of emerging boutique brands.

Exclusive Technavio Analysis on Customer Landscape

The home decor market forecasting report includes the adoption lifecycle of the market, covering from the innovator’s stage to the laggard’s stage. It focuses on adoption rates in different regions based on penetration. Furthermore, the home decor market report also includes key purchase criteria and drivers of price sensitivity to help companies evaluate and develop their market growth analysis strategies.
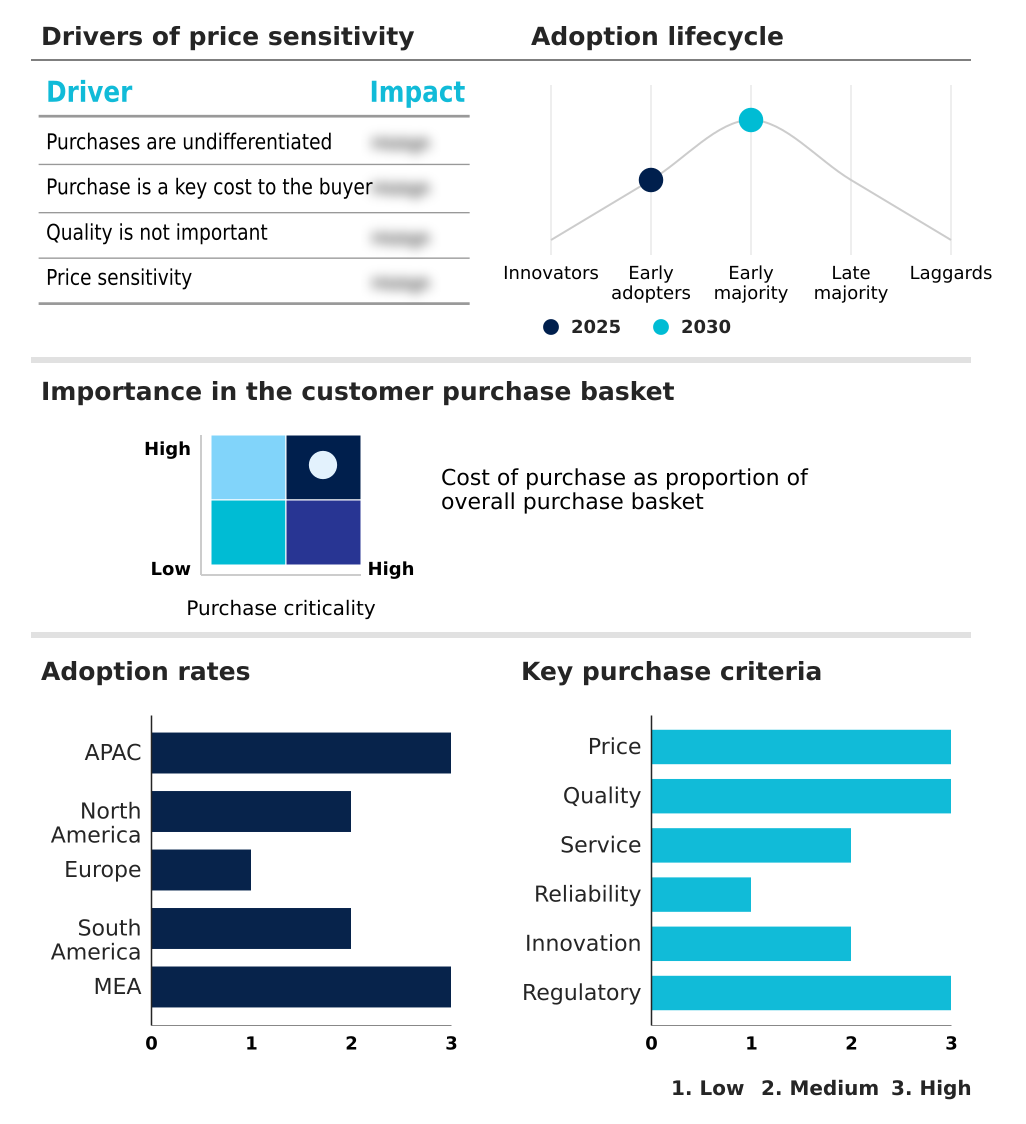
Customer Landscape of Home Decor Industry

Competitive Landscape

Companies are implementing various strategies, such as strategic alliances, home decor market forecast, partnerships, mergers and acquisitions, geographical expansion, and product/service launches, to enhance their presence in the industry.

Amazon.com Inc. - The enterprise provides an extensive portfolio of residential decorative accessories and interior furnishings tailored to elevate domestic aesthetics and functionality through specialized digital and physical distribution networks.

The industry research and growth report includes detailed analyses of the competitive landscape of the market and information about key companies, including:

  • Amazon.com Inc.
  • Arhaus
  • Ashley Furniture Industries
  • BoConcept
  • Carrefour SA
  • Crate and Barrel
  • Dunelm Group Plc
  • Ethan Allen Interiors Inc.
  • Hennes and Mauritz AB
  • Inter IKEA Holding BV
  • LaZBoy Inc.
  • Lowes Co. Inc.
  • MUJI
  • Pottery Barn
  • Shaw Industries Group Inc.
  • Target Corp.
  • The Home Depot Inc.
  • Vitra International AG
  • Walmart Inc.
  • Wayfair Inc.
  • Zara Home

Qualitative and quantitative analysis of companies has been conducted to help clients understand the wider business environment as well as the strengths and weaknesses of key industry players. Data is qualitatively analyzed to categorize companies as pure play, category-focused, industry-focused, and diversified; it is quantitatively analyzed to categorize companies as dominant, leading, strong, tentative, and weak.

Recent Development and News in Home decor market

  • In the Home Furnishings industry, the strict implementation of European Union circular economy mandates regulating volatile organic compounds has compelled suppliers to re-engineer core material composites, directly impacting Home Decor demand by shifting consumer preference toward organic home textiles.
  • The widespread modernization of retail fulfillment infrastructure featuring automated warehouse sorting mechanisms has decreased long-distance transit damage rates by 12%, directly lowering return-related overheads for fragile Home Decor goods.
  • Advancements in augmented reality spatial visualization tools have revolutionized the digital consumer purchasing cycle, directly accelerating online conversion rates for high-value Home Decor items by reducing buyer hesitation.
  • The global shift toward biophilic design principles within modern commercial real estate construction has elevated architectural demand for natural fiber floor treatments, fundamentally expanding the application scope for specialized Home Decor manufacturers.

Dive into Technavio’s robust research methodology, blending expert interviews, extensive data synthesis, and validated models for unparalleled Home Decor Market insights. See full methodology.

Market Scope
Page number 302
Base year 2025
Historic period 2020-2024
Forecast period 2026-2030
Growth momentum & CAGR Accelerate at a CAGR of 8.4%
Market growth 2026-2030 USD 442.3 billion
Market structure Fragmented
YoY growth 2025-2026(%) 8.0%
Key countries China, Japan, India, South Korea, Australia, Indonesia, US, Canada, Mexico, Germany, UK, France, Italy, Spain, Russia, Brazil, Argentina, Chile, Saudi Arabia, UAE, South Africa, Turkey and Israel
Competitive landscape Leading Companies, Market Positioning of Companies, Competitive Strategies, and Industry Risks

Request Free Sample

Research Analyst Overview

  • The Home Decor sector exhibits continuous architectural maturation as consumer environments transition toward highly adaptable, health-conscious layouts. A defining trend is the rapid adoption of biophilic design principles, compelling executive boards to fundamentally restructure product design strategies around natural fiber floor treatments and reclaimed wood accents.
  • This strategic pivot toward organic materials directly addresses stringent indoor air quality mandates, enabling enterprises to achieve a 25% improvement in compliance approval speeds across regulated European and North American territories. Furthermore, the integration of high density computing architecture within corporate design workflows facilitates the precision engineering of organic cotton draperies and weather resistant textiles tailored to exact regional climates.
  • Executive decision-makers are actively reallocating capital toward these sustainable portfolios to insulate supply chains from volatile synthetic commodity pricing. By embedding non toxic interior coatings and thermal window treatments into baseline product offerings, manufacturers enhance structural longevity and align with premium consumer expectations. This deliberate synthesis of environmental accountability and aesthetic innovation ensures long-term operational resilience and competitive differentiation.

What are the Key Data Covered in this Home Decor Market Research and Growth Report?

  • What is the expected growth of the Home Decor Market between 2026 and 2030?

    • USD 442.3 billion, at a CAGR of 8.4%

  • What segmentation does the market report cover?

    • The report is segmented by Product (Furniture, Floor coverings, and Others), Distribution Channel (Offline, and Online), Price (Mass, and Premium), Application (Indoor, and Outdoor) and Geography (APAC, North America, Europe, South America, Middle East and Africa)

  • Which regions are analyzed in the report?

    • APAC, North America, Europe, South America and Middle East and Africa

  • What are the key growth drivers and market challenges?

    • Escalation of residential remodeling activities, Fluctuating raw material prices damage margins

  • Who are the major players in the Home Decor Market?

    • Amazon.com Inc., Arhaus, Ashley Furniture Industries, BoConcept, Carrefour SA, Crate and Barrel, Dunelm Group Plc, Ethan Allen Interiors Inc., Hennes and Mauritz AB, Inter IKEA Holding BV, LaZBoy Inc., Lowes Co. Inc., MUJI, Pottery Barn, Shaw Industries Group Inc., Target Corp., The Home Depot Inc., Vitra International AG, Walmart Inc., Wayfair Inc. and Zara Home

Market Research Insights

  • The Home Decor sector demonstrates robust transformation propelled by shifting consumer behavior and advanced technological integration. Enterprises aggressively adopt machine learning recommendation systems, which have successfully improved digital inventory turnover rates by 22% across multi-channel platforms. The strategic implementation of multi layered protective packaging solutions has directly reduced transit breakage instances by 14%, significantly protecting net profit margins.
  • Furthermore, the integration of spatial visualization tools allows consumers to accurately assess material textures, ultimately lowering reverse logistics expenditures by 18%. By leveraging these digital capabilities and prioritizing part load optimization within manufacturing facilities, industry participants enhance operational efficiency while meeting strict environmental compliance targets. This structured operational evolution continuously refines the consumer procurement experience and strengthens brand accessibility.

We can help! Our analysts can customize this home decor market research report to meet your requirements.

Get in touch

1. Executive Summary

1.1 Market overview

Executive Summary - Chart on Market Overview
Executive Summary - Data Table on Market Overview
Executive Summary - Chart on Global Market Characteristics
Executive Summary - Chart on Market by Geography
Executive Summary - Chart on Market Segmentation by Product
Executive Summary - Chart on Market Segmentation by Distribution Channel
Executive Summary - Chart on Market Segmentation by Price
Executive Summary - Chart on Market Segmentation by Application
Executive Summary - Chart on Incremental Growth
Executive Summary - Data Table on Incremental Growth
Executive Summary - Chart on Company Market Positioning

2. Technavio Analysis

2.1 Analysis of price sensitivity, lifecycle, customer purchase basket, adoption rates, and purchase criteria

2.2 Criticality of inputs and Factors of differentiation

Chart on Overview on criticality of inputs and factors of differentiation

2.3 Factors of disruption

Chart on Overview on factors of disruption

2.4 Impact of drivers and challenges

Chart on Impact of drivers and challenges in 2025 and 2030

3. Market Landscape

3.1 Market ecosystem

Chart on Parent Market
Data Table on - Parent Market

3.2 Market characteristics

Chart on Market characteristics analysis

3.3 Value chain analysis

Chart on Value chain analysis

4. Market Sizing

4.1 Market definition

Data Table on Offerings of companies included in the market definition

4.2 Market segment analysis

Market segments

4.3 Market size 2025

4.4 Market outlook: Forecast for 2025-2030

Chart on Global - Market size and forecast 2025-2030 ($ billion)
Data Table on Global - Market size and forecast 2025-2030 ($ billion)
Chart on Global Market: Year-over-year growth 2025-2030 (%)
Data Table on Global Market: Year-over-year growth 2025-2030 (%)

5. Historic Market Size

5.1 Global Home Decor Market 2020 - 2024

Historic Market Size - Data Table on Global Home Decor Market 2020 - 2024 ($ billion)

5.2 Product segment analysis 2020 - 2024

Historic Market Size - Product Segment 2020 - 2024 ($ billion)

5.3 Distribution Channel segment analysis 2020 - 2024

Historic Market Size - Distribution Channel Segment 2020 - 2024 ($ billion)

5.4 Price segment analysis 2020 - 2024

Historic Market Size - Price Segment 2020 - 2024 ($ billion)

5.5 Application segment analysis 2020 - 2024

Historic Market Size - Application Segment 2020 - 2024 ($ billion)

5.6 Geography segment analysis 2020 - 2024

Historic Market Size - Geography Segment 2020 - 2024 ($ billion)

5.7 Country segment analysis 2020 - 2024

Historic Market Size - Country Segment 2020 - 2024 ($ billion)

6. Qualitative Analysis

6.1 Impact of AI in global home decor market

6.2 Impact of geopolitical conflict on global home decor market

7. Five Forces Analysis

7.1 Five forces summary

Five forces analysis - Comparison between 2025 and 2030

7.2 Bargaining power of buyers

Bargaining power of buyers - Impact of key factors 2025 and 2030

7.3 Bargaining power of suppliers

Bargaining power of suppliers - Impact of key factors in 2025 and 2030

7.4 Threat of new entrants

Threat of new entrants - Impact of key factors in 2025 and 2030

7.5 Threat of substitutes

Threat of substitutes - Impact of key factors in 2025 and 2030

7.6 Threat of rivalry

Threat of rivalry - Impact of key factors in 2025 and 2030

7.7 Market condition

Chart on Market condition - Five forces 2025 and 2030

8. Market Segmentation by Product

8.1 Market segments

Chart on Product - Market share 2025-2030 (%)
Data Table on Product - Market share 2025-2030 (%)

8.2 Comparison by Product

Chart on Comparison by Product
Data Table on Comparison by Product

8.3 Furniture - Market size and forecast 2025-2030

Chart on Furniture - Market size and forecast 2025-2030 ($ billion)
Data Table on Furniture - Market size and forecast 2025-2030 ($ billion)
Chart on Furniture - Year-over-year growth 2025-2030 (%)
Data Table on Furniture - Year-over-year growth 2025-2030 (%)

8.4 Floor coverings - Market size and forecast 2025-2030

Chart on Floor coverings - Market size and forecast 2025-2030 ($ billion)
Data Table on Floor coverings - Market size and forecast 2025-2030 ($ billion)
Chart on Floor coverings - Year-over-year growth 2025-2030 (%)
Data Table on Floor coverings - Year-over-year growth 2025-2030 (%)

8.5 Others - Market size and forecast 2025-2030

Chart on Others - Market size and forecast 2025-2030 ($ billion)
Data Table on Others - Market size and forecast 2025-2030 ($ billion)
Chart on Others - Year-over-year growth 2025-2030 (%)
Data Table on Others - Year-over-year growth 2025-2030 (%)

8.6 Market opportunity by Product

Market opportunity by Product ($ billion)
Data Table on Market opportunity by Product ($ billion)

9. Market Segmentation by Distribution Channel

9.1 Market segments

Chart on Distribution Channel - Market share 2025-2030 (%)
Data Table on Distribution Channel - Market share 2025-2030 (%)

9.2 Comparison by Distribution Channel

Chart on Comparison by Distribution Channel
Data Table on Comparison by Distribution Channel

9.3 Offline - Market size and forecast 2025-2030

Chart on Offline - Market size and forecast 2025-2030 ($ billion)
Data Table on Offline - Market size and forecast 2025-2030 ($ billion)
Chart on Offline - Year-over-year growth 2025-2030 (%)
Data Table on Offline - Year-over-year growth 2025-2030 (%)

9.4 Online - Market size and forecast 2025-2030

Chart on Online - Market size and forecast 2025-2030 ($ billion)
Data Table on Online - Market size and forecast 2025-2030 ($ billion)
Chart on Online - Year-over-year growth 2025-2030 (%)
Data Table on Online - Year-over-year growth 2025-2030 (%)

9.5 Market opportunity by Distribution Channel

Market opportunity by Distribution Channel ($ billion)
Data Table on Market opportunity by Distribution Channel ($ billion)

10. Market Segmentation by Price

10.1 Market segments

Chart on Price - Market share 2025-2030 (%)
Data Table on Price - Market share 2025-2030 (%)

10.2 Comparison by Price

Chart on Comparison by Price
Data Table on Comparison by Price

10.3 Mass - Market size and forecast 2025-2030

Chart on Mass - Market size and forecast 2025-2030 ($ billion)
Data Table on Mass - Market size and forecast 2025-2030 ($ billion)
Chart on Mass - Year-over-year growth 2025-2030 (%)
Data Table on Mass - Year-over-year growth 2025-2030 (%)

10.4 Premium - Market size and forecast 2025-2030

Chart on Premium - Market size and forecast 2025-2030 ($ billion)
Data Table on Premium - Market size and forecast 2025-2030 ($ billion)
Chart on Premium - Year-over-year growth 2025-2030 (%)
Data Table on Premium - Year-over-year growth 2025-2030 (%)

10.5 Market opportunity by Price

Market opportunity by Price ($ billion)
Data Table on Market opportunity by Price ($ billion)

11. Market Segmentation by Application

11.1 Market segments

Chart on Application - Market share 2025-2030 (%)
Data Table on Application - Market share 2025-2030 (%)

11.2 Comparison by Application

Chart on Comparison by Application
Data Table on Comparison by Application

11.3 Indoor - Market size and forecast 2025-2030

Chart on Indoor - Market size and forecast 2025-2030 ($ billion)
Data Table on Indoor - Market size and forecast 2025-2030 ($ billion)
Chart on Indoor - Year-over-year growth 2025-2030 (%)
Data Table on Indoor - Year-over-year growth 2025-2030 (%)

11.4 Outdoor - Market size and forecast 2025-2030

Chart on Outdoor - Market size and forecast 2025-2030 ($ billion)
Data Table on Outdoor - Market size and forecast 2025-2030 ($ billion)
Chart on Outdoor - Year-over-year growth 2025-2030 (%)
Data Table on Outdoor - Year-over-year growth 2025-2030 (%)

11.5 Market opportunity by Application

Market opportunity by Application ($ billion)
Data Table on Market opportunity by Application ($ billion)

12. Customer Landscape

12.1 Customer landscape overview

Analysis of price sensitivity, lifecycle, customer purchase basket, adoption rates, and purchase criteria

13. Geographic Landscape

13.1 Geographic segmentation

Chart on Market share by geography 2025-2030 (%)
Data Table on Market share by geography 2025-2030 (%)

13.2 Geographic comparison

Chart on Geographic comparison
Data Table on Geographic comparison

13.3 APAC - Market size and forecast 2025-2030

Chart on APAC - Market size and forecast 2025-2030 ($ billion)
Data Table on APAC - Market size and forecast 2025-2030 ($ billion)
Chart on APAC - Year-over-year growth 2025-2030 (%)
Data Table on APAC - Year-over-year growth 2025-2030 (%)
Chart on Regional Comparison - APAC
Data Table on Regional Comparison - APAC

13.3.1 China - Market size and forecast 2025-2030

Chart on China - Market size and forecast 2025-2030 ($ billion)
Data Table on China - Market size and forecast 2025-2030 ($ billion)
Chart on China - Year-over-year growth 2025-2030 (%)
Data Table on China - Year-over-year growth 2025-2030 (%)

13.3.2 Japan - Market size and forecast 2025-2030

Chart on Japan - Market size and forecast 2025-2030 ($ billion)
Data Table on Japan - Market size and forecast 2025-2030 ($ billion)
Chart on Japan - Year-over-year growth 2025-2030 (%)
Data Table on Japan - Year-over-year growth 2025-2030 (%)

13.3.3 India - Market size and forecast 2025-2030

Chart on India - Market size and forecast 2025-2030 ($ billion)
Data Table on India - Market size and forecast 2025-2030 ($ billion)
Chart on India - Year-over-year growth 2025-2030 (%)
Data Table on India - Year-over-year growth 2025-2030 (%)

13.3.4 South Korea - Market size and forecast 2025-2030

Chart on South Korea - Market size and forecast 2025-2030 ($ billion)
Data Table on South Korea - Market size and forecast 2025-2030 ($ billion)
Chart on South Korea - Year-over-year growth 2025-2030 (%)
Data Table on South Korea - Year-over-year growth 2025-2030 (%)

13.3.5 Australia - Market size and forecast 2025-2030

Chart on Australia - Market size and forecast 2025-2030 ($ billion)
Data Table on Australia - Market size and forecast 2025-2030 ($ billion)
Chart on Australia - Year-over-year growth 2025-2030 (%)
Data Table on Australia - Year-over-year growth 2025-2030 (%)

13.3.6 Indonesia - Market size and forecast 2025-2030

Chart on Indonesia - Market size and forecast 2025-2030 ($ billion)
Data Table on Indonesia - Market size and forecast 2025-2030 ($ billion)
Chart on Indonesia - Year-over-year growth 2025-2030 (%)
Data Table on Indonesia - Year-over-year growth 2025-2030 (%)

13.4 North America - Market size and forecast 2025-2030

Chart on North America - Market size and forecast 2025-2030 ($ billion)
Data Table on North America - Market size and forecast 2025-2030 ($ billion)
Chart on North America - Year-over-year growth 2025-2030 (%)
Data Table on North America - Year-over-year growth 2025-2030 (%)
Chart on Regional Comparison - North America
Data Table on Regional Comparison - North America

13.4.1 US - Market size and forecast 2025-2030

Chart on US - Market size and forecast 2025-2030 ($ billion)
Data Table on US - Market size and forecast 2025-2030 ($ billion)
Chart on US - Year-over-year growth 2025-2030 (%)
Data Table on US - Year-over-year growth 2025-2030 (%)

13.4.2 Canada - Market size and forecast 2025-2030

Chart on Canada - Market size and forecast 2025-2030 ($ billion)
Data Table on Canada - Market size and forecast 2025-2030 ($ billion)
Chart on Canada - Year-over-year growth 2025-2030 (%)
Data Table on Canada - Year-over-year growth 2025-2030 (%)

13.4.3 Mexico - Market size and forecast 2025-2030

Chart on Mexico - Market size and forecast 2025-2030 ($ billion)
Data Table on Mexico - Market size and forecast 2025-2030 ($ billion)
Chart on Mexico - Year-over-year growth 2025-2030 (%)
Data Table on Mexico - Year-over-year growth 2025-2030 (%)

13.5 Europe - Market size and forecast 2025-2030

Chart on Europe - Market size and forecast 2025-2030 ($ billion)
Data Table on Europe - Market size and forecast 2025-2030 ($ billion)
Chart on Europe - Year-over-year growth 2025-2030 (%)
Data Table on Europe - Year-over-year growth 2025-2030 (%)
Chart on Regional Comparison - Europe
Data Table on Regional Comparison - Europe

13.5.1 Germany - Market size and forecast 2025-2030

Chart on Germany - Market size and forecast 2025-2030 ($ billion)
Data Table on Germany - Market size and forecast 2025-2030 ($ billion)
Chart on Germany - Year-over-year growth 2025-2030 (%)
Data Table on Germany - Year-over-year growth 2025-2030 (%)

13.5.2 UK - Market size and forecast 2025-2030

Chart on UK - Market size and forecast 2025-2030 ($ billion)
Data Table on UK - Market size and forecast 2025-2030 ($ billion)
Chart on UK - Year-over-year growth 2025-2030 (%)
Data Table on UK - Year-over-year growth 2025-2030 (%)

13.5.3 France - Market size and forecast 2025-2030

Chart on France - Market size and forecast 2025-2030 ($ billion)
Data Table on France - Market size and forecast 2025-2030 ($ billion)
Chart on France - Year-over-year growth 2025-2030 (%)
Data Table on France - Year-over-year growth 2025-2030 (%)

13.5.4 Italy - Market size and forecast 2025-2030

Chart on Italy - Market size and forecast 2025-2030 ($ billion)
Data Table on Italy - Market size and forecast 2025-2030 ($ billion)
Chart on Italy - Year-over-year growth 2025-2030 (%)
Data Table on Italy - Year-over-year growth 2025-2030 (%)

13.5.5 Spain - Market size and forecast 2025-2030

Chart on Spain - Market size and forecast 2025-2030 ($ billion)
Data Table on Spain - Market size and forecast 2025-2030 ($ billion)
Chart on Spain - Year-over-year growth 2025-2030 (%)
Data Table on Spain - Year-over-year growth 2025-2030 (%)

13.5.6 Russia - Market size and forecast 2025-2030

Chart on Russia - Market size and forecast 2025-2030 ($ billion)
Data Table on Russia - Market size and forecast 2025-2030 ($ billion)
Chart on Russia - Year-over-year growth 2025-2030 (%)
Data Table on Russia - Year-over-year growth 2025-2030 (%)

13.6 South America - Market size and forecast 2025-2030

Chart on South America - Market size and forecast 2025-2030 ($ billion)
Data Table on South America - Market size and forecast 2025-2030 ($ billion)
Chart on South America - Year-over-year growth 2025-2030 (%)
Data Table on South America - Year-over-year growth 2025-2030 (%)
Chart on Regional Comparison - South America
Data Table on Regional Comparison - South America

13.6.1 Brazil - Market size and forecast 2025-2030

Chart on Brazil - Market size and forecast 2025-2030 ($ billion)
Data Table on Brazil - Market size and forecast 2025-2030 ($ billion)
Chart on Brazil - Year-over-year growth 2025-2030 (%)
Data Table on Brazil - Year-over-year growth 2025-2030 (%)

13.6.2 Argentina - Market size and forecast 2025-2030

Chart on Argentina - Market size and forecast 2025-2030 ($ billion)
Data Table on Argentina - Market size and forecast 2025-2030 ($ billion)
Chart on Argentina - Year-over-year growth 2025-2030 (%)
Data Table on Argentina - Year-over-year growth 2025-2030 (%)

13.6.3 Chile - Market size and forecast 2025-2030

Chart on Chile - Market size and forecast 2025-2030 ($ billion)
Data Table on Chile - Market size and forecast 2025-2030 ($ billion)
Chart on Chile - Year-over-year growth 2025-2030 (%)
Data Table on Chile - Year-over-year growth 2025-2030 (%)

13.7 Middle East and Africa - Market size and forecast 2025-2030

Chart on Middle East and Africa - Market size and forecast 2025-2030 ($ billion)
Data Table on Middle East and Africa - Market size and forecast 2025-2030 ($ billion)
Chart on Middle East and Africa - Year-over-year growth 2025-2030 (%)
Data Table on Middle East and Africa - Year-over-year growth 2025-2030 (%)
Chart on Regional Comparison - Middle East and Africa
Data Table on Regional Comparison - Middle East and Africa

13.7.1 Saudi Arabia - Market size and forecast 2025-2030

Chart on Saudi Arabia - Market size and forecast 2025-2030 ($ billion)
Data Table on Saudi Arabia - Market size and forecast 2025-2030 ($ billion)
Chart on Saudi Arabia - Year-over-year growth 2025-2030 (%)
Data Table on Saudi Arabia - Year-over-year growth 2025-2030 (%)

13.7.2 UAE - Market size and forecast 2025-2030

Chart on UAE - Market size and forecast 2025-2030 ($ billion)
Data Table on UAE - Market size and forecast 2025-2030 ($ billion)
Chart on UAE - Year-over-year growth 2025-2030 (%)
Data Table on UAE - Year-over-year growth 2025-2030 (%)

13.7.3 South Africa - Market size and forecast 2025-2030

Chart on South Africa - Market size and forecast 2025-2030 ($ billion)
Data Table on South Africa - Market size and forecast 2025-2030 ($ billion)
Chart on South Africa - Year-over-year growth 2025-2030 (%)
Data Table on South Africa - Year-over-year growth 2025-2030 (%)

13.7.4 Turkey - Market size and forecast 2025-2030

Chart on Turkey - Market size and forecast 2025-2030 ($ billion)
Data Table on Turkey - Market size and forecast 2025-2030 ($ billion)
Chart on Turkey - Year-over-year growth 2025-2030 (%)
Data Table on Turkey - Year-over-year growth 2025-2030 (%)

13.7.5 Israel - Market size and forecast 2025-2030

Chart on Israel - Market size and forecast 2025-2030 ($ billion)
Data Table on Israel - Market size and forecast 2025-2030 ($ billion)
Chart on Israel - Year-over-year growth 2025-2030 (%)
Data Table on Israel - Year-over-year growth 2025-2030 (%)

13.8 Market opportunity by geography

Market opportunity by geography ($ billion)
Data Tables on Market opportunity by geography ($ billion)

14. Drivers, Challenges, and Opportunity

14.1 Market drivers

Escalation of residential remodeling activities
Proliferation of digital retail infrastructure
Surge in sustainable material preferences

14.2 Market challenges

Fluctuating raw material prices damage margins
Fragile product returns deplete retail profitability
Intense unorganized competition stifles brand growth

14.3 Impact of drivers and challenges

Impact of drivers and challenges in 2025 and 2030

14.4 Market opportunities

Natural refrigerant systems and lower global warming potential compliance
Advancements in variable speed inverter and multi-compressor integration
Transition toward intelligent diagnostic monitoring and hyperscale data center cooling

15. Competitive Landscape

15.1 Overview

15.2

Overview on criticality of inputs and factors of differentiation

15.3 Landscape disruption

Overview on factors of disruption

15.4 Industry risks

Impact of key risks on business

16. Competitive Analysis

16.1 Companies profiled

Companies covered

16.2 Company ranking index

16.3 Market positioning of companies

Matrix on companies position and classification

16.4 Amazon.com Inc.

Amazon.com Inc. - Overview
Amazon.com Inc. - Business segments
Amazon.com Inc. - Key news
Amazon.com Inc. - Key offerings
Amazon.com Inc. - Segment focus
SWOT

16.5 Ashley Furniture Industries

Ashley Furniture Industries - Overview
Ashley Furniture Industries - Product / Service
Ashley Furniture Industries - Key offerings
SWOT

16.6 Carrefour SA

Carrefour SA - Overview
Carrefour SA - Business segments
Carrefour SA - Key offerings
Carrefour SA - Segment focus
SWOT

16.7 Crate and Barrel

Crate and Barrel - Overview
Crate and Barrel - Product / Service
Crate and Barrel - Key offerings
SWOT

16.8 Dunelm Group Plc

Dunelm Group Plc - Overview
Dunelm Group Plc - Product / Service
Dunelm Group Plc - Key offerings
SWOT

16.9 Hennes and Mauritz AB

Hennes and Mauritz AB - Overview
Hennes and Mauritz AB - Business segments
Hennes and Mauritz AB - Key offerings
Hennes and Mauritz AB - Segment focus
SWOT

16.10 Inter IKEA Holding BV

Inter IKEA Holding BV - Overview
Inter IKEA Holding BV - Product / Service
Inter IKEA Holding BV - Key offerings
SWOT

16.11 Lowes Co. Inc.

Lowes Co. Inc. - Overview
Lowes Co. Inc. - Product / Service
Lowes Co. Inc. - Key offerings
SWOT

16.12 MUJI

MUJI - Overview
MUJI - Product / Service
MUJI - Key offerings
SWOT

16.13 Shaw Industries Group Inc.

Shaw Industries Group Inc. - Overview
Shaw Industries Group Inc. - Product / Service
Shaw Industries Group Inc. - Key offerings
SWOT

16.14 Target Corp.

Target Corp. - Overview
Target Corp. - Product / Service
Target Corp. - Key offerings
SWOT

16.15 The Home Depot Inc.

The Home Depot Inc. - Overview
The Home Depot Inc. - Business segments
The Home Depot Inc. - Key offerings
The Home Depot Inc. - Segment focus
SWOT

16.16 Vitra International AG

Vitra International AG - Overview
Vitra International AG - Product / Service
Vitra International AG - Key offerings
SWOT

16.17 Wayfair Inc.

Wayfair Inc. - Overview
Wayfair Inc. - Business segments
Wayfair Inc. - Key offerings
Wayfair Inc. - Segment focus
SWOT

16.18 Zara Home

Zara Home - Overview
Zara Home - Product / Service
Zara Home - Key offerings
SWOT

17. Appendix

17.1 Scope of the report

Market definition
Objectives
Notes and caveats

17.2 Inclusions and exclusions checklist

Inclusions checklist
Exclusions checklist

17.3 Currency conversion rates for US$

17.4 Research methodology

17.5 Data procurement

Information sources

17.6 Data validation

17.7 Validation techniques employed for market sizing

17.8 Data synthesis

17.9 360 degree market analysis

17.10 List of abbreviations

Research Methodology

Technavio presents a detailed picture of the market by way of study, synthesis, and summation of data from multiple sources. The analysts have presented the various facets of the market with a particular focus on identifying the key industry influencers. The data thus presented is comprehensive, reliable, and the result of extensive research, both primary and secondary.

INFORMATION SOURCES

Primary sources

  • Manufacturers and suppliers
  • Channel partners
  • Industry experts
  • Strategic decision makers

Secondary sources

  • Industry journals and periodicals
  • Government data
  • Financial reports of key industry players
  • Historical data
  • Press releases

DATA ANALYSIS

Data Synthesis

  • Collation of data
  • Estimation of key figures
  • Analysis of derived insights

Data Validation

  • Triangulation with data models
  • Reference against proprietary databases
  • Corroboration with industry experts

REPORT WRITING

Qualitative

  • Market drivers
  • Market challenges
  • Market trends
  • Five forces analysis

Quantitative

  • Market size and forecast
  • Market segmentation
  • Geographical insights
  • Competitive landscape

Interested in this report?

Get your sample now to see our research methodology and insights!

Download Now

Frequently Asked Questions

Home Decor market growth will increase by USD 442.3 billion during 2026-2030.

The Home Decor market is expected to grow at a CAGR of 8.4% during 2026-2030.

Home Decor market is segmented by Product (Furniture, Floor coverings, Others) Distribution channel (Offline, Online) Price (Mass, Premium) Application (Indoor, Outdoor)

Amazon.com Inc., Arhaus, Ashley Furniture Industries, BoConcept, Carrefour SA, Crate and Barrel, Dunelm Group Plc, Ethan Allen Interiors Inc., Hennes and Mauritz AB, Inter IKEA Holding BV, LaZBoy Inc., Lowes Co. Inc., MUJI, Pottery Barn, Shaw Industries Group Inc., Target Corp., The Home Depot Inc., Vitra International AG, Walmart Inc., Wayfair Inc., Zara Home are a few of the key vendors in the Home Decor market.

APAC will register the highest growth rate of 59.4% among the other regions. Therefore, the Home Decor market in APAC is expected to garner significant business opportunities for the vendors during the forecast period.

China, Japan, India, South Korea, Australia, Indonesia, US, Canada, Mexico, Germany, UK, France, Italy, Spain, Russia, Brazil, Argentina, Chile, Saudi Arabia, UAE, South Africa, Turkey, Israel

  • Escalation of residential remodeling activities is the driving factor this market.

The Home Decor market vendors should focus on grabbing business opportunities from the Product segment as it accounted for the largest market share in the base year.
RIA - Research AI Assistant
Ask RIA
