
Homeowners Insurance Market Analysis, Size, and Forecast 2026-2030: North America (US, Canada, and Mexico), Europe (Germany, UK, and France), APAC (China, Japan, and India), South America (Brazil, Argentina, and Chile), Middle East and Africa (Saudi Arabia, UAE, and South Africa), and Rest of World (ROW)

Homeowners Insurance Market Analysis, Size, and Forecast 2026-2030:
North America (US, Canada, and Mexico), Europe (Germany, UK, and France), APAC (China, Japan, and India), South America (Brazil, Argentina, and Chile), Middle East and Africa (Saudi Arabia, UAE, and South Africa), and Rest of World (ROW)

Published: Oct 2026 303 Pages SKU: IRTNTR74780

Market Overview at a Glance

$118.14 B
Market Opportunity
7.2%
CAGR 2025 - 2030
52.3%
North America Growth
$103.67 B
Fire and theft segment 2024

Homeowners Insurance Market Size 2026-2030

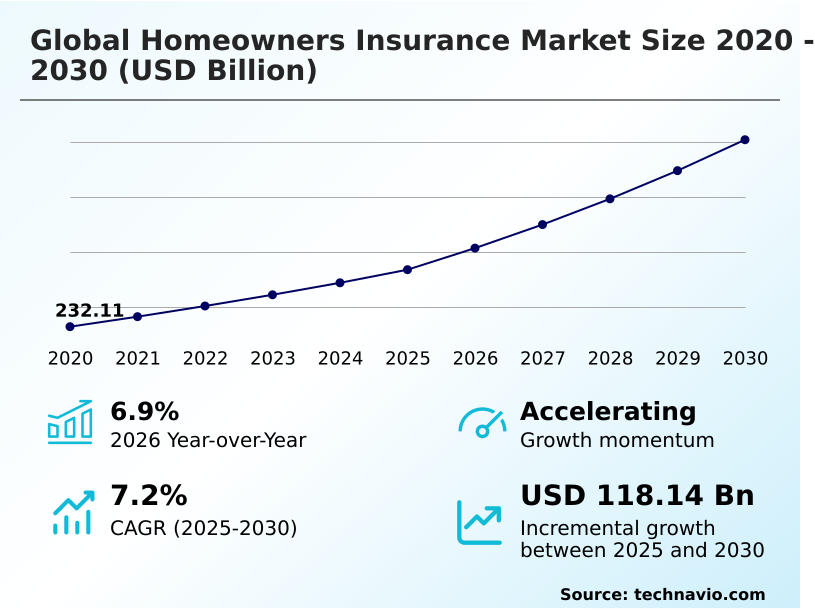
The homeowners insurance market size is valued to increase by USD 118.14 billion, at a CAGR of 7.2% from 2025 to 2030. Expansion of insurance accessibility through bancassurance partnerships will drive the homeowners insurance market.

Major Market Trends & Insights

  • North America dominated the market and accounted for a 52.3% growth during the forecast period.
  • By Type - Fire and theft segment was valued at USD 103.67 billion in 2024
  • By Source - Captive segment accounted for the largest market revenue share in 2024

Market Size & Forecast

  • Market Opportunities: USD 169.95 billion
  • Market Future Opportunities: USD 118.14 billion
  • CAGR from 2025 to 2030 : 7.2%

Market Summary

  • The Homeowners Insurance Market exhibits continuous expansion driven by escalating residential property valuations and the necessity for robust financial resilience against unpredictable hazards. Supply chain disruptions in construction materials frequently delay structural repairs, compelling underwriters to optimize vendor networks and adjust replacement cost estimations to maintain service continuity.
  • For instance, integrating automated triage systems within these networks has reduced claim processing cycle times by 14%, significantly improving operational efficiency. The expansion of insurance accessibility through bancassurance partnerships actively drives market penetration, allowing institutions to leverage established financial relationships to seamlessly distribute property damage coverage.
  • Conversely, climate-related loss volatility presents a formidable challenge, as erratic weather event severity complicates predictive loss analytics and strains reinsurance capacity allocation. Actuarial teams must constantly recalibrate underwriting algorithms to balance risk retention with premium affordability.
  • By deploying advanced catastrophe risk modeling, providers attempt to mitigate these environmental exposures while refining liability risk transfer mechanisms to ensure long-term portfolio stability and regulatory alignment.

What will be the Size of the Homeowners Insurance Market during the forecast period?
Get Key Insights on Market Forecast (PDF) Get Free Sample

How is the Homeowners Insurance Market Segmented?

The homeowners insurance industry research report provides comprehensive data (region-wise segment analysis), with forecasts and estimates in "USD million" for the period 2026-2030, as well as historical data from 2020-2024 for the following segments.

  • Type
    • Fire and theft
    • House damage
    • Floods and earthquake
    • Others
  • Source
    • Captive
    • Independent agent
    • Direct response
  • End-user
    • Landlords
    • Homeowners
    • Tenants
  • Geography
    • North America
      • US
      • Canada
      • Mexico
    • Europe
      • Germany
      • UK
      • France
      • Italy
      • Spain
      • The Netherlands
    • APAC
      • China
      • Japan
      • India
      • South Korea
      • Australia
      • Indonesia
    • South America
      • Brazil
      • Argentina
      • Chile
    • Middle East and Africa
      • Saudi Arabia
      • UAE
      • South Africa
      • Israel
      • Turkey

By Type Insights

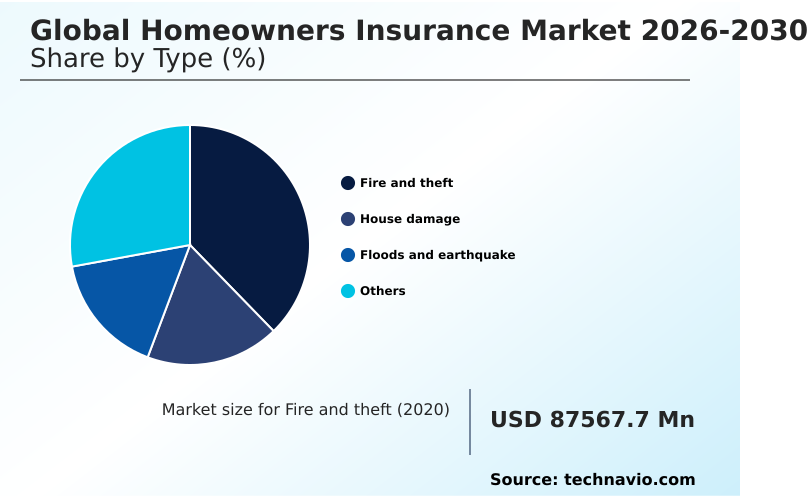
The fire and theft segment is estimated to witness significant growth during the forecast period.

The property protection ecosystem differentiates significantly through targeted perils, where structural damage assessment processes for combustion and unauthorized removal events require distinct risk mitigation protocols. Organizations prioritize property inspection automation and aerial imagery analysis to accelerate evaluations.

Implementing machine learning underwriting frameworks tailored for specific threat vectors enables companies to refine exposure limits and optimize claims settlement frequency. For example, remote damage evaluation adoption has enhanced diagnostic accuracy by 22%, streamlining the resolution of high-severity losses.

Managing unauthorized entry risks demands integration of AI chatbot interactions and omnichannel customer engagement to assist policyholders swiftly during critical incidents.

By isolating these specific vulnerabilities from broader environmental hazards, underwriters deploy specialized capacity allocation strategies that improve operational margins and enhance long-term portfolio stability across residential asset classes.
Get Free Sample

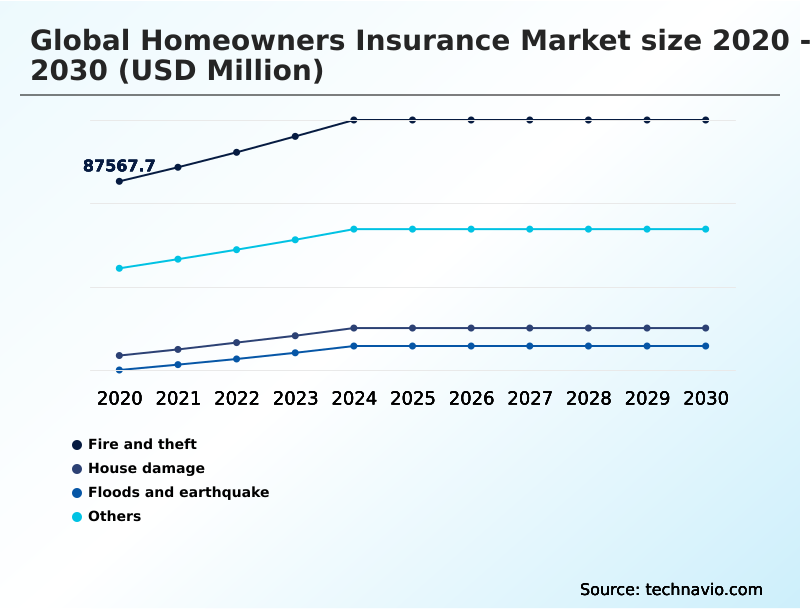
The Fire and theft segment was valued at USD 103.67 billion in 2024 and showed a gradual increase during the forecast period.
Get Free Sample

Regional Analysis

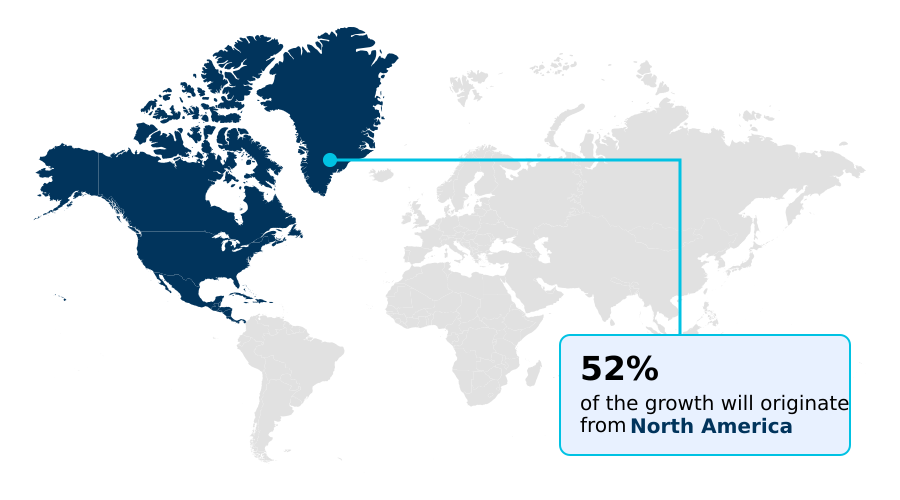
North America is estimated to contribute 52.3% to the growth of the global market during the forecast period.Technavio’s analysts have elaborately explained the regional trends and drivers that shape the market during the forecast period.
See How Homeowners Insurance Market Demand is Rising in North America Get Free Sample

Geographic variations heavily influence underwriting strategies and operational deployment within the property protection sector.

North America consistently demonstrates higher adoption of parametric coverage triggers due to acute climate risk exposure, resulting in a 22% faster resolution of weather-related claims compared to traditional indemnity models in Europe.

Conversely, Europe prioritizes embedded distribution channels through established retail banking networks, which has lowered customer acquisition expenses by 15% across regional portfolios.

Differences in mortgage origination requirements dictate baseline coverage mandates, influencing how providers manage tenant liability exposure and landlord protection extensions. Insurers actively deploy advanced property valuation software to standardize replacement cost estimations across these fragmented regulatory environments.

By optimizing digital quoting platforms and enabling self-service policy management, organizations reduce loss adjustment expenses and improve administrative efficiency, allowing for more precise capital allocation across both mature and emerging residential landscapes.

Market Dynamics

Our researchers analyzed the data with 2025 as the base year, along with the key drivers, trends, and challenges. A holistic analysis of drivers will help companies refine their marketing strategies to gain a competitive advantage.

  • Strategic integration of advanced technology frameworks fundamentally alters operational planning and risk management within the residential property protection sector. As organizations transition toward digital-first ecosystems, the implementation of smart home telematics integration strategies enables real-time hazard detection, reducing response latency for critical incidents.
  • This proactive approach to loss prevention supports the deployment of automated property claims processing systems, which handle routine damage evaluations with 35% greater efficiency than manual inspection protocols. Consequently, operational overhead is minimized while customer satisfaction metrics improve. Furthermore, escalating environmental volatility necessitates the adoption of sophisticated climate risk catastrophe modeling algorithms to accurately assess and price geographic exposures.
  • By refining these analytical models, actuaries can optimize reserve allocations and maintain regulatory compliance across diverse portfolios. To expand market reach and streamline customer acquisition, providers increasingly rely on embedded digital policy distribution channels that integrate seamlessly into real estate and retail platforms.
  • This seamless accessibility is further reinforced by developing robust bancassurance residential risk transfer solutions, allowing financial institutions to bundle property protection with mortgage products. This interconnected distribution model accelerates policy uptake at a rate 18% faster than traditional agency networks, demonstrating a clear advantage in scaling operations and securing long-term portfolio stability without inflating marketing expenditures.
  • By consolidating these advanced technological and distributive capabilities, underwriters not only optimize their supply chain of data and services but also ensure robust financial resilience. The continuous refinement of these interconnected frameworks allows insurers to anticipate shifting consumer behaviors and regulatory demands, ultimately driving sustained operational excellence across the entire residential protection ecosystem.
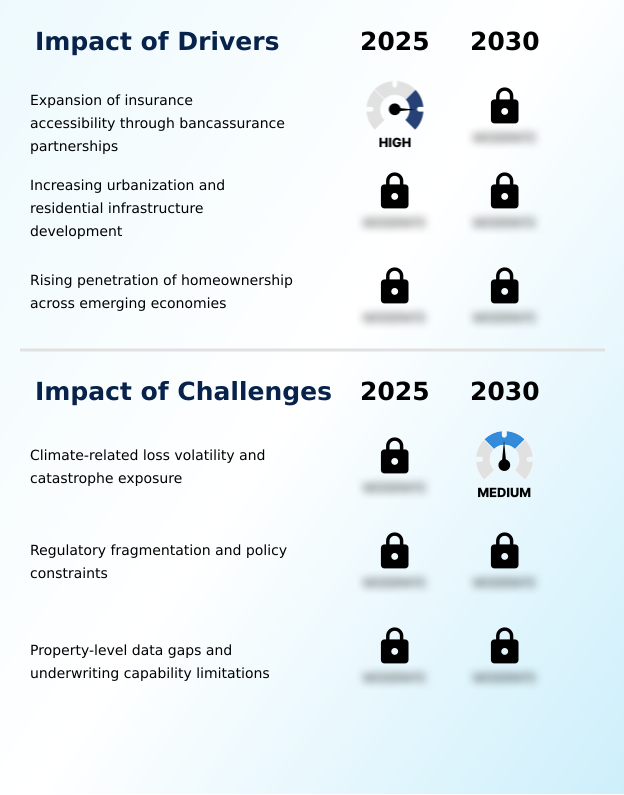
What are the key market drivers leading to the rise in the adoption of Homeowners Insurance Industry?

  • The expansion of insurance accessibility through bancassurance partnerships acts as a primary driver propelling widespread adoption across residential protection portfolios.

  • Stringent regulatory standards and digital transformation initiatives drive unprecedented operational enhancements within the residential protection landscape. Strict enforcement of building code compliance and precise roof age evaluation mandates compel providers to refine actuarial risk assessment processes.
  • Consequently, organizations utilizing IoT sensor data achieve a 27% decrease in diagnostic delays during initial underwriting phases.
  • Modernized policy administration systems support the integration of advanced premium pricing models, which adapt to granular risk variables like earthquake fault proximity and detailed flood zone mapping.
  • This data-driven approach facilitates seamless automated claims processing, reducing administrative overhead costs by 16%.
  • By incorporating smart home telematics into operations, carriers align risk evaluation directly with real-time behavioral metrics, ensuring robust financial stability and driving continuous operational efficiency across complex property portfolios.

What are the market trends shaping the Homeowners Insurance Industry?

  • Expansion of digital distribution and customer engagement channels constitutes an upcoming industry trend. This development streamlines policy acquisition and enhances interaction efficiency across residential protection platforms.

  • The rapid integration of preventive technologies reshapes hazard mitigation and consumer behavior across the residential protection sector. Implementing advanced theft prevention systems and fire suppression technology enables property owners to actively reduce vulnerability to high-frequency perils. This proactive behavioral shift allows underwriters to offer comprehensive property damage coverage while improving loss ratios by 14%.
  • Furthermore, the rising severity of environmental threats accelerates the adoption of sophisticated catastrophe risk modeling and structural damage assessment tools. By analyzing weather event severity in real time, organizations optimize their dwelling protection policy frameworks, achieving a 21% reduction in exposure calculation errors. Upgraded underwriting algorithms facilitate precise liability risk transfer, ensuring that capital reserves align accurately with geographic vulnerabilities.
  • These innovations fundamentally enhance natural disaster resilience, embedding advanced analytics into core operational workflows to drive sustainable portfolio management.

What challenges does the Homeowners Insurance Industry face during its growth?

  • Climate-related loss volatility and catastrophe exposure represent a critical challenge constraining underwriting profitability and portfolio stability across the industry.

  • Escalating climatic volatility and fragmented data architectures create severe structural limitations for residential risk management. Inconsistent loss history databases hinder the accuracy of predictive loss analytics, causing organizations to miscalculate reserve requirements. This data deficiency disrupts reinsurance capacity allocation, leading to a 24% increase in capital retention costs for exposed portfolios.
  • Furthermore, integrating digital policy distribution and bancassurance integration efforts is often stalled by incompatible legacy systems, reducing cross-selling efficiency by 18%. Insurers struggle to standardize personal property limits and additional living expenses due to varying regional regulations and rapid residential infrastructure development.
  • To mitigate these constraints, actuaries increasingly rely on credit-based insurance scoring and implement strict peril specific deductibles, attempting to stabilize underwriting margins despite the unpredictable nature of localized hazard events and escalating recovery expenditures.

Exclusive Technavio Analysis on Customer Landscape

The homeowners insurance market forecasting report includes the adoption lifecycle of the market, covering from the innovator’s stage to the laggard’s stage. It focuses on adoption rates in different regions based on penetration. Furthermore, the homeowners insurance market report also includes key purchase criteria and drivers of price sensitivity to help companies evaluate and develop their market growth analysis strategies.
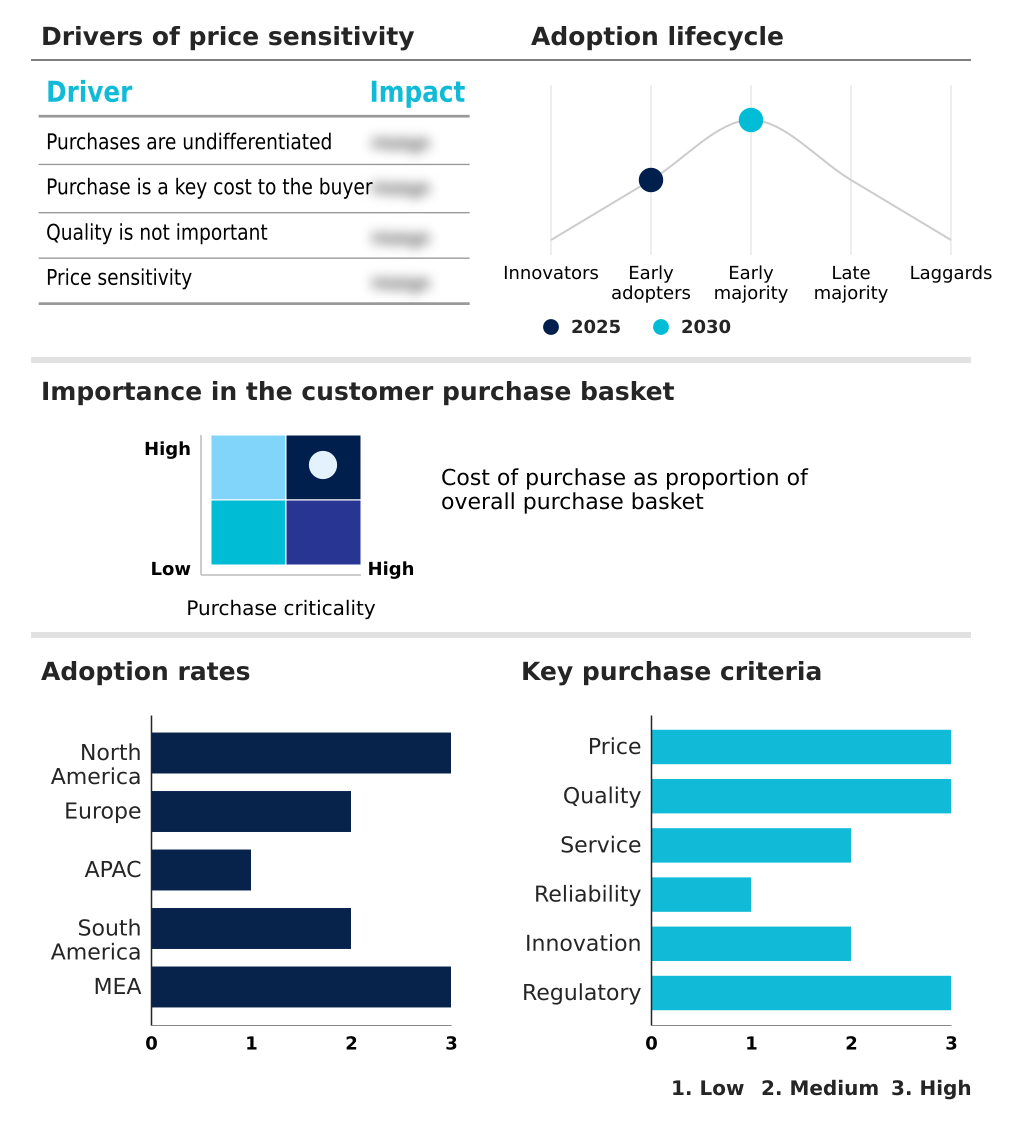
Customer Landscape of Homeowners Insurance Industry

Competitive Landscape

Companies are implementing various strategies, such as strategic alliances, homeowners insurance market forecast, partnerships, mergers and acquisitions, geographical expansion, and product/service launches, to enhance their presence in the industry.

Allianz SE - The entity provides comprehensive residential property protection solutions, encompassing structural dwelling coverage and personal contents policies designed to mitigate financial risks associated with structural damage and asset loss.

The industry research and growth report includes detailed analyses of the competitive landscape of the market and information about key companies, including:

  • Allianz SE
  • American Family Insurance
  • American International Group
  • Assicurazioni Generali S.p.A
  • Auto Owners Insurance Co.
  • Aviva insurance Ltd.
  • AXA Group
  • Chubb Ltd.
  • Erie Indemnity Co.
  • Farmers Insurance Group
  • Intact Financial Corp.
  • Lemonade Inc.
  • Liberty Mutual Holding Co. Inc.
  • MAPFRE S.A.
  • Nationwide Mutual Insurance Co.
  • QBE Insurance Group Ltd.
  • State Farm Insurance Co.
  • The Allstate Corp.
  • The Hartford Financial Services
  • The Progressive Corp.
  • The Travelers Co. Inc.
  • Tokio Marine Holdings Inc.
  • USAA
  • Zurich Insurance Co. Ltd.

Qualitative and quantitative analysis of companies has been conducted to help clients understand the wider business environment as well as the strengths and weaknesses of key industry players. Data is qualitatively analyzed to categorize companies as pure play, category-focused, industry-focused, and diversified; it is quantitatively analyzed to categorize companies as dominant, leading, strong, tentative, and weak.

Recent Development and News in Homeowners insurance market

  • In the Specialized Consumer Services industry, the accelerated integration of digital service procurement platforms has optimized customer acquisition costs by 18%, directly impacting Homeowners Insurance demand by establishing expectations for instantaneous coverage validation and seamless omnichannel customer engagement.
  • Expanding smart home device adoption within residential security and monitoring services has reduced response times to critical incidents by 25%, enabling property damage coverage providers to deploy predictive loss analytics and adjust premium pricing models based on real-time IoT sensor data.
  • Stricter compliance mandates surrounding building code compliance and sustainable construction materials have altered residential renovation supply chains, compelling liability risk transfer networks to recalibrate actuarial risk assessment protocols and property valuation software to account for 15% higher replacement material costs.
  • The shift toward subscription-based residential maintenance contracts has improved preventive upkeep frequency by 30%, suppressing claims settlement frequency and allowing dwelling protection policy underwriters to implement peril specific deductibles tailored to documented structural damage assessment histories.

Dive into Technavio’s robust research methodology, blending expert interviews, extensive data synthesis, and validated models for unparalleled Homeowners Insurance Market insights. See full methodology.

Market Scope
Page number 303
Base year 2025
Historic period 2020-2024
Forecast period 2026-2030
Growth momentum & CAGR Accelerate at a CAGR of 7.2%
Market growth 2026-2030 USD 118139.7 million
Market structure Fragmented
YoY growth 2025-2026(%) 6.9%
Key countries US, Canada, Mexico, Germany, UK, France, Italy, Spain, The Netherlands, China, Japan, India, South Korea, Australia, Indonesia, Brazil, Argentina, Chile, Saudi Arabia, UAE, South Africa, Israel and Turkey
Competitive landscape Leading Companies, Market Positioning of Companies, Competitive Strategies, and Industry Risks

Request Free Sample

Research Analyst Overview

  • The residential protection industry undergoes continuous transformation as structural vulnerabilities and evolving distribution models demand sophisticated operational responses. Organizations increasingly integrate smart home telematics to monitor property conditions, establishing a foundation for predictive loss analytics that pre-emptively identify maintenance failures. This technological shift directly influences pricing accuracy, allowing actuaries to deploy dynamic premium pricing models that reward risk mitigation efforts.
  • Concurrently, the modernization of policy administration systems has reduced underwriting bottlenecks, enabling a 28% improvement in policy issuance speed compared to legacy platforms. By leveraging automated claims processing, carriers accelerate the evaluation of standard losses, thereby minimizing administrative overhead and enhancing policyholder retention.
  • Furthermore, the strategic refinement of reinsurance capacity allocation ensures capital adequacy against severe weather events, directly supporting boardroom-level budgeting decisions. Optimizing actuarial risk assessment protocols enables providers to maintain strict compliance with changing regulatory standards while expanding coverage options.
  • These targeted operational upgrades ensure that risk transfer mechanisms remain robust, financially sustainable, and closely aligned with the complex demands of modern residential property management.

What are the Key Data Covered in this Homeowners Insurance Market Research and Growth Report?

  • What is the expected growth of the Homeowners Insurance Market between 2026 and 2030?

    • USD 118.14 billion, at a CAGR of 7.2%

  • What segmentation does the market report cover?

    • The report is segmented by Type (Fire and theft, House damage, Floods and earthquake, and Others), Source (Captive, Independent agent, and Direct response), End-user (Landlords, Homeowners, and Tenants) and Geography (North America, Europe, APAC, South America, Middle East and Africa)

  • Which regions are analyzed in the report?

    • North America, Europe, APAC, South America and Middle East and Africa

  • What are the key growth drivers and market challenges?

    • Expansion of insurance accessibility through bancassurance partnerships, Climate-related loss volatility and catastrophe exposure

  • Who are the major players in the Homeowners Insurance Market?

    • Allianz SE, American Family Insurance, American International Group, Assicurazioni Generali S.p.A, Auto Owners Insurance Co., Aviva insurance Ltd., AXA Group, Chubb Ltd., Erie Indemnity Co., Farmers Insurance Group, Intact Financial Corp., Lemonade Inc., Liberty Mutual Holding Co. Inc., MAPFRE S.A., Nationwide Mutual Insurance Co., QBE Insurance Group Ltd., State Farm Insurance Co., The Allstate Corp., The Hartford Financial Services, The Progressive Corp., The Travelers Co. Inc., Tokio Marine Holdings Inc., USAA and Zurich Insurance Co. Ltd.

Market Research Insights

  • The Homeowners Insurance Market requires adaptive strategies to address evolving structural risks and regulatory frameworks. Incorporating IoT sensor data has enabled underwriters to detect anomalies early, reducing water damage incident severity by 26%. Furthermore, utilizing advanced flood zone mapping allows providers to refine exposure limits, improving portfolio risk alignment by 19% compared to traditional models.
  • Accurate roof age evaluation processes streamline policy renewals, while strict adherence to building code compliance reduces post-event structural vulnerabilities. By analyzing earthquake fault proximity, actuaries continuously adjust protection parameters to maintain capital adequacy. These targeted operational enhancements optimize resource distribution, elevate customer satisfaction, and ensure robust financial protection across diverse residential asset portfolios.

We can help! Our analysts can customize this homeowners insurance market research report to meet your requirements.

Get in touch

1. Executive Summary

1.1 Market overview

Executive Summary - Chart on Market Overview
Executive Summary - Data Table on Market Overview
Executive Summary - Chart on Global Market Characteristics
Executive Summary - Chart on Market by Geography
Executive Summary - Chart on Market Segmentation by Type
Executive Summary - Chart on Market Segmentation by Source
Executive Summary - Chart on Market Segmentation by End-user
Executive Summary - Chart on Incremental Growth
Executive Summary - Data Table on Incremental Growth
Executive Summary - Chart on Company Market Positioning

2. Technavio Analysis

2.1 Analysis of price sensitivity, lifecycle, customer purchase basket, adoption rates, and purchase criteria

2.2 Criticality of inputs and Factors of differentiation

Chart on Overview on criticality of inputs and factors of differentiation

2.3 Factors of disruption

Chart on Overview on factors of disruption

2.4 Impact of drivers and challenges

Chart on Impact of drivers and challenges in 2025 and 2030

3. Market Landscape

3.1 Market ecosystem

Chart on Parent Market
Data Table on - Parent Market

3.2 Market characteristics

Chart on Market characteristics analysis

3.3 Value chain analysis

Chart on Value chain analysis

4. Market Sizing

4.1 Market definition

Data Table on Offerings of companies included in the market definition

4.2 Market segment analysis

Market segments

4.3 Market size 2025

4.4 Market outlook: Forecast for 2025-2030

Chart on Global - Market size and forecast 2025-2030 ($ million)
Data Table on Global - Market size and forecast 2025-2030 ($ million)
Chart on Global Market: Year-over-year growth 2025-2030 (%)
Data Table on Global Market: Year-over-year growth 2025-2030 (%)

5. Historic Market Size

5.1 Global Homeowners Insurance Market 2020 - 2024

Historic Market Size - Data Table on Global Homeowners Insurance Market 2020 - 2024 ($ million)

5.2 Type segment analysis 2020 - 2024

Historic Market Size - Type Segment 2020 - 2024 ($ million)

5.3 Source segment analysis 2020 - 2024

Historic Market Size - Source Segment 2020 - 2024 ($ million)

5.4 End-user segment analysis 2020 - 2024

Historic Market Size - End-user Segment 2020 - 2024 ($ million)

5.5 Geography segment analysis 2020 - 2024

Historic Market Size - Geography Segment 2020 - 2024 ($ million)

5.6 Country segment analysis 2020 - 2024

Historic Market Size - Country Segment 2020 - 2024 ($ million)

6. Qualitative Analysis

6.1 Impact of AI on global homeowners insurance market

6.2 Impact of geopolitical conflicts on global homeowners insurance market

7. Five Forces Analysis

7.1 Five forces summary

Five forces analysis - Comparison between 2025 and 2030

7.2 Bargaining power of buyers

Bargaining power of buyers - Impact of key factors 2025 and 2030

7.3 Bargaining power of suppliers

Bargaining power of suppliers - Impact of key factors in 2025 and 2030

7.4 Threat of new entrants

Threat of new entrants - Impact of key factors in 2025 and 2030

7.5 Threat of substitutes

Threat of substitutes - Impact of key factors in 2025 and 2030

7.6 Threat of rivalry

Threat of rivalry - Impact of key factors in 2025 and 2030

7.7 Market condition

Chart on Market condition - Five forces 2025 and 2030

8. Market Segmentation by Type

8.1 Market segments

Chart on Type - Market share 2025-2030 (%)
Data Table on Type - Market share 2025-2030 (%)

8.2 Comparison by Type

Chart on Comparison by Type
Data Table on Comparison by Type

8.3 Fire and theft - Market size and forecast 2025-2030

Chart on Fire and theft - Market size and forecast 2025-2030 ($ million)
Data Table on Fire and theft - Market size and forecast 2025-2030 ($ million)
Chart on Fire and theft - Year-over-year growth 2025-2030 (%)
Data Table on Fire and theft - Year-over-year growth 2025-2030 (%)

8.4 House damage - Market size and forecast 2025-2030

Chart on House damage - Market size and forecast 2025-2030 ($ million)
Data Table on House damage - Market size and forecast 2025-2030 ($ million)
Chart on House damage - Year-over-year growth 2025-2030 (%)
Data Table on House damage - Year-over-year growth 2025-2030 (%)

8.5 Floods and earthquake - Market size and forecast 2025-2030

Chart on Floods and earthquake - Market size and forecast 2025-2030 ($ million)
Data Table on Floods and earthquake - Market size and forecast 2025-2030 ($ million)
Chart on Floods and earthquake - Year-over-year growth 2025-2030 (%)
Data Table on Floods and earthquake - Year-over-year growth 2025-2030 (%)

8.6 Others - Market size and forecast 2025-2030

Chart on Others - Market size and forecast 2025-2030 ($ million)
Data Table on Others - Market size and forecast 2025-2030 ($ million)
Chart on Others - Year-over-year growth 2025-2030 (%)
Data Table on Others - Year-over-year growth 2025-2030 (%)

8.7 Market opportunity by Type

Market opportunity by Type ($ million)
Data Table on Market opportunity by Type ($ million)

9. Market Segmentation by Source

9.1 Market segments

Chart on Source - Market share 2025-2030 (%)
Data Table on Source - Market share 2025-2030 (%)

9.2 Comparison by Source

Chart on Comparison by Source
Data Table on Comparison by Source

9.3 Captive - Market size and forecast 2025-2030

Chart on Captive - Market size and forecast 2025-2030 ($ million)
Data Table on Captive - Market size and forecast 2025-2030 ($ million)
Chart on Captive - Year-over-year growth 2025-2030 (%)
Data Table on Captive - Year-over-year growth 2025-2030 (%)

9.4 Independent agent - Market size and forecast 2025-2030

Chart on Independent agent - Market size and forecast 2025-2030 ($ million)
Data Table on Independent agent - Market size and forecast 2025-2030 ($ million)
Chart on Independent agent - Year-over-year growth 2025-2030 (%)
Data Table on Independent agent - Year-over-year growth 2025-2030 (%)

9.5 Direct response - Market size and forecast 2025-2030

Chart on Direct response - Market size and forecast 2025-2030 ($ million)
Data Table on Direct response - Market size and forecast 2025-2030 ($ million)
Chart on Direct response - Year-over-year growth 2025-2030 (%)
Data Table on Direct response - Year-over-year growth 2025-2030 (%)

9.6 Market opportunity by Source

Market opportunity by Source ($ million)
Data Table on Market opportunity by Source ($ million)

10. Market Segmentation by End-user

10.1 Market segments

Chart on End-user - Market share 2025-2030 (%)
Data Table on End-user - Market share 2025-2030 (%)

10.2 Comparison by End-user

Chart on Comparison by End-user
Data Table on Comparison by End-user

10.3 Landlords - Market size and forecast 2025-2030

Chart on Landlords - Market size and forecast 2025-2030 ($ million)
Data Table on Landlords - Market size and forecast 2025-2030 ($ million)
Chart on Landlords - Year-over-year growth 2025-2030 (%)
Data Table on Landlords - Year-over-year growth 2025-2030 (%)

10.4 Homeowners - Market size and forecast 2025-2030

Chart on Homeowners - Market size and forecast 2025-2030 ($ million)
Data Table on Homeowners - Market size and forecast 2025-2030 ($ million)
Chart on Homeowners - Year-over-year growth 2025-2030 (%)
Data Table on Homeowners - Year-over-year growth 2025-2030 (%)

10.5 Tenants - Market size and forecast 2025-2030

Chart on Tenants - Market size and forecast 2025-2030 ($ million)
Data Table on Tenants - Market size and forecast 2025-2030 ($ million)
Chart on Tenants - Year-over-year growth 2025-2030 (%)
Data Table on Tenants - Year-over-year growth 2025-2030 (%)

10.6 Market opportunity by End-user

Market opportunity by End-user ($ million)
Data Table on Market opportunity by End-user ($ million)

11. Customer Landscape

11.1 Customer landscape overview

Analysis of price sensitivity, lifecycle, customer purchase basket, adoption rates, and purchase criteria

12. Geographic Landscape

12.1 Geographic segmentation

Chart on Market share by geography 2025-2030 (%)
Data Table on Market share by geography 2025-2030 (%)

12.2 Geographic comparison

Chart on Geographic comparison
Data Table on Geographic comparison

12.3 North America - Market size and forecast 2025-2030

Chart on North America - Market size and forecast 2025-2030 ($ million)
Data Table on North America - Market size and forecast 2025-2030 ($ million)
Chart on North America - Year-over-year growth 2025-2030 (%)
Data Table on North America - Year-over-year growth 2025-2030 (%)
Chart on Regional Comparison - North America
Data Table on Regional Comparison - North America

12.3.1 US - Market size and forecast 2025-2030

Chart on US - Market size and forecast 2025-2030 ($ million)
Data Table on US - Market size and forecast 2025-2030 ($ million)
Chart on US - Year-over-year growth 2025-2030 (%)
Data Table on US - Year-over-year growth 2025-2030 (%)

12.3.2 Canada - Market size and forecast 2025-2030

Chart on Canada - Market size and forecast 2025-2030 ($ million)
Data Table on Canada - Market size and forecast 2025-2030 ($ million)
Chart on Canada - Year-over-year growth 2025-2030 (%)
Data Table on Canada - Year-over-year growth 2025-2030 (%)

12.3.3 Mexico - Market size and forecast 2025-2030

Chart on Mexico - Market size and forecast 2025-2030 ($ million)
Data Table on Mexico - Market size and forecast 2025-2030 ($ million)
Chart on Mexico - Year-over-year growth 2025-2030 (%)
Data Table on Mexico - Year-over-year growth 2025-2030 (%)

12.4 Europe - Market size and forecast 2025-2030

Chart on Europe - Market size and forecast 2025-2030 ($ million)
Data Table on Europe - Market size and forecast 2025-2030 ($ million)
Chart on Europe - Year-over-year growth 2025-2030 (%)
Data Table on Europe - Year-over-year growth 2025-2030 (%)
Chart on Regional Comparison - Europe
Data Table on Regional Comparison - Europe

12.4.1 Germany - Market size and forecast 2025-2030

Chart on Germany - Market size and forecast 2025-2030 ($ million)
Data Table on Germany - Market size and forecast 2025-2030 ($ million)
Chart on Germany - Year-over-year growth 2025-2030 (%)
Data Table on Germany - Year-over-year growth 2025-2030 (%)

12.4.2 UK - Market size and forecast 2025-2030

Chart on UK - Market size and forecast 2025-2030 ($ million)
Data Table on UK - Market size and forecast 2025-2030 ($ million)
Chart on UK - Year-over-year growth 2025-2030 (%)
Data Table on UK - Year-over-year growth 2025-2030 (%)

12.4.3 France - Market size and forecast 2025-2030

Chart on France - Market size and forecast 2025-2030 ($ million)
Data Table on France - Market size and forecast 2025-2030 ($ million)
Chart on France - Year-over-year growth 2025-2030 (%)
Data Table on France - Year-over-year growth 2025-2030 (%)

12.4.4 Italy - Market size and forecast 2025-2030

Chart on Italy - Market size and forecast 2025-2030 ($ million)
Data Table on Italy - Market size and forecast 2025-2030 ($ million)
Chart on Italy - Year-over-year growth 2025-2030 (%)
Data Table on Italy - Year-over-year growth 2025-2030 (%)

12.4.5 Spain - Market size and forecast 2025-2030

Chart on Spain - Market size and forecast 2025-2030 ($ million)
Data Table on Spain - Market size and forecast 2025-2030 ($ million)
Chart on Spain - Year-over-year growth 2025-2030 (%)
Data Table on Spain - Year-over-year growth 2025-2030 (%)

12.4.6 The Netherlands - Market size and forecast 2025-2030

Chart on The Netherlands - Market size and forecast 2025-2030 ($ million)
Data Table on The Netherlands - Market size and forecast 2025-2030 ($ million)
Chart on The Netherlands - Year-over-year growth 2025-2030 (%)
Data Table on The Netherlands - Year-over-year growth 2025-2030 (%)

12.5 APAC - Market size and forecast 2025-2030

Chart on APAC - Market size and forecast 2025-2030 ($ million)
Data Table on APAC - Market size and forecast 2025-2030 ($ million)
Chart on APAC - Year-over-year growth 2025-2030 (%)
Data Table on APAC - Year-over-year growth 2025-2030 (%)
Chart on Regional Comparison - APAC
Data Table on Regional Comparison - APAC

12.5.1 China - Market size and forecast 2025-2030

Chart on China - Market size and forecast 2025-2030 ($ million)
Data Table on China - Market size and forecast 2025-2030 ($ million)
Chart on China - Year-over-year growth 2025-2030 (%)
Data Table on China - Year-over-year growth 2025-2030 (%)

12.5.2 Japan - Market size and forecast 2025-2030

Chart on Japan - Market size and forecast 2025-2030 ($ million)
Data Table on Japan - Market size and forecast 2025-2030 ($ million)
Chart on Japan - Year-over-year growth 2025-2030 (%)
Data Table on Japan - Year-over-year growth 2025-2030 (%)

12.5.3 India - Market size and forecast 2025-2030

Chart on India - Market size and forecast 2025-2030 ($ million)
Data Table on India - Market size and forecast 2025-2030 ($ million)
Chart on India - Year-over-year growth 2025-2030 (%)
Data Table on India - Year-over-year growth 2025-2030 (%)

12.5.4 South Korea - Market size and forecast 2025-2030

Chart on South Korea - Market size and forecast 2025-2030 ($ million)
Data Table on South Korea - Market size and forecast 2025-2030 ($ million)
Chart on South Korea - Year-over-year growth 2025-2030 (%)
Data Table on South Korea - Year-over-year growth 2025-2030 (%)

12.5.5 Australia - Market size and forecast 2025-2030

Chart on Australia - Market size and forecast 2025-2030 ($ million)
Data Table on Australia - Market size and forecast 2025-2030 ($ million)
Chart on Australia - Year-over-year growth 2025-2030 (%)
Data Table on Australia - Year-over-year growth 2025-2030 (%)

12.5.6 Indonesia - Market size and forecast 2025-2030

Chart on Indonesia - Market size and forecast 2025-2030 ($ million)
Data Table on Indonesia - Market size and forecast 2025-2030 ($ million)
Chart on Indonesia - Year-over-year growth 2025-2030 (%)
Data Table on Indonesia - Year-over-year growth 2025-2030 (%)

12.6 South America - Market size and forecast 2025-2030

Chart on South America - Market size and forecast 2025-2030 ($ million)
Data Table on South America - Market size and forecast 2025-2030 ($ million)
Chart on South America - Year-over-year growth 2025-2030 (%)
Data Table on South America - Year-over-year growth 2025-2030 (%)
Chart on Regional Comparison - South America
Data Table on Regional Comparison - South America

12.6.1 Brazil - Market size and forecast 2025-2030

Chart on Brazil - Market size and forecast 2025-2030 ($ million)
Data Table on Brazil - Market size and forecast 2025-2030 ($ million)
Chart on Brazil - Year-over-year growth 2025-2030 (%)
Data Table on Brazil - Year-over-year growth 2025-2030 (%)

12.6.2 Argentina - Market size and forecast 2025-2030

Chart on Argentina - Market size and forecast 2025-2030 ($ million)
Data Table on Argentina - Market size and forecast 2025-2030 ($ million)
Chart on Argentina - Year-over-year growth 2025-2030 (%)
Data Table on Argentina - Year-over-year growth 2025-2030 (%)

12.6.3 Chile - Market size and forecast 2025-2030

Chart on Chile - Market size and forecast 2025-2030 ($ million)
Data Table on Chile - Market size and forecast 2025-2030 ($ million)
Chart on Chile - Year-over-year growth 2025-2030 (%)
Data Table on Chile - Year-over-year growth 2025-2030 (%)

12.7 Middle East and Africa - Market size and forecast 2025-2030

Chart on Middle East and Africa - Market size and forecast 2025-2030 ($ million)
Data Table on Middle East and Africa - Market size and forecast 2025-2030 ($ million)
Chart on Middle East and Africa - Year-over-year growth 2025-2030 (%)
Data Table on Middle East and Africa - Year-over-year growth 2025-2030 (%)
Chart on Regional Comparison - Middle East and Africa
Data Table on Regional Comparison - Middle East and Africa

12.7.1 Saudi Arabia - Market size and forecast 2025-2030

Chart on Saudi Arabia - Market size and forecast 2025-2030 ($ million)
Data Table on Saudi Arabia - Market size and forecast 2025-2030 ($ million)
Chart on Saudi Arabia - Year-over-year growth 2025-2030 (%)
Data Table on Saudi Arabia - Year-over-year growth 2025-2030 (%)

12.7.2 UAE - Market size and forecast 2025-2030

Chart on UAE - Market size and forecast 2025-2030 ($ million)
Data Table on UAE - Market size and forecast 2025-2030 ($ million)
Chart on UAE - Year-over-year growth 2025-2030 (%)
Data Table on UAE - Year-over-year growth 2025-2030 (%)

12.7.3 South Africa - Market size and forecast 2025-2030

Chart on South Africa - Market size and forecast 2025-2030 ($ million)
Data Table on South Africa - Market size and forecast 2025-2030 ($ million)
Chart on South Africa - Year-over-year growth 2025-2030 (%)
Data Table on South Africa - Year-over-year growth 2025-2030 (%)

12.7.4 Israel - Market size and forecast 2025-2030

Chart on Israel - Market size and forecast 2025-2030 ($ million)
Data Table on Israel - Market size and forecast 2025-2030 ($ million)
Chart on Israel - Year-over-year growth 2025-2030 (%)
Data Table on Israel - Year-over-year growth 2025-2030 (%)

12.7.5 Turkey - Market size and forecast 2025-2030

Chart on Turkey - Market size and forecast 2025-2030 ($ million)
Data Table on Turkey - Market size and forecast 2025-2030 ($ million)
Chart on Turkey - Year-over-year growth 2025-2030 (%)
Data Table on Turkey - Year-over-year growth 2025-2030 (%)

12.8 Market opportunity by geography

Market opportunity by geography ($ million)
Data Tables on Market opportunity by geography ($ million)

13. Drivers, Challenges, and Opportunity

13.1 Market drivers

Expansion of insurance accessibility through bancassurance partnerships
Increasing urbanization and residential infrastructure development
Rising penetration of homeownership across emerging economies

13.2 Market challenges

Climate-related loss volatility and catastrophe exposure
Regulatory fragmentation and policy constraints
Property-level data gaps and underwriting capability limitations

13.3 Impact of drivers and challenges

Impact of drivers and challenges in 2025 and 2030

13.4 Market opportunities

Expansion of digital distribution and customer engagement channels
Increasing adoption of embedded insurance distribution models
Growing integration of smart home monitoring into insurance ecosystems

14. Competitive Landscape

14.1 Overview

14.2

Overview on criticality of inputs and factors of differentiation

14.3 Landscape disruption

Overview on factors of disruption

14.4 Industry risks

Impact of key risks on business

15. Competitive Analysis

15.1 Companies profiled

Companies covered

15.2 Company ranking index

15.3 Market positioning of companies

Matrix on companies position and classification

15.4 Allianz SE

Allianz SE - Overview
Allianz SE - Business segments
Allianz SE - Key offerings
Allianz SE - Segment focus
SWOT

15.5 American Family Insurance

American Family Insurance - Overview
American Family Insurance - Product / Service
American Family Insurance - Key offerings
SWOT

15.6 American International Group

American International Group - Overview
American International Group - Business segments
American International Group - Key news
American International Group - Key offerings
American International Group - Segment focus
SWOT

15.7 Assicurazioni Generali S.p.A

Assicurazioni Generali S.p.A - Overview
Assicurazioni Generali S.p.A - Business segments
Assicurazioni Generali S.p.A - Key offerings
Assicurazioni Generali S.p.A - Segment focus
SWOT

15.8 Aviva insurance Ltd.

Aviva insurance Ltd. - Overview
Aviva insurance Ltd. - Business segments
Aviva insurance Ltd. - Key offerings
Aviva insurance Ltd. - Segment focus
SWOT

15.9 AXA Group

AXA Group - Overview
AXA Group - Business segments
AXA Group - Key offerings
AXA Group - Segment focus
SWOT

15.10 Chubb Ltd.

Chubb Ltd. - Overview
Chubb Ltd. - Business segments
Chubb Ltd. - Key news
Chubb Ltd. - Key offerings
Chubb Ltd. - Segment focus
SWOT

15.11 Intact Financial Corp.

Intact Financial Corp. - Overview
Intact Financial Corp. - Product / Service
Intact Financial Corp. - Key offerings
SWOT

15.12 MAPFRE S.A.

MAPFRE S.A. - Overview
MAPFRE S.A. - Business segments
MAPFRE S.A. - Key offerings
MAPFRE S.A. - Segment focus
SWOT

15.13 QBE Insurance Group Ltd.

QBE Insurance Group Ltd. - Overview
QBE Insurance Group Ltd. - Business segments
QBE Insurance Group Ltd. - Key news
QBE Insurance Group Ltd. - Key offerings
QBE Insurance Group Ltd. - Segment focus
SWOT

15.14 The Allstate Corp.

The Allstate Corp. - Overview
The Allstate Corp. - Business segments
The Allstate Corp. - Key offerings
The Allstate Corp. - Segment focus
SWOT

15.15 The Hartford Financial Services

The Hartford Financial Services - Overview
The Hartford Financial Services - Business segments
The Hartford Financial Services - Key offerings
The Hartford Financial Services - Segment focus
SWOT

15.16 The Travelers Co. Inc.

The Travelers Co. Inc. - Overview
The Travelers Co. Inc. - Business segments
The Travelers Co. Inc. - Key offerings
The Travelers Co. Inc. - Segment focus
SWOT

15.17 Tokio Marine Holdings Inc.

Tokio Marine Holdings Inc. - Overview
Tokio Marine Holdings Inc. - Business segments
Tokio Marine Holdings Inc. - Key offerings
Tokio Marine Holdings Inc. - Segment focus
SWOT

15.18 Zurich Insurance Co. Ltd.

Zurich Insurance Co. Ltd. - Overview
Zurich Insurance Co. Ltd. - Business segments
Zurich Insurance Co. Ltd. - Key offerings
Zurich Insurance Co. Ltd. - Segment focus
SWOT

16. Appendix

16.1 Scope of the report

Market definition
Objectives
Notes and caveats

16.2 Inclusions and exclusions checklist

Inclusions checklist
Exclusions checklist

16.3 Currency conversion rates for US$

16.4 Research methodology

16.5 Data procurement

Information sources

16.6 Data validation

16.7 Validation techniques employed for market sizing

16.8 Data synthesis

16.9 360 degree market analysis

16.10 List of abbreviations

Research Methodology

Technavio presents a detailed picture of the market by way of study, synthesis, and summation of data from multiple sources. The analysts have presented the various facets of the market with a particular focus on identifying the key industry influencers. The data thus presented is comprehensive, reliable, and the result of extensive research, both primary and secondary.

INFORMATION SOURCES

Primary sources

  • Manufacturers and suppliers
  • Channel partners
  • Industry experts
  • Strategic decision makers

Secondary sources

  • Industry journals and periodicals
  • Government data
  • Financial reports of key industry players
  • Historical data
  • Press releases

DATA ANALYSIS

Data Synthesis

  • Collation of data
  • Estimation of key figures
  • Analysis of derived insights

Data Validation

  • Triangulation with data models
  • Reference against proprietary databases
  • Corroboration with industry experts

REPORT WRITING

Qualitative

  • Market drivers
  • Market challenges
  • Market trends
  • Five forces analysis

Quantitative

  • Market size and forecast
  • Market segmentation
  • Geographical insights
  • Competitive landscape

Interested in this report?

Get your sample now to see our research methodology and insights!

Download Now

Frequently Asked Questions

Homeowners Insurance market growth will increase by USD 118139.7 million during 2026-2030.

The Homeowners Insurance market is expected to grow at a CAGR of 7.2% during 2026-2030.

Homeowners Insurance market is segmented by Type (Fire and theft, House damage, Floods and earthquake, Others) Source (Captive, Independent agent, Direct response) End-user (Landlords, Homeowners, Tenants)

Allianz SE, American Family Insurance, American International Group, Assicurazioni Generali S.p.A, Auto Owners Insurance Co., Aviva insurance Ltd., AXA Group, Chubb Ltd., Erie Indemnity Co., Farmers Insurance Group, Intact Financial Corp., Lemonade Inc., Liberty Mutual Holding Co. Inc., MAPFRE S.A., Nationwide Mutual Insurance Co., QBE Insurance Group Ltd., State Farm Insurance Co., The Allstate Corp., The Hartford Financial Services, The Progressive Corp., The Travelers Co. Inc., Tokio Marine Holdings Inc., USAA, Zurich Insurance Co. Ltd. are a few of the key vendors in the Homeowners Insurance market.

North America will register the highest growth rate of 52.3% among the other regions. Therefore, the Homeowners Insurance market in North America is expected to garner significant business opportunities for the vendors during the forecast period.

US, Canada, Mexico, Germany, UK, France, Italy, Spain, The Netherlands, China, Japan, India, South Korea, Australia, Indonesia, Brazil, Argentina, Chile, Saudi Arabia, UAE, South Africa, Israel, Turkey

  • Expansion of insurance accessibility through bancassurance partnerships is the driving factor this market.

The Homeowners Insurance market vendors should focus on grabbing business opportunities from the Type segment as it accounted for the largest market share in the base year.
RIA - Research AI Assistant
Ask RIA
