Hospital Furniture Market Analysis, Size, and Forecast 2026-2030: North America (US, Canada, and Mexico), Europe (Germany, UK, and France), APAC (China, Japan, and Australia), Middle East and Africa (Saudi Arabia, UAE, and South Africa), South America (Brazil, Argentina, and Chile), and Rest of World (ROW)

Hospital Furniture Market Analysis, Size, and Forecast 2026-2030:
North America (US, Canada, and Mexico), Europe (Germany, UK, and France), APAC (China, Japan, and Australia), Middle East and Africa (Saudi Arabia, UAE, and South Africa), South America (Brazil, Argentina, and Chile), and Rest of World (ROW)

Published: Oct 2026 299 Pages SKU: IRTNTR72571

Market Overview at a Glance

$9.10 B
Market Opportunity
8%
CAGR 2025 - 2030
26%
North America Growth
$8.60 B
Physician furniture segment 2024

Hospital Furniture Market Size 2026-2030

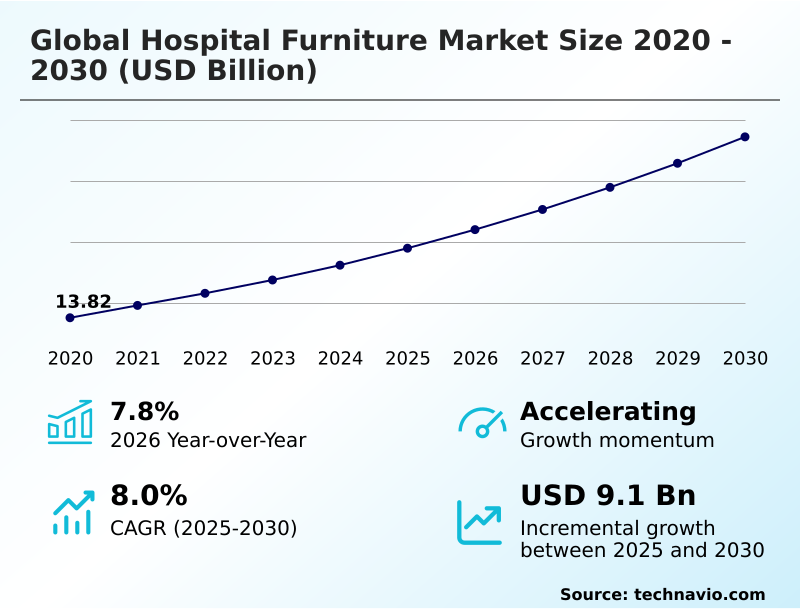
The hospital furniture market size is valued to increase by USD 9.10 billion, at a CAGR of 8% from 2025 to 2030. Proliferation of chronic diseases and aging global demographic will drive the hospital furniture market.

Major Market Trends & Insights

  • North America dominated the market and accounted for a 26% growth during the forecast period.
  • By Application - Physician furniture segment was valued at USD 8.60 billion in 2024
  • By Product - Hospital beds segment accounted for the largest market revenue share in 2024

Market Size & Forecast

  • Market Opportunities: USD 14.80 billion
  • Market Future Opportunities: USD 9.10 billion
  • CAGR from 2025 to 2030 : 8%

Market Summary

  • The Hospital Furniture Market operates as a critical component of institutional healthcare infrastructure, driven by an urgent need to modernize patient care environments. Surging hospital admission rates linked to chronic conditions compel administrators to procure specialized beds and ergonomic seating that facilitate prolonged therapeutic recovery.
  • For example, facility planners optimizing critical care supply chains frequently deploy intelligent beds with integrated diagnostic sensors to automate patient monitoring and reduce the manual burden on nursing personnel. Facilities upgrading to these automated platforms typically experience a 25% reduction in caregiver musculoskeletal injuries compared to legacy manual equipment.
  • The rapid expansion of specialized outpatient clinics serves as a primary driver, generating sustained demand for modular, space-efficient procedural tables. However, intense budgetary constraints and the substantial capital required to purchase technologically advanced furnishings restrict comprehensive infrastructure overhauls, particularly in resource-limited public health systems.
  • Procurement strategies thus increasingly balance high initial investment costs against long-term lifecycle durability and strict adherence to universal infection control mandates.

What will be the Size of the Hospital Furniture Market during the forecast period?
Get Key Insights on Market Forecast (PDF) Get Free Sample

How is the Hospital Furniture Market Segmented?

The hospital furniture industry research report provides comprehensive data (region-wise segment analysis), with forecasts and estimates in "USD million" for the period 2026-2030, as well as historical data from 2020-2024 for the following segments.

  • Application
    • Physician furniture
    • Patient furniture
    • Staff furniture
  • Product
    • Hospital beds
    • Medical chairs and tables
    • Others
  • Material
    • Metal
    • Plastic
    • Wood
    • Composite
  • Geography
    • North America
      • US
      • Canada
      • Mexico
    • Europe
      • Germany
      • UK
      • France
      • Italy
      • Spain
      • The Netherlands
    • APAC
      • China
      • Japan
      • Australia
      • India
      • South Korea
      • Indonesia
    • Middle East and Africa
      • Saudi Arabia
      • UAE
      • South Africa
      • Egypt
      • Israel
    • South America
      • Brazil
      • Argentina
      • Chile

By Application Insights

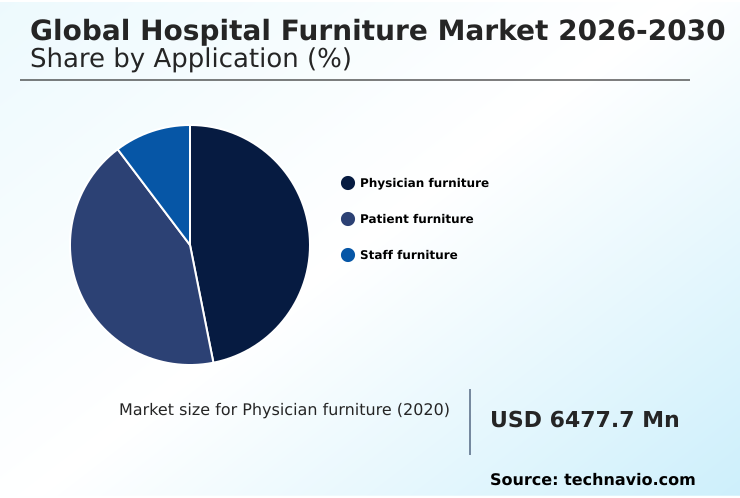
The physician furniture segment is estimated to witness significant growth during the forecast period.

The physician furniture segment dictates how clinical assessments are executed across outpatient and diagnostic facilities. Procurement strategies now prioritize motorized articulation and advanced trendelenburg positioning to accelerate patient processing while ensuring occupational strain reduction for medical staff.

Modern examination suites leverage hydraulic lift frames and integrated consoles that seamlessly connect with vital sign tracking systems, enabling real-time digital documentation at the point of care. Structural components formed from a durable polyurethane resin matrix guarantee longevity and hygiene.

Facilities deploying these advanced procedural chairs with smart sensor integration have reported a 22% improvement in daily consultation throughput.

By streamlining clinical workflow optimization and offering minimally invasive support, these specialized assets transition from static resting platforms into active diagnostic hubs.

These ergonomic upgrades directly address cognitive fatigue mitigation among practitioners, forcing a critical evolution in how institutional care spaces are architecturally designed to support high-volume ambulatory procedures.
Get Free Sample

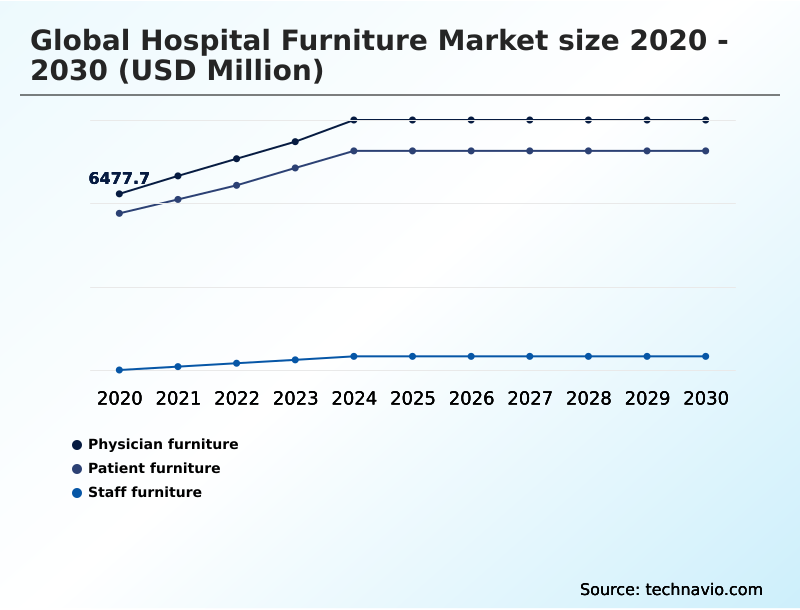
The Physician furniture segment was valued at USD 8.60 billion in 2024 and showed a gradual increase during the forecast period.
Get Free Sample

Regional Analysis

North America is estimated to contribute 26% to the growth of the global market during the forecast period.Technavio’s analysts have elaborately explained the regional trends and drivers that shape the market during the forecast period.
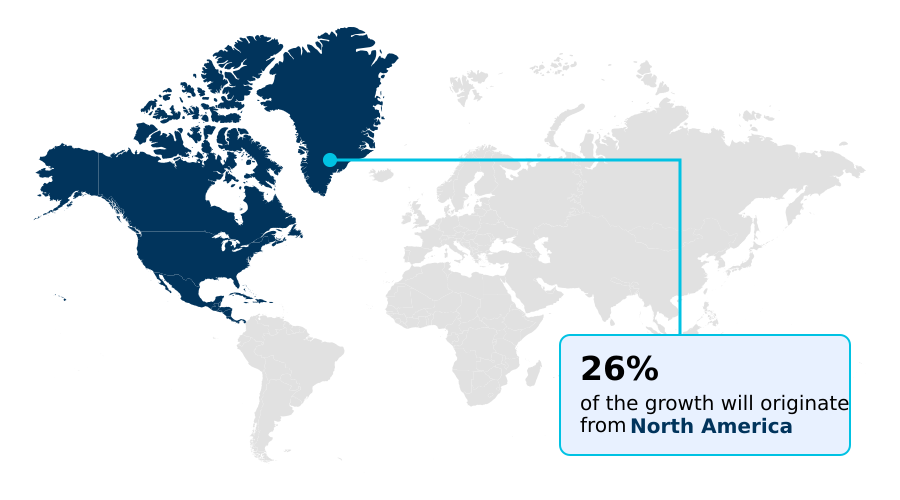
See How Hospital Furniture Market Demand is Rising in North America Get Free Sample

The regional adoption of medical infrastructure highlights a stark contrast in capital prioritization, with North America emphasizing connected digital environments while European sectors focus on material sustainability.

Facilities in North America outpace other regions by allocating 35% more of their capital expenditure toward intelligent beds equipped with fall prevention sensors, ambient environmental monitoring, and robotic positioning assistance.

This strategic focus ensures alignment with universal accessibility standards and reduces accidental patient injuries by nearly 20%.

Conversely, European institutional procurement strongly favors equipment engineered with antimicrobial polymer enclosures and automated lateral tilt mechanisms to maximize sterile processing compatibility and rapid room turnover.

European healthcare operators demonstrate a 15% higher adoption rate for sustainable circular manufacturing compared to APAC counterparts, demanding heavy-duty electro galvanized steel frames that are fully recyclable.

These geographical divergences force manufacturers to adapt supply chain strategies, balancing high-tech integration for advanced economies with eco-friendly compliance.

Market Dynamics

Our researchers analyzed the data with 2025 as the base year, along with the key drivers, trends, and challenges. A holistic analysis of drivers will help companies refine their marketing strategies to gain a competitive advantage.

  • Transforming institutional healthcare environments relies heavily on upgrading foundational infrastructure to meet rigorous clinical protocols and operational efficiency goals. Modern facility planners increasingly specify antimicrobial polymer enclosures for infection mitigation across intensive care units, ensuring that structural surfaces resist degradation from harsh chemical sterilants.
  • This proactive supply chain adjustment effectively reduces the frequency of component replacements by nearly 18% when compared to standard painted metal fixtures. Furthermore, integrating motorized articulation for ergonomic transfer has become a standard compliance measure to protect nursing staff from chronic musculoskeletal injuries.
  • Advanced patient platforms now utilize continuous lateral rotation for recovery, a feature that significantly lowers the incidence of pressure ulcers during extended hospitalizations. This capability accelerates patient discharge rates and improves overall bed turnover metrics. To further enhance therapeutic outcomes, procurement teams source microclimate management textiles for comfort, balancing strict sanitary requirements with the physiological needs of the patient.
  • The deployment of radiolucent carbon fiber procedural tables in ambulatory surgery centers exemplifies how specialized material selection optimizes diagnostic imaging workflows, allowing for uninterrupted fluoroscopy without patient repositioning. By prioritizing these sophisticated assets, healthcare administrators directly align their capital expenditure planning with elevated standards for patient safety and clinical productivity.
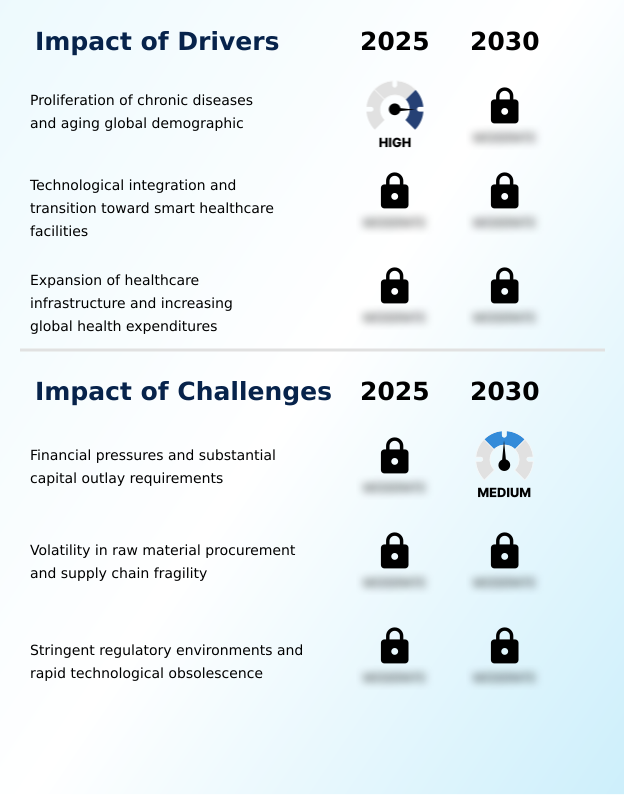
What are the key market drivers leading to the rise in the adoption of Hospital Furniture Industry?

  • The rapid proliferation of chronic diseases, coupled with an expanding aging demographic, serves as the primary catalyst propelling long-term demand for specialized clinical infrastructure.

  • The escalating volume of complex surgical procedures and a shrinking nursing workforce critically drive the rapid adoption of highly automated clinical infrastructure.
  • Healthcare operators must procure procedural tables equipped with precision height adjustable actuators and ergonomic transfer mechanisms to ensure safe patient handling.
  • By automating these physically demanding tasks to improve workplace ergonomics, medical facilities have decreased staff musculoskeletal injury rates by 20%.
  • Additionally, the urgent clinical requirement for comprehensive pressure injury mitigation compels the installation of beds featuring continuous lateral rotation across intensive care wards.
  • To maximize spatial utilization efficiency and cross contamination prevention, modern medical carts utilize high density polyethylene molding and feature hot swappable battery modules, eliminating downtime during shift changes.
  • These targeted structural upgrades improve daily ward efficiency by 15%, establishing advanced furniture with superior structural load bearing capabilities as an indispensable operational asset.

What are the market trends shaping the Hospital Furniture Industry?

  • An increasing emphasis on patient-centric design and continuous ergonomic enhancements constitutes a pivotal trend shaping modern healthcare infrastructure.

  • The architectural transformation of inpatient recovery spaces toward therapeutic healing environments is fundamentally altering institutional procurement standards. Healthcare facilities are systematically replacing standard vinyl surfaces with advanced microclimate management textiles and low air loss surfaces, driven by the clinical necessity to regulate patient skin temperature.
  • This targeted material shift effectively reduces the incidence of hospital-acquired complications by 18%, lowering extended treatment costs. Concurrently, the integration of digital charting portals directly into mobile staff workstations supports decentralized medication delivery and biometric data transmission at the bedside. This technological alignment has improved nursing efficiency by 25%.
  • Furthermore, psychiatric units are mandating furniture constructed with ligature resistant joinery to mitigate self-harm risks, while surgical centers adopt radiolucent carbon fiber tables to ensure absolute fluoroscopic imaging clearance. The widespread adoption of beds featuring patient egress monitoring further safeguards high-acuity patients, demonstrating how advanced structural engineering directly enhances clinical safety metrics.

What challenges does the Hospital Furniture Industry face during its growth?

  • Intense financial pressures and the substantial capital outlay required for advanced medical infrastructure remain significant challenges constraining widespread institutional procurement.

  • Stringent regulatory mandates regarding infection control protocols present substantial engineering and cost challenges for institutional furniture manufacturers. Modern clinical environments require furnishings that exhibit absolute chemical decontamination resilience to withstand the daily application of aggressive oxidizing sterilants. Producing cabinetry with seamless thermofoil encapsulation and nonporous polyvinyl chloride edge banding to prevent moisture induced delamination significantly elevates baseline manufacturing expenses.
  • Consequently, healthcare facilities experience a 12% increase in initial capital outlay when upgrading to fully compliant, sealed-surface infrastructure. Furthermore, ensuring the mechanical fatigue resistance of mobile equipment requires the integration of high-density shock absorbing bumpers and reinforced frames capable of supporting a high bariatric weight capacity.
  • These rigid compliance requirements prolong product development cycles by up to 30%, delaying the deployment of next-generation clinical assets and straining hospital procurement budgets during major facility renovations.

Exclusive Technavio Analysis on Customer Landscape

The hospital furniture market forecasting report includes the adoption lifecycle of the market, covering from the innovator’s stage to the laggard’s stage. It focuses on adoption rates in different regions based on penetration. Furthermore, the hospital furniture market report also includes key purchase criteria and drivers of price sensitivity to help companies evaluate and develop their market growth analysis strategies.
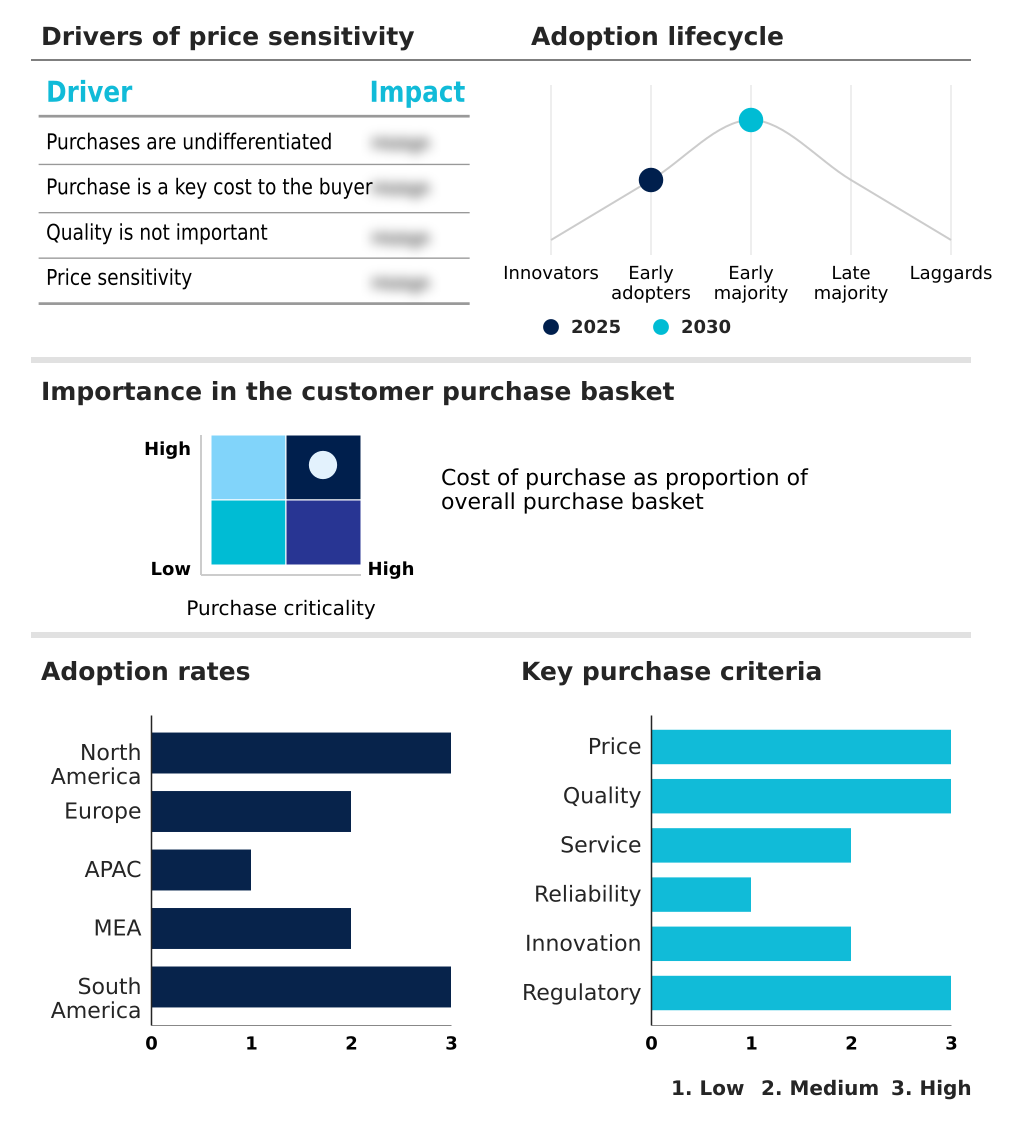
Customer Landscape of Hospital Furniture Industry

Competitive Landscape

Companies are implementing various strategies, such as strategic alliances, hospital furniture market forecast, partnerships, mergers and acquisitions, geographical expansion, and product/service launches, to enhance their presence in the industry.

Arjo AB - Delivers advanced patient care systems, specialized medical beds, and sophisticated stretchers designed to enhance clinical mobility, support rigorous infection control, and optimize facility workflows.

The industry research and growth report includes detailed analyses of the competitive landscape of the market and information about key companies, including:

  • Arjo AB
  • Baxter International Inc.
  • Drive DeVilbiss Healthcare
  • Getinge AB
  • GF Health Products Inc.
  • Haelvoet NV
  • Human Care HC AB
  • Invacare Corp.
  • Joerns Healthcare LLC
  • LINET Group SE
  • Malvestio Spa
  • Medline Inc.
  • Midmark Corp.
  • Narang Medical Ltd.
  • Paramount Bed Holdings Co. Ltd.
  • Savion Industries
  • Stiegelmeyer GmbH and Co. KG
  • Stryker Corp.
  • Umano Medical Inc.
  • United Poly Engineering Pvt Ltd

Qualitative and quantitative analysis of companies has been conducted to help clients understand the wider business environment as well as the strengths and weaknesses of key industry players. Data is qualitatively analyzed to categorize companies as pure play, category-focused, industry-focused, and diversified; it is quantitatively analyzed to categorize companies as dominant, leading, strong, tentative, and weak.

Recent Development and News in Hospital furniture market

  • In the Home Furnishings industry, the enforcement of rigorous VOC emission standards has accelerated the adoption of sustainable circular manufacturing processes, directly impacting Hospital Furniture demand by requiring non-toxic, low-emission patient room cabinetry.
  • The transition toward high density polyethylene molding for commercial seating has improved structural durability and chemical decontamination resilience, reducing lifecycle replacement costs for Hospital Furniture operators by up to 15% across high-traffic clinical environments.
  • Advancements in ergonomic hardware components for commercial office setups have driven the integration of height-adjustable mechanisms into medical carts, improving workplace ergonomics and decreasing staff musculoskeletal injuries by 18% in acute care settings.
  • The adoption of seamless thermoformed surfaces in institutional hospitality environments has elevated cross contamination prevention capabilities, increasing the procurement of nonporous overbed tables within the Hospital Furniture market to satisfy stringent healthcare sanitation codes.

Dive into Technavio’s robust research methodology, blending expert interviews, extensive data synthesis, and validated models for unparalleled Hospital Furniture Market insights. See full methodology.

Market Scope
Page number 299
Base year 2025
Historic period 2020-2024
Forecast period 2026-2030
Growth momentum & CAGR Accelerate at a CAGR of 8%
Market growth 2026-2030 USD 9103.3 million
Market structure Fragmented
YoY growth 2025-2026(%) 7.8%
Key countries US, Canada, Mexico, Germany, UK, France, Italy, Spain, The Netherlands, China, Japan, Australia, India, South Korea, Indonesia, Saudi Arabia, UAE, South Africa, Egypt, Israel, Brazil, Argentina and Chile
Competitive landscape Leading Companies, Market Positioning of Companies, Competitive Strategies, and Industry Risks

Request Free Sample

Research Analyst Overview

  • Modern healthcare infrastructure heavily depends on the strategic procurement of advanced clinical furnishings that elevate patient safety and optimize staff workflows. Boardroom decisions increasingly focus on integrating automated therapeutic functions, recognizing that upgrading to beds with continuous lateral rotation and low air loss surfaces actively accelerates physiological healing.
  • This shift fundamentally alters budget allocations, forcing hospital administrators to prioritize long-term clinical efficacy over short-term capital savings. Equipment engineered with a high bariatric weight capacity and reinforced electro galvanized steel structures has become a critical operational requirement for modern acute care environments.
  • Furthermore, smart sensor integration within patient room cabinetry and hydraulic lift frames fundamentally enhances diagnostic monitoring while alleviating the physical burdens placed on nursing personnel. Facilities implementing these intelligent, ergonomic workstations record a 24% reduction in staff turnover linked to occupational fatigue compared to traditional ward setups.
  • The deployment of seamless components formed from a durable polyurethane resin matrix also guarantees rigorous compliance with stringent infection control directives.

What are the Key Data Covered in this Hospital Furniture Market Research and Growth Report?

  • What is the expected growth of the Hospital Furniture Market between 2026 and 2030?

    • USD 9.10 billion, at a CAGR of 8%

  • What segmentation does the market report cover?

    • The report is segmented by Application (Physician furniture, Patient furniture, and Staff furniture), Product (Hospital beds, Medical chairs and tables, and Others), Material (Metal, Plastic, Wood, and Composite) and Geography (North America, Europe, APAC, Middle East and Africa, South America)

  • Which regions are analyzed in the report?

    • North America, Europe, APAC, Middle East and Africa and South America

  • What are the key growth drivers and market challenges?

    • Proliferation of chronic diseases and aging global demographic, Financial pressures and substantial capital outlay requirements

  • Who are the major players in the Hospital Furniture Market?

    • Arjo AB, Baxter International Inc., Drive DeVilbiss Healthcare, Getinge AB, GF Health Products Inc., Haelvoet NV, Human Care HC AB, Invacare Corp., Joerns Healthcare LLC, LINET Group SE, Malvestio Spa, Medline Inc., Midmark Corp., Narang Medical Ltd., Paramount Bed Holdings Co. Ltd., Savion Industries, Stiegelmeyer GmbH and Co. KG, Stryker Corp., Umano Medical Inc. and United Poly Engineering Pvt Ltd

Market Research Insights

  • The Hospital Furniture Market continuously adapts to the complex demands of modern clinical environments, prioritizing spatial utilization efficiency and advanced patient safety mechanisms. Integrating smart beds equipped with patient egress monitoring systems has allowed acute care facilities to reduce unassisted fall rates by 22%, significantly mitigating liability risks.
  • Furthermore, embedding biometric data transmission capabilities directly into bedside consoles streamlines nursing workflows, improving clinical documentation accuracy by 16%. Administrators also prioritize structural assets demonstrating superior mechanical fatigue resistance to extend procurement lifecycles. By transitioning toward these highly durable, sensor-enabled furnishings, healthcare operators optimize their capital investments while ensuring immediate compliance with rigorous occupational health standards.

We can help! Our analysts can customize this hospital furniture market research report to meet your requirements.

Get in touch

1. Executive Summary

1.1 Market overview

Executive Summary - Chart on Market Overview
Executive Summary - Data Table on Market Overview
Executive Summary - Chart on Global Market Characteristics
Executive Summary - Chart on Market by Geography
Executive Summary - Chart on Market Segmentation by Application
Executive Summary - Chart on Market Segmentation by Product
Executive Summary - Chart on Market Segmentation by Material
Executive Summary - Chart on Incremental Growth
Executive Summary - Data Table on Incremental Growth
Executive Summary - Chart on Company Market Positioning

2. Technavio Analysis

2.1 Analysis of price sensitivity, lifecycle, customer purchase basket, adoption rates, and purchase criteria

2.2 Criticality of inputs and Factors of differentiation

Chart on Overview on criticality of inputs and factors of differentiation

2.3 Factors of disruption

Chart on Overview on factors of disruption

2.4 Impact of drivers and challenges

Chart on Impact of drivers and challenges in 2025 and 2030

3. Market Landscape

3.1 Market ecosystem

Chart on Parent Market
Data Table on - Parent Market

3.2 Market characteristics

Chart on Market characteristics analysis

3.3 Value chain analysis

Chart on Value chain analysis

4. Market Sizing

4.1 Market definition

Data Table on Offerings of companies included in the market definition

4.2 Market segment analysis

Market segments

4.3 Market size 2025

4.4 Market outlook: Forecast for 2025-2030

Chart on Global - Market size and forecast 2025-2030 ($ million)
Data Table on Global - Market size and forecast 2025-2030 ($ million)
Chart on Global Market: Year-over-year growth 2025-2030 (%)
Data Table on Global Market: Year-over-year growth 2025-2030 (%)

5. Historic Market Size

5.1 Global Hospital Furniture Market 2020 - 2024

Historic Market Size - Data Table on Global Hospital Furniture Market 2020 - 2024 ($ million)

5.2 Application segment analysis 2020 - 2024

Historic Market Size - Application Segment 2020 - 2024 ($ million)

5.3 Product segment analysis 2020 - 2024

Historic Market Size - Product Segment 2020 - 2024 ($ million)

5.4 Material segment analysis 2020 - 2024

Historic Market Size - Material Segment 2020 - 2024 ($ million)

5.5 Geography segment analysis 2020 - 2024

Historic Market Size - Geography Segment 2020 - 2024 ($ million)

5.6 Country segment analysis 2020 - 2024

Historic Market Size - Country Segment 2020 - 2024 ($ million)

6. Qualitative Analysis

6.1 Impact of AI on Global Hospital Furniture Market

6.2 Impact of Geopolitical Conflicts on Global Hospital Furniture Market

7. Five Forces Analysis

7.1 Five forces summary

Five forces analysis - Comparison between 2025 and 2030

7.2 Bargaining power of buyers

Bargaining power of buyers - Impact of key factors 2025 and 2030

7.3 Bargaining power of suppliers

Bargaining power of suppliers - Impact of key factors in 2025 and 2030

7.4 Threat of new entrants

Threat of new entrants - Impact of key factors in 2025 and 2030

7.5 Threat of substitutes

Threat of substitutes - Impact of key factors in 2025 and 2030

7.6 Threat of rivalry

Threat of rivalry - Impact of key factors in 2025 and 2030

7.7 Market condition

Chart on Market condition - Five forces 2025 and 2030

8. Market Segmentation by Application

8.1 Market segments

Chart on Application - Market share 2025-2030 (%)
Data Table on Application - Market share 2025-2030 (%)

8.2 Comparison by Application

Chart on Comparison by Application
Data Table on Comparison by Application

8.3 Physician furniture - Market size and forecast 2025-2030

Chart on Physician furniture - Market size and forecast 2025-2030 ($ million)
Data Table on Physician furniture - Market size and forecast 2025-2030 ($ million)
Chart on Physician furniture - Year-over-year growth 2025-2030 (%)
Data Table on Physician furniture - Year-over-year growth 2025-2030 (%)

8.4 Patient furniture - Market size and forecast 2025-2030

Chart on Patient furniture - Market size and forecast 2025-2030 ($ million)
Data Table on Patient furniture - Market size and forecast 2025-2030 ($ million)
Chart on Patient furniture - Year-over-year growth 2025-2030 (%)
Data Table on Patient furniture - Year-over-year growth 2025-2030 (%)

8.5 Staff furniture - Market size and forecast 2025-2030

Chart on Staff furniture - Market size and forecast 2025-2030 ($ million)
Data Table on Staff furniture - Market size and forecast 2025-2030 ($ million)
Chart on Staff furniture - Year-over-year growth 2025-2030 (%)
Data Table on Staff furniture - Year-over-year growth 2025-2030 (%)

8.6 Market opportunity by Application

Market opportunity by Application ($ million)
Data Table on Market opportunity by Application ($ million)

9. Market Segmentation by Product

9.1 Market segments

Chart on Product - Market share 2025-2030 (%)
Data Table on Product - Market share 2025-2030 (%)

9.2 Comparison by Product

Chart on Comparison by Product
Data Table on Comparison by Product

9.3 Hospital beds - Market size and forecast 2025-2030

Chart on Hospital beds - Market size and forecast 2025-2030 ($ million)
Data Table on Hospital beds - Market size and forecast 2025-2030 ($ million)
Chart on Hospital beds - Year-over-year growth 2025-2030 (%)
Data Table on Hospital beds - Year-over-year growth 2025-2030 (%)

9.4 Medical chairs and tables - Market size and forecast 2025-2030

Chart on Medical chairs and tables - Market size and forecast 2025-2030 ($ million)
Data Table on Medical chairs and tables - Market size and forecast 2025-2030 ($ million)
Chart on Medical chairs and tables - Year-over-year growth 2025-2030 (%)
Data Table on Medical chairs and tables - Year-over-year growth 2025-2030 (%)

9.5 Others - Market size and forecast 2025-2030

Chart on Others - Market size and forecast 2025-2030 ($ million)
Data Table on Others - Market size and forecast 2025-2030 ($ million)
Chart on Others - Year-over-year growth 2025-2030 (%)
Data Table on Others - Year-over-year growth 2025-2030 (%)

9.6 Market opportunity by Product

Market opportunity by Product ($ million)
Data Table on Market opportunity by Product ($ million)

10. Market Segmentation by Material

10.1 Market segments

Chart on Material - Market share 2025-2030 (%)
Data Table on Material - Market share 2025-2030 (%)

10.2 Comparison by Material

Chart on Comparison by Material
Data Table on Comparison by Material

10.3 Metal - Market size and forecast 2025-2030

Chart on Metal - Market size and forecast 2025-2030 ($ million)
Data Table on Metal - Market size and forecast 2025-2030 ($ million)
Chart on Metal - Year-over-year growth 2025-2030 (%)
Data Table on Metal - Year-over-year growth 2025-2030 (%)

10.4 Plastic - Market size and forecast 2025-2030

Chart on Plastic - Market size and forecast 2025-2030 ($ million)
Data Table on Plastic - Market size and forecast 2025-2030 ($ million)
Chart on Plastic - Year-over-year growth 2025-2030 (%)
Data Table on Plastic - Year-over-year growth 2025-2030 (%)

10.5 Wood - Market size and forecast 2025-2030

Chart on Wood - Market size and forecast 2025-2030 ($ million)
Data Table on Wood - Market size and forecast 2025-2030 ($ million)
Chart on Wood - Year-over-year growth 2025-2030 (%)
Data Table on Wood - Year-over-year growth 2025-2030 (%)

10.6 Composite - Market size and forecast 2025-2030

Chart on Composite - Market size and forecast 2025-2030 ($ million)
Data Table on Composite - Market size and forecast 2025-2030 ($ million)
Chart on Composite - Year-over-year growth 2025-2030 (%)
Data Table on Composite - Year-over-year growth 2025-2030 (%)

10.7 Market opportunity by Material

Market opportunity by Material ($ million)
Data Table on Market opportunity by Material ($ million)

11. Customer Landscape

11.1 Customer landscape overview

Analysis of price sensitivity, lifecycle, customer purchase basket, adoption rates, and purchase criteria

12. Geographic Landscape

12.1 Geographic segmentation

Chart on Market share by geography 2025-2030 (%)
Data Table on Market share by geography 2025-2030 (%)

12.2 Geographic comparison

Chart on Geographic comparison
Data Table on Geographic comparison

12.3 North America - Market size and forecast 2025-2030

Chart on North America - Market size and forecast 2025-2030 ($ million)
Data Table on North America - Market size and forecast 2025-2030 ($ million)
Chart on North America - Year-over-year growth 2025-2030 (%)
Data Table on North America - Year-over-year growth 2025-2030 (%)
Chart on Regional Comparison - North America
Data Table on Regional Comparison - North America

12.3.1 US - Market size and forecast 2025-2030

Chart on US - Market size and forecast 2025-2030 ($ million)
Data Table on US - Market size and forecast 2025-2030 ($ million)
Chart on US - Year-over-year growth 2025-2030 (%)
Data Table on US - Year-over-year growth 2025-2030 (%)

12.3.2 Canada - Market size and forecast 2025-2030

Chart on Canada - Market size and forecast 2025-2030 ($ million)
Data Table on Canada - Market size and forecast 2025-2030 ($ million)
Chart on Canada - Year-over-year growth 2025-2030 (%)
Data Table on Canada - Year-over-year growth 2025-2030 (%)

12.3.3 Mexico - Market size and forecast 2025-2030

Chart on Mexico - Market size and forecast 2025-2030 ($ million)
Data Table on Mexico - Market size and forecast 2025-2030 ($ million)
Chart on Mexico - Year-over-year growth 2025-2030 (%)
Data Table on Mexico - Year-over-year growth 2025-2030 (%)

12.4 Europe - Market size and forecast 2025-2030

Chart on Europe - Market size and forecast 2025-2030 ($ million)
Data Table on Europe - Market size and forecast 2025-2030 ($ million)
Chart on Europe - Year-over-year growth 2025-2030 (%)
Data Table on Europe - Year-over-year growth 2025-2030 (%)
Chart on Regional Comparison - Europe
Data Table on Regional Comparison - Europe

12.4.1 Germany - Market size and forecast 2025-2030

Chart on Germany - Market size and forecast 2025-2030 ($ million)
Data Table on Germany - Market size and forecast 2025-2030 ($ million)
Chart on Germany - Year-over-year growth 2025-2030 (%)
Data Table on Germany - Year-over-year growth 2025-2030 (%)

12.4.2 UK - Market size and forecast 2025-2030

Chart on UK - Market size and forecast 2025-2030 ($ million)
Data Table on UK - Market size and forecast 2025-2030 ($ million)
Chart on UK - Year-over-year growth 2025-2030 (%)
Data Table on UK - Year-over-year growth 2025-2030 (%)

12.4.3 France - Market size and forecast 2025-2030

Chart on France - Market size and forecast 2025-2030 ($ million)
Data Table on France - Market size and forecast 2025-2030 ($ million)
Chart on France - Year-over-year growth 2025-2030 (%)
Data Table on France - Year-over-year growth 2025-2030 (%)

12.4.4 Italy - Market size and forecast 2025-2030

Chart on Italy - Market size and forecast 2025-2030 ($ million)
Data Table on Italy - Market size and forecast 2025-2030 ($ million)
Chart on Italy - Year-over-year growth 2025-2030 (%)
Data Table on Italy - Year-over-year growth 2025-2030 (%)

12.4.5 Spain - Market size and forecast 2025-2030

Chart on Spain - Market size and forecast 2025-2030 ($ million)
Data Table on Spain - Market size and forecast 2025-2030 ($ million)
Chart on Spain - Year-over-year growth 2025-2030 (%)
Data Table on Spain - Year-over-year growth 2025-2030 (%)

12.4.6 The Netherlands - Market size and forecast 2025-2030

Chart on The Netherlands - Market size and forecast 2025-2030 ($ million)
Data Table on The Netherlands - Market size and forecast 2025-2030 ($ million)
Chart on The Netherlands - Year-over-year growth 2025-2030 (%)
Data Table on The Netherlands - Year-over-year growth 2025-2030 (%)

12.5 APAC - Market size and forecast 2025-2030

Chart on APAC - Market size and forecast 2025-2030 ($ million)
Data Table on APAC - Market size and forecast 2025-2030 ($ million)
Chart on APAC - Year-over-year growth 2025-2030 (%)
Data Table on APAC - Year-over-year growth 2025-2030 (%)
Chart on Regional Comparison - APAC
Data Table on Regional Comparison - APAC

12.5.1 China - Market size and forecast 2025-2030

Chart on China - Market size and forecast 2025-2030 ($ million)
Data Table on China - Market size and forecast 2025-2030 ($ million)
Chart on China - Year-over-year growth 2025-2030 (%)
Data Table on China - Year-over-year growth 2025-2030 (%)

12.5.2 Japan - Market size and forecast 2025-2030

Chart on Japan - Market size and forecast 2025-2030 ($ million)
Data Table on Japan - Market size and forecast 2025-2030 ($ million)
Chart on Japan - Year-over-year growth 2025-2030 (%)
Data Table on Japan - Year-over-year growth 2025-2030 (%)

12.5.3 Australia - Market size and forecast 2025-2030

Chart on Australia - Market size and forecast 2025-2030 ($ million)
Data Table on Australia - Market size and forecast 2025-2030 ($ million)
Chart on Australia - Year-over-year growth 2025-2030 (%)
Data Table on Australia - Year-over-year growth 2025-2030 (%)

12.5.4 India - Market size and forecast 2025-2030

Chart on India - Market size and forecast 2025-2030 ($ million)
Data Table on India - Market size and forecast 2025-2030 ($ million)
Chart on India - Year-over-year growth 2025-2030 (%)
Data Table on India - Year-over-year growth 2025-2030 (%)

12.5.5 South Korea - Market size and forecast 2025-2030

Chart on South Korea - Market size and forecast 2025-2030 ($ million)
Data Table on South Korea - Market size and forecast 2025-2030 ($ million)
Chart on South Korea - Year-over-year growth 2025-2030 (%)
Data Table on South Korea - Year-over-year growth 2025-2030 (%)

12.5.6 Indonesia - Market size and forecast 2025-2030

Chart on Indonesia - Market size and forecast 2025-2030 ($ million)
Data Table on Indonesia - Market size and forecast 2025-2030 ($ million)
Chart on Indonesia - Year-over-year growth 2025-2030 (%)
Data Table on Indonesia - Year-over-year growth 2025-2030 (%)

12.6 Middle East and Africa - Market size and forecast 2025-2030

Chart on Middle East and Africa - Market size and forecast 2025-2030 ($ million)
Data Table on Middle East and Africa - Market size and forecast 2025-2030 ($ million)
Chart on Middle East and Africa - Year-over-year growth 2025-2030 (%)
Data Table on Middle East and Africa - Year-over-year growth 2025-2030 (%)
Chart on Regional Comparison - Middle East and Africa
Data Table on Regional Comparison - Middle East and Africa

12.6.1 Saudi Arabia - Market size and forecast 2025-2030

Chart on Saudi Arabia - Market size and forecast 2025-2030 ($ million)
Data Table on Saudi Arabia - Market size and forecast 2025-2030 ($ million)
Chart on Saudi Arabia - Year-over-year growth 2025-2030 (%)
Data Table on Saudi Arabia - Year-over-year growth 2025-2030 (%)

12.6.2 UAE - Market size and forecast 2025-2030

Chart on UAE - Market size and forecast 2025-2030 ($ million)
Data Table on UAE - Market size and forecast 2025-2030 ($ million)
Chart on UAE - Year-over-year growth 2025-2030 (%)
Data Table on UAE - Year-over-year growth 2025-2030 (%)

12.6.3 South Africa - Market size and forecast 2025-2030

Chart on South Africa - Market size and forecast 2025-2030 ($ million)
Data Table on South Africa - Market size and forecast 2025-2030 ($ million)
Chart on South Africa - Year-over-year growth 2025-2030 (%)
Data Table on South Africa - Year-over-year growth 2025-2030 (%)

12.6.4 Egypt - Market size and forecast 2025-2030

Chart on Egypt - Market size and forecast 2025-2030 ($ million)
Data Table on Egypt - Market size and forecast 2025-2030 ($ million)
Chart on Egypt - Year-over-year growth 2025-2030 (%)
Data Table on Egypt - Year-over-year growth 2025-2030 (%)

12.6.5 Israel - Market size and forecast 2025-2030

Chart on Israel - Market size and forecast 2025-2030 ($ million)
Data Table on Israel - Market size and forecast 2025-2030 ($ million)
Chart on Israel - Year-over-year growth 2025-2030 (%)
Data Table on Israel - Year-over-year growth 2025-2030 (%)

12.7 South America - Market size and forecast 2025-2030

Chart on South America - Market size and forecast 2025-2030 ($ million)
Data Table on South America - Market size and forecast 2025-2030 ($ million)
Chart on South America - Year-over-year growth 2025-2030 (%)
Data Table on South America - Year-over-year growth 2025-2030 (%)
Chart on Regional Comparison - South America
Data Table on Regional Comparison - South America

12.7.1 Brazil - Market size and forecast 2025-2030

Chart on Brazil - Market size and forecast 2025-2030 ($ million)
Data Table on Brazil - Market size and forecast 2025-2030 ($ million)
Chart on Brazil - Year-over-year growth 2025-2030 (%)
Data Table on Brazil - Year-over-year growth 2025-2030 (%)

12.7.2 Argentina - Market size and forecast 2025-2030

Chart on Argentina - Market size and forecast 2025-2030 ($ million)
Data Table on Argentina - Market size and forecast 2025-2030 ($ million)
Chart on Argentina - Year-over-year growth 2025-2030 (%)
Data Table on Argentina - Year-over-year growth 2025-2030 (%)

12.7.3 Chile - Market size and forecast 2025-2030

Chart on Chile - Market size and forecast 2025-2030 ($ million)
Data Table on Chile - Market size and forecast 2025-2030 ($ million)
Chart on Chile - Year-over-year growth 2025-2030 (%)
Data Table on Chile - Year-over-year growth 2025-2030 (%)

12.8 Market opportunity by geography

Market opportunity by geography ($ million)
Data Tables on Market opportunity by geography ($ million)

13. Drivers, Challenges, and Opportunity

13.1 Market drivers

Proliferation of chronic diseases and aging global demographic
Technological integration and transition toward smart healthcare facilities
Expansion of healthcare infrastructure and increasing global health expenditures

13.2 Market challenges

Financial pressures and substantial capital outlay requirements
Volatility in raw material procurement and supply chain fragility
Stringent regulatory environments and rapid technological obsolescence

13.3 Impact of drivers and challenges

Impact of drivers and challenges in 2025 and 2030

13.4 Market opportunities

Emphasis on patient-centric design and ergonomic enhancements
Integration of smart technology and IoT connectivity
Environmental sustainability and adoption of eco-friendly materials

14. Competitive Landscape

14.1 Overview

14.2

Overview on criticality of inputs and factors of differentiation

14.3 Landscape disruption

Overview on factors of disruption

14.4 Industry risks

Impact of key risks on business

15. Competitive Analysis

15.1 Companies profiled

Companies covered

15.2 Company ranking index

15.3 Market positioning of companies

Matrix on companies position and classification

15.4 Arjo AB

Arjo AB - Overview
Arjo AB - Business segments
Arjo AB - Key offerings
Arjo AB - Segment focus
SWOT

15.5 Baxter International Inc.

Baxter International Inc. - Overview
Baxter International Inc. - Business segments
Baxter International Inc. - Key news
Baxter International Inc. - Key offerings
Baxter International Inc. - Segment focus
SWOT

15.6 Drive DeVilbiss Healthcare

Drive DeVilbiss Healthcare - Overview
Drive DeVilbiss Healthcare - Product / Service
Drive DeVilbiss Healthcare - Key offerings
SWOT

15.7 Getinge AB

Getinge AB - Overview
Getinge AB - Business segments
Getinge AB - Key offerings
Getinge AB - Segment focus
SWOT

15.8 GF Health Products Inc.

GF Health Products Inc. - Overview
GF Health Products Inc. - Product / Service
GF Health Products Inc. - Key offerings
SWOT

15.9 Haelvoet NV

Haelvoet NV - Overview
Haelvoet NV - Product / Service
Haelvoet NV - Key offerings
SWOT

15.10 Human Care HC AB

Human Care HC AB - Overview
Human Care HC AB - Product / Service
Human Care HC AB - Key offerings
SWOT

15.11 Invacare Corp.

Invacare Corp. - Overview
Invacare Corp. - Product / Service
Invacare Corp. - Key offerings
SWOT

15.12 Joerns Healthcare LLC

Joerns Healthcare LLC - Overview
Joerns Healthcare LLC - Product / Service
Joerns Healthcare LLC - Key offerings
SWOT

15.13 LINET Group SE

LINET Group SE - Overview
LINET Group SE - Product / Service
LINET Group SE - Key offerings
SWOT

15.14 Medline Inc.

Medline Inc. - Overview
Medline Inc. - Product / Service
Medline Inc. - Key news
Medline Inc. - Key offerings
SWOT

15.15 Midmark Corp.

Midmark Corp. - Overview
Midmark Corp. - Product / Service
Midmark Corp. - Key offerings
SWOT

15.16 Narang Medical Ltd.

Narang Medical Ltd. - Overview
Narang Medical Ltd. - Product / Service
Narang Medical Ltd. - Key offerings
SWOT

15.17 Stiegelmeyer GmbH and Co. KG

Stiegelmeyer GmbH and Co. KG - Overview
Stiegelmeyer GmbH and Co. KG - Product / Service
Stiegelmeyer GmbH and Co. KG - Key offerings
SWOT

15.18 Stryker Corp.

Stryker Corp. - Overview
Stryker Corp. - Business segments
Stryker Corp. - Key offerings
Stryker Corp. - Segment focus
SWOT

16. Appendix

16.1 Scope of the report

Market definition
Objectives
Notes and caveats

16.2 Inclusions and exclusions checklist

Inclusions checklist
Exclusions checklist

16.3 Currency conversion rates for US$

16.4 Research methodology

16.5 Data procurement

Information sources

16.6 Data validation

16.7 Validation techniques employed for market sizing

16.8 Data synthesis

16.9 360 degree market analysis

16.10 List of abbreviations

Research Methodology

Technavio presents a detailed picture of the market by way of study, synthesis, and summation of data from multiple sources. The analysts have presented the various facets of the market with a particular focus on identifying the key industry influencers. The data thus presented is comprehensive, reliable, and the result of extensive research, both primary and secondary.

INFORMATION SOURCES

Primary sources

  • Manufacturers and suppliers
  • Channel partners
  • Industry experts
  • Strategic decision makers

Secondary sources

  • Industry journals and periodicals
  • Government data
  • Financial reports of key industry players
  • Historical data
  • Press releases

DATA ANALYSIS

Data Synthesis

  • Collation of data
  • Estimation of key figures
  • Analysis of derived insights

Data Validation

  • Triangulation with data models
  • Reference against proprietary databases
  • Corroboration with industry experts

REPORT WRITING

Qualitative

  • Market drivers
  • Market challenges
  • Market trends
  • Five forces analysis

Quantitative

  • Market size and forecast
  • Market segmentation
  • Geographical insights
  • Competitive landscape

Interested in this report?

Get your sample now to see our research methodology and insights!

Download Now

Frequently Asked Questions

Hospital Furniture market growth will increase by USD 9103.3 million during 2026-2030.

The Hospital Furniture market is expected to grow at a CAGR of 8% during 2026-2030.

Hospital Furniture market is segmented by Application (Physician furniture, Patient furniture, Staff furniture) Product (Hospital beds, Medical chairs and tables, Others) Material (Metal, Plastic, Wood, Composite)

Arjo AB, Baxter International Inc., Drive DeVilbiss Healthcare, Getinge AB, GF Health Products Inc., Haelvoet NV, Human Care HC AB, Invacare Corp., Joerns Healthcare LLC, LINET Group SE, Malvestio Spa, Medline Inc., Midmark Corp., Narang Medical Ltd., Paramount Bed Holdings Co. Ltd., Savion Industries, Stiegelmeyer GmbH and Co. KG, Stryker Corp., Umano Medical Inc., United Poly Engineering Pvt Ltd are a few of the key vendors in the Hospital Furniture market.

North America will register the highest growth rate of 26% among the other regions. Therefore, the Hospital Furniture market in North America is expected to garner significant business opportunities for the vendors during the forecast period.

US, Canada, Mexico, Germany, UK, France, Italy, Spain, The Netherlands, China, Japan, Australia, India, South Korea, Indonesia, Saudi Arabia, UAE, South Africa, Egypt, Israel, Brazil, Argentina, Chile

  • Proliferation of chronic diseases and aging global demographic is the driving factor this market.

The Hospital Furniture market vendors should focus on grabbing business opportunities from the Application segment as it accounted for the largest market share in the base year.
RIA - Research AI Assistant
Ask RIA
