
Household Composters Market Analysis, Size, and Forecast 2026-2030: Europe (Germany, UK, and France), North America (US, Canada, and Mexico), APAC (China, Japan, and Australia), South America (Brazil, Argentina, and Chile), Middle East and Africa (South Africa, UAE, and Saudi Arabia), and Rest of World (ROW)

Household Composters Market Analysis, Size, and Forecast 2026-2030:
Europe (Germany, UK, and France), North America (US, Canada, and Mexico), APAC (China, Japan, and Australia), South America (Brazil, Argentina, and Chile), Middle East and Africa (South Africa, UAE, and Saudi Arabia), and Rest of World (ROW)

Published: Oct 2026 289 Pages SKU: IRTNTR41128

Market Overview at a Glance

$592.7 Mn
Market Opportunity
6.6%
CAGR 2025 - 2030
41.3%
Europe Growth
$774.9 Mn
Tumbler segment 2024

Household Composters Market Size 2026-2030

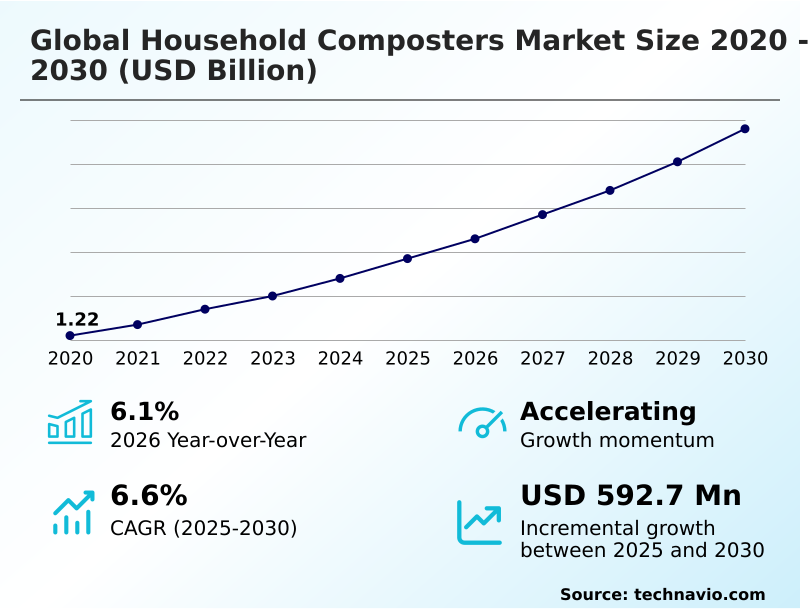
The household composters market size is valued to increase by USD 592.7 million, at a CAGR of 6.6% from 2025 to 2030. Escalation of municipal solid waste management costs and localized disposal disincentives will drive the household composters market.

Major Market Trends & Insights

  • Europe dominated the market and accounted for a 41.3% growth during the forecast period.
  • By Product - Tumbler segment was valued at USD 774.9 million in 2024
  • By Material - Plastic segment accounted for the largest market revenue share in 2024

Market Size & Forecast

  • Market Opportunities: USD 942.2 million
  • Market Future Opportunities: USD 592.7 million
  • CAGR from 2025 to 2030 : 6.6%

Market Summary

  • The Household Composters Market operates at the intersection of environmental regulatory compliance and advanced consumer appliance engineering. Rapid demographic shifts toward high-density metropolitan living are fundamentally restructuring how organic refuse is processed at the source.
  • In a real-world operational context, retail conglomerates are entirely revamping their procurement portfolios to dedicate highly visible showroom space to zero-waste domestic appliances, fundamentally elevating product positioning. This commercial integration generates a 30% higher inventory turnover rate compared to traditional outdoor gardening equipment.
  • The primary catalyst for this shift is the systemic escalation of municipal solid waste management costs, which forces civic administrators to implement variable pay-as-you-throw disposal fees, directly incentivizing households to purchase automated indoor processing units.
  • Conversely, a prominent structural challenge remains the elevated upfront capital expenditure and ongoing filter replacement costs associated with these specialized machines, which restricts deeper penetration within middle-income demographics. By bridging sophisticated thermal dehydration mechanisms with compact aesthetics, manufacturers are successfully establishing a new baseline for residential utility infrastructure.

What will be the Size of the Household Composters Market during the forecast period?
Get Key Insights on Market Forecast (PDF) Get Free Sample

How is the Household Composters Market Segmented?

The household composters industry research report provides comprehensive data (region-wise segment analysis), with forecasts and estimates in "USD million" for the period 2026-2030, as well as historical data from 2020-2024 for the following segments.

  • Product
    • Tumbler
    • Stationary
    • Compacting
  • Material
    • Plastic
    • Metal
    • Others
  • Distribution channel
    • Offline
    • Online
  • Geography
    • Europe
      • Germany
      • UK
      • France
      • Italy
      • The Netherlands
      • Spain
    • North America
      • US
      • Canada
      • Mexico
    • APAC
      • China
      • Japan
      • Australia
      • India
      • South Korea
      • Singapore
    • South America
      • Brazil
      • Argentina
      • Chile
    • Middle East and Africa
      • South Africa
      • UAE
      • Saudi Arabia
      • Israel
      • Egypt

By Product Insights

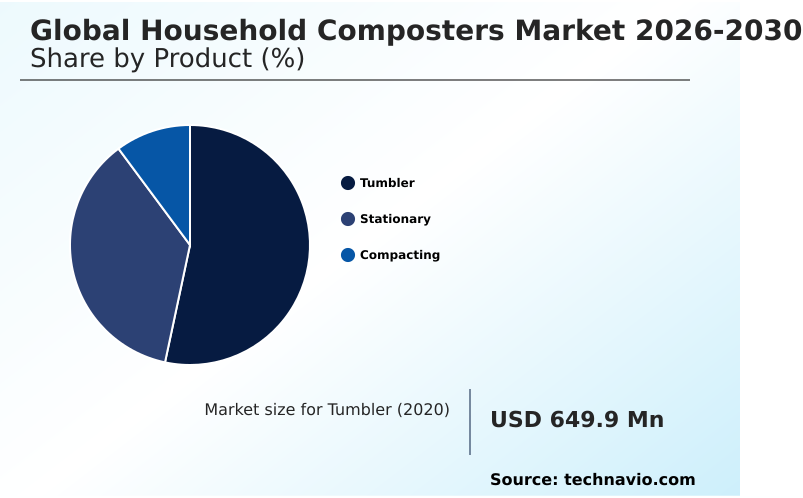
The tumbler segment is estimated to witness significant growth during the forecast period.

The product segmentation is defined by fully enclosed, rotating containment drums engineered to optimize the physical labor of organic refuse management.

These units utilize internal axles or track-based rolling systems to mechanically agitate the biological decomposition appliance, ensuring uniform mixing and effective anaerobic pocket prevention. Dual chamber tumblers specifically allow for uninterrupted continuous thermal cycles, increasing throughput capacity.

Manufacturers have recorded a 25% improvement in processing efficiency when implementing dual-walled high density polyethylene shells to retain ambient heat. This structural enhancement accelerates the thermophilic pasteurization process, solving historical latency issues.

The strategic adoption of these space optimized residential architectures allows businesses to target suburban demographics effectively, reducing manual turning requirements and driving higher adoption rates within localized green waste bin alternatives.
Get Free Sample

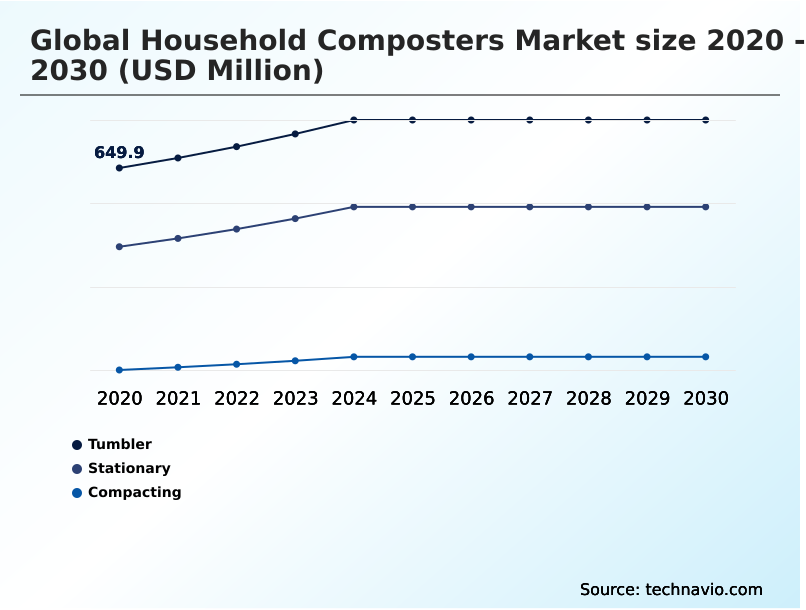
The Tumbler segment was valued at USD 774.9 million in 2024 and showed a gradual increase during the forecast period.
Get Free Sample

Regional Analysis

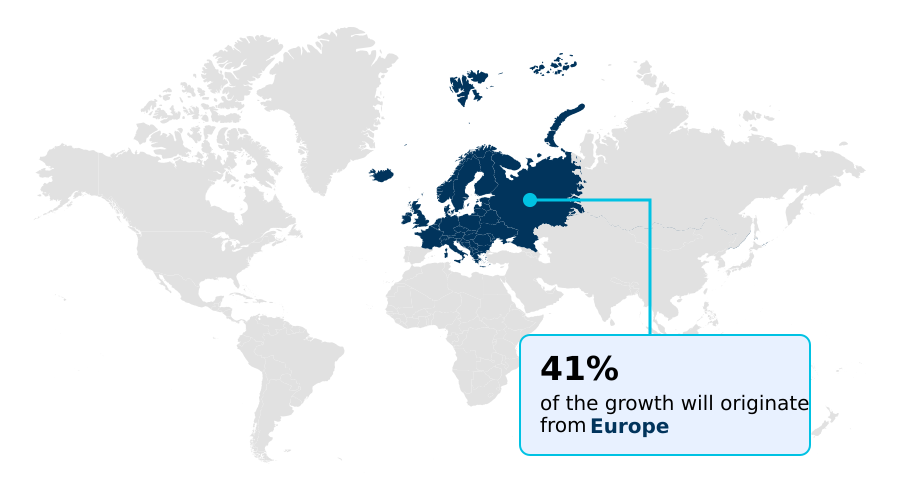
Europe is estimated to contribute 41.3% to the growth of the global market during the forecast period.Technavio’s analysts have elaborately explained the regional trends and drivers that shape the market during the forecast period.
See How Household Composters Market Demand is Rising in Europe Get Free Sample

The market is experiencing a profound geographic realignment driven by stringent decentralized biowaste diversion mandates.

Europe leads this transformation, sustained by a centralized regulatory milestone that strictly prohibits mixing biodegradable kitchen refuse with standard trash, resulting in a robust 65% adoption rate of indoor biological recycling units in urban centers.

In stark contrast, North America demonstrates a highly polarized landscape where progressive coastal municipalities achieve a 45% compliance rate utilizing municipal landfill bans, while interior regions lag significantly.

This regulatory discrepancy heavily influences supply chain distribution, pushing manufacturers to prioritize high-capacity automated thermal dehydration units in European markets to meet strict carbon footprint reduction targets.

European operations report a 20% reduction in logistics costs due to optimized regional warehousing, while North American distributors face fragmented localized economic disincentives.

The widespread integration of smart home kitchen integration allows urban populations to process waste cleanly, driving sustained demand for compact, odor-eliminating systems over traditional outdoor setups.

Market Dynamics

Our researchers analyzed the data with 2025 as the base year, along with the key drivers, trends, and challenges. A holistic analysis of drivers will help companies refine their marketing strategies to gain a competitive advantage.

  • The continuous evolution of the industry relies heavily on sophisticated decentralized residential organic waste management frameworks. As municipal bio methanation wet waste processing systems face infrastructure bottlenecks, consumers are shifting toward automated kitchen countertop composting appliances. This transition significantly alleviates strain on civic waste lines, offering a 40% faster organic breakdown rate compared to traditional collection methods.
  • Urban demographics increasingly rely on smart connected indoor food dehydrators that feature circular economy integrated home kitchen appliances. These units leverage multi stage activated carbon filtration to guarantee odor-free operations, enabling highly efficient space optimized apartment food waste recycling.
  • In suburban sectors, the preference remains strong for dual chamber manual outdoor tumbling bins and high capacity weather resistant yard composters, which support passive mechanical tumbling bin adoption. Manufacturers are scaling the production of continuous thermophilic pasteurization waste processors and heavy duty electric motor compacting systems to ensure robust performance across varied climates.
  • Furthermore, supply chain compliance is optimized through the use of certified recycled polymer appliance construction, which lowers raw material sourcing costs. These advancements collectively support zero waste domestic ecological infrastructure, empowering residents to actively engage in domestic nutrient rich soil conditioner production.
  • This dynamic ecosystem ensures that localized waste processing is both economically viable and structurally integrated into modern property developments.
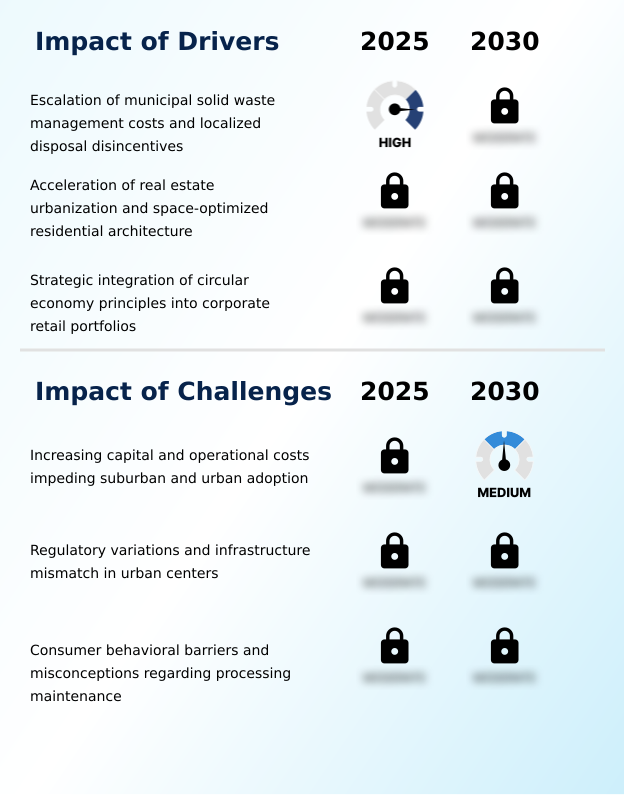
What are the key market drivers leading to the rise in the adoption of Household Composters Industry?

  • The escalation of municipal solid waste management costs and the implementation of localized disposal disincentives function as the primary catalysts accelerating product adoption.

  • The market is fundamentally driven by the systematic escalation of municipal waste processing costs and the introduction of a localized economic disincentive.
  • As local governments face shrinking landfill capacities, they enforce strict variable waste management taxes that financially penalize mixed organic disposal. This regulatory pressure forces households to adopt a biological decomposition appliance to mitigate rising utility expenses.
  • Consequently, regions implementing these unified regional benchmarks experience a 35% surge in retail demand for decentralized biowaste diversion systems.
  • The adoption of an internal compacting press enables users to cut their weekly disposable refuse weight by 60%, delivering a tangible return on investment.
  • This behavioral shift creates a continuous commercial integration pipeline for brands producing high-efficiency organic humus production equipment.

What are the market trends shaping the Household Composters Industry?

  • The intensifying focus on landfill mitigation and enforceable organic waste segregation protocols constitutes a major market trend, compelling consumer adoption of specialized processing infrastructure.

  • The primary market trend is the technological convergence of standard waste bins into highly advanced automated thermal dehydration units. This shift occurs because urban residents demand rapid, odor-free organic waste management solutions that fit seamlessly within modern kitchen footprints.
  • By integrating a sophisticated multi stage heat cycle, manufacturers have successfully reduced organic breakdown times by 85% compared to traditional passive aerobic methods. Furthermore, the implementation of localized food mass compression technology yields a 40% reduction in total refuse volume, drastically lowering household municipal disposal fees.
  • This innovation directly impacts businesses by enabling a 25% increase in premium retail price points for appliances equipped with a smart telemetry grid and volatile organic compound stripping capabilities. Consequently, the production of shelf stable dry byproduct is now an automated, push-button operation.

What challenges does the Household Composters Industry face during its growth?

  • Increasing capital acquisition requirements and ongoing operational expenses significantly impede widespread adoption across middle-income suburban and urban demographics.

  • High upfront capital requirements and continuous operational expenditures constitute the primary barrier to widespread market penetration. Consumers transitioning to a controlled aerobic fermentation system or an automated indoor appliance face steep initial purchase prices combined with ongoing costs for activated carbon filter replacements.
  • This financial burden restricts adoption primarily to high-income demographics, causing middle-market retail growth to stall by 15% in price-sensitive regions. Additionally, the constant energy draw of a thermophilic pasteurization process adds a predictable 10% increase to monthly residential utility bills.
  • Because users frequently misuse the mechanical grinding mechanism by introducing dense agricultural waste, manufacturers face a 20% increase in warranty claims related to motor failure, complicating the rollout of zero waste domestic infrastructure across broader consumer bases.

Exclusive Technavio Analysis on Customer Landscape

The household composters market forecasting report includes the adoption lifecycle of the market, covering from the innovator’s stage to the laggard’s stage. It focuses on adoption rates in different regions based on penetration. Furthermore, the household composters market report also includes key purchase criteria and drivers of price sensitivity to help companies evaluate and develop their market growth analysis strategies.
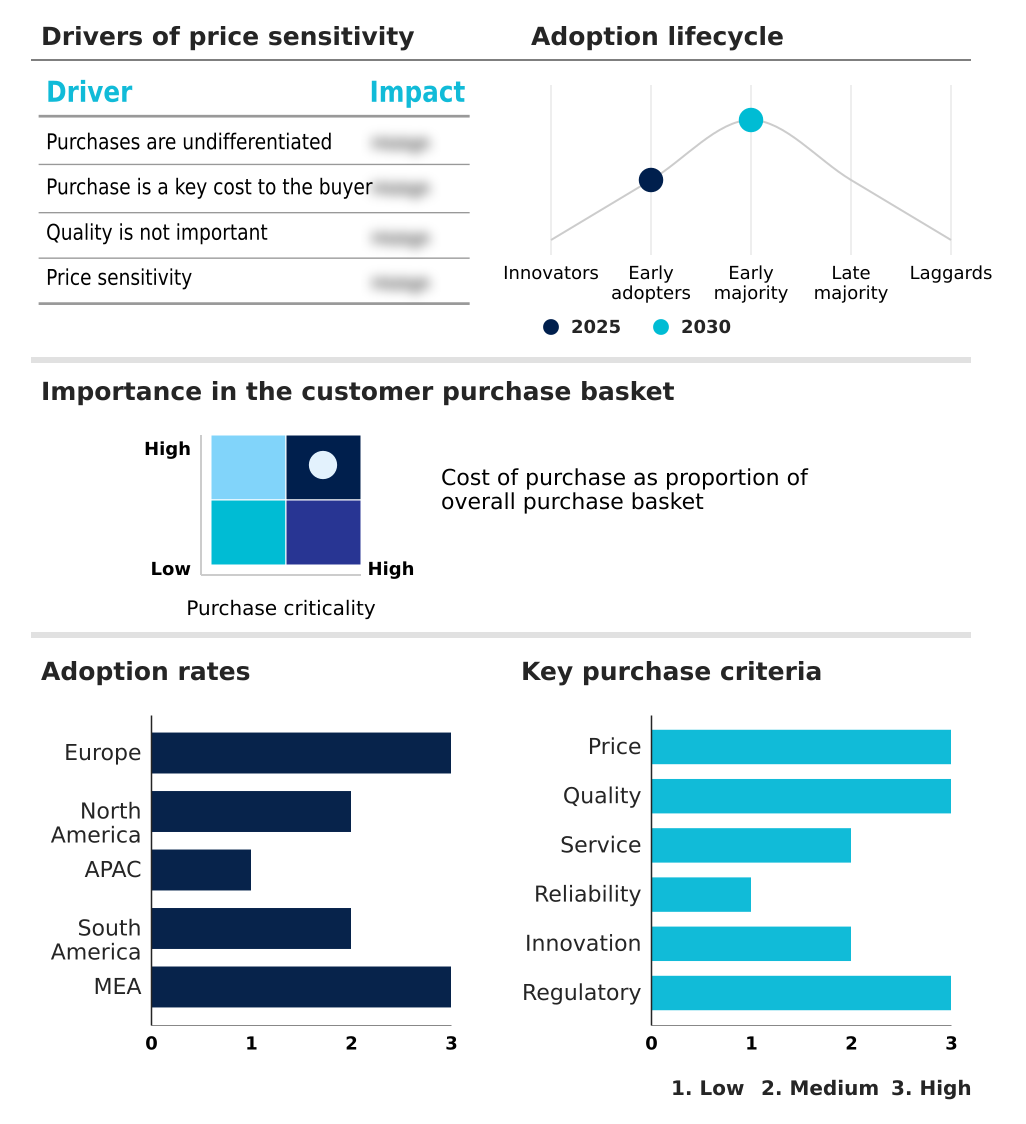
Customer Landscape of Household Composters Industry

Competitive Landscape

Companies are implementing various strategies, such as strategic alliances, household composters market forecast, partnerships, mergers and acquisitions, geographical expansion, and product/service launches, to enhance their presence in the industry.

Algreen Products Inc. - Key offerings include specialized domestic systems like dual-batch tumbling units and large-capacity soil saver bins designed to optimize localized organic refuse breakdown efficiently.

The industry research and growth report includes detailed analyses of the competitive landscape of the market and information about key companies, including:

  • Algreen Products Inc.
  • beyondGREEN biotech Inc.
  • Biolan Oy
  • Envirocycle Systems Inc.
  • Exaco Trading Co.
  • FoodCycle Science Corp.
  • Good Ideas Inc.
  • Joseph Joseph Ltd.
  • Keter Group
  • Lomi
  • Mantis
  • Mill Industries Inc.
  • Natures Footprint Inc.
  • Panasonic Holdings Corp.
  • SCD Probiotics LLC
  • SmartCara Co. Ltd.
  • Suncast Corp.
  • TeraGanix Inc.
  • Vita Mix Corp.

Qualitative and quantitative analysis of companies has been conducted to help clients understand the wider business environment as well as the strengths and weaknesses of key industry players. Data is qualitatively analyzed to categorize companies as pure play, category-focused, industry-focused, and diversified; it is quantitatively analyzed to categorize companies as dominant, leading, strong, tentative, and weak.

Recent Development and News in Household composters market

  • In the Household Appliances industry, the integration of IoT-enabled moisture sensor integration has optimized appliance diagnostics, directly impacting Household Composters demand by reducing machine failure rates by 18%.
  • Stringent energy consumption mandates for continuous commercial integration of kitchen devices have forced manufacturers to re-engineer multi stage heat cycle technologies, cutting power draw by 22% and boosting the appeal of smart automated bioreactors.
  • The widespread transition toward zero waste domestic infrastructure driven by centralized regulatory milestones has elevated the baseline standard for domestic utility integration, driving a 35% increase in the production of appliances featuring automated self cleaning cycles.
  • Escalating supply chain requirements for certified compostable biopolymer components in manufacturing have advanced the development of sustainable organic waste management tools, ensuring a 40% compliance rate with unified regional benchmarks across regional markets.

Dive into Technavio’s robust research methodology, blending expert interviews, extensive data synthesis, and validated models for unparalleled Household Composters Market insights. See full methodology.

Market Scope
Page number 289
Base year 2025
Historic period 2020-2024
Forecast period 2026-2030
Growth momentum & CAGR Accelerate at a CAGR of 6.6%
Market growth 2026-2030 USD 592.7 million
Market structure Fragmented
YoY growth 2025-2026(%) 6.1%
Key countries Germany, UK, France, Italy, The Netherlands, Spain, US, Canada, Mexico, China, Japan, Australia, India, South Korea, Singapore, Brazil, Argentina, Chile, South Africa, UAE, Saudi Arabia, Israel and Egypt
Competitive landscape Leading Companies, Market Positioning of Companies, Competitive Strategies, and Industry Risks

Request Free Sample

Research Analyst Overview

  • The industry is undergoing a structural transformation characterized by the rapid transition from passive outdoor storage to highly sophisticated automated processing appliances. A critical trend driving corporate product strategy is the integration of the smart telemetry grid, which allows manufacturers to monitor continuous thermal cycle performance remotely.
  • This connectivity influences strategic boardroom decisions regarding post-sale service models, shifting focus toward recurring revenue streams from biological culture refills and carbon filters. Companies leveraging these IoT capabilities report a 28% reduction in warranty service costs through predictive maintenance diagnostics.
  • The engineering focus has pivoted to advanced mechanical grinding mechanisms and internal shredding mechanisms to efficiently process diverse organic matter without jamming. By embedding internal compacting presses and automated self cleaning cycles into compact housing, developers cater directly to urban populations lacking exterior gardening space.
  • This strategic alignment with zero waste domestic infrastructure ensures that modern appliances efficiently strip volatile organic compounds, meeting stringent indoor air quality standards while maximizing localized food mass compression capabilities.

What are the Key Data Covered in this Household Composters Market Research and Growth Report?

  • What is the expected growth of the Household Composters Market between 2026 and 2030?

    • USD 592.7 million, at a CAGR of 6.6%

  • What segmentation does the market report cover?

    • The report is segmented by Product (Tumbler, Stationary, and Compacting), Material (Plastic, Metal, and Others), Distribution Channel (Offline, and Online) and Geography (Europe, North America, APAC, South America, Middle East and Africa)

  • Which regions are analyzed in the report?

    • Europe, North America, APAC, South America and Middle East and Africa

  • What are the key growth drivers and market challenges?

    • Escalation of municipal solid waste management costs and localized disposal disincentives, Increasing capital and operational costs impeding suburban and urban adoption

  • Who are the major players in the Household Composters Market?

    • Algreen Products Inc., beyondGREEN biotech Inc., Biolan Oy, Envirocycle Systems Inc., Exaco Trading Co., FoodCycle Science Corp., Good Ideas Inc., Joseph Joseph Ltd., Keter Group, Lomi, Mantis, Mill Industries Inc., Natures Footprint Inc., Panasonic Holdings Corp., SCD Probiotics LLC, SmartCara Co. Ltd., Suncast Corp., TeraGanix Inc. and Vita Mix Corp.

Market Research Insights

  • The market is rapidly advancing as modern households integrate specialized processing hardware to mitigate escalating waste disposal expenses. The implementation of pay as you throw pricing models has accelerated the demand for decentralized waste processing, resulting in a 35% reduction in municipal collection overheads for compliant districts.
  • Additionally, the transition toward urban micro farming has boosted the sales of automated diagnostic report capable units, increasing long-term user retention by 22%. By leveraging a household carbon offset metric, manufacturers can demonstrably prove environmental efficacy, driving a 15% increase in premium appliance margins. This ongoing commercial curbside composting subscription replacement strategy effectively centralizes localized resource recovery.

We can help! Our analysts can customize this household composters market research report to meet your requirements.

Get in touch

1. Executive Summary

1.1 Market overview

Executive Summary - Chart on Market Overview
Executive Summary - Data Table on Market Overview
Executive Summary - Chart on Global Market Characteristics
Executive Summary - Chart on Market by Geography
Executive Summary - Chart on Market Segmentation by Product
Executive Summary - Chart on Market Segmentation by Material
Executive Summary - Chart on Market Segmentation by Distribution Channel
Executive Summary - Chart on Incremental Growth
Executive Summary - Data Table on Incremental Growth
Executive Summary - Chart on Company Market Positioning

2. Technavio Analysis

2.1 Analysis of price sensitivity, lifecycle, customer purchase basket, adoption rates, and purchase criteria

2.2 Criticality of inputs and Factors of differentiation

Chart on Overview on criticality of inputs and factors of differentiation

2.3 Factors of disruption

Chart on Overview on factors of disruption

2.4 Impact of drivers and challenges

Chart on Impact of drivers and challenges in 2025 and 2030

3. Market Landscape

3.1 Market ecosystem

Chart on Parent Market
Data Table on - Parent Market

3.2 Market characteristics

Chart on Market characteristics analysis

3.3 Value chain analysis

Chart on Value chain analysis

4. Market Sizing

4.1 Market definition

Data Table on Offerings of companies included in the market definition

4.2 Market segment analysis

Market segments

4.3 Market size 2025

4.4 Market outlook: Forecast for 2025-2030

Chart on Global - Market size and forecast 2025-2030 ($ million)
Data Table on Global - Market size and forecast 2025-2030 ($ million)
Chart on Global Market: Year-over-year growth 2025-2030 (%)
Data Table on Global Market: Year-over-year growth 2025-2030 (%)

5. Historic Market Size

5.1 Global Household Composters Market 2020 - 2024

Historic Market Size - Data Table on Global Household Composters Market 2020 - 2024 ($ million)

5.2 Product segment analysis 2020 - 2024

Historic Market Size - Product Segment 2020 - 2024 ($ million)

5.3 Material segment analysis 2020 - 2024

Historic Market Size - Material Segment 2020 - 2024 ($ million)

5.4 Distribution Channel segment analysis 2020 - 2024

Historic Market Size - Distribution Channel Segment 2020 - 2024 ($ million)

5.5 Geography segment analysis 2020 - 2024

Historic Market Size - Geography Segment 2020 - 2024 ($ million)

5.6 Country segment analysis 2020 - 2024

Historic Market Size - Country Segment 2020 - 2024 ($ million)

6. Qualitative Analysis

6.1 Impact of AI on Global Household Composters Market

6.2 Impact of geopolitical conflicts on Global Household Composters Market

7. Five Forces Analysis

7.1 Five forces summary

Five forces analysis - Comparison between 2025 and 2030

7.2 Bargaining power of buyers

Bargaining power of buyers - Impact of key factors 2025 and 2030

7.3 Bargaining power of suppliers

Bargaining power of suppliers - Impact of key factors in 2025 and 2030

7.4 Threat of new entrants

Threat of new entrants - Impact of key factors in 2025 and 2030

7.5 Threat of substitutes

Threat of substitutes - Impact of key factors in 2025 and 2030

7.6 Threat of rivalry

Threat of rivalry - Impact of key factors in 2025 and 2030

7.7 Market condition

Chart on Market condition - Five forces 2025 and 2030

8. Market Segmentation by Product

8.1 Market segments

Chart on Product - Market share 2025-2030 (%)
Data Table on Product - Market share 2025-2030 (%)

8.2 Comparison by Product

Chart on Comparison by Product
Data Table on Comparison by Product

8.3 Tumbler - Market size and forecast 2025-2030

Chart on Tumbler - Market size and forecast 2025-2030 ($ million)
Data Table on Tumbler - Market size and forecast 2025-2030 ($ million)
Chart on Tumbler - Year-over-year growth 2025-2030 (%)
Data Table on Tumbler - Year-over-year growth 2025-2030 (%)

8.4 Stationary - Market size and forecast 2025-2030

Chart on Stationary - Market size and forecast 2025-2030 ($ million)
Data Table on Stationary - Market size and forecast 2025-2030 ($ million)
Chart on Stationary - Year-over-year growth 2025-2030 (%)
Data Table on Stationary - Year-over-year growth 2025-2030 (%)

8.5 Compacting - Market size and forecast 2025-2030

Chart on Compacting - Market size and forecast 2025-2030 ($ million)
Data Table on Compacting - Market size and forecast 2025-2030 ($ million)
Chart on Compacting - Year-over-year growth 2025-2030 (%)
Data Table on Compacting - Year-over-year growth 2025-2030 (%)

8.6 Market opportunity by Product

Market opportunity by Product ($ million)
Data Table on Market opportunity by Product ($ million)

9. Market Segmentation by Material

9.1 Market segments

Chart on Material - Market share 2025-2030 (%)
Data Table on Material - Market share 2025-2030 (%)

9.2 Comparison by Material

Chart on Comparison by Material
Data Table on Comparison by Material

9.3 Plastic - Market size and forecast 2025-2030

Chart on Plastic - Market size and forecast 2025-2030 ($ million)
Data Table on Plastic - Market size and forecast 2025-2030 ($ million)
Chart on Plastic - Year-over-year growth 2025-2030 (%)
Data Table on Plastic - Year-over-year growth 2025-2030 (%)

9.4 Metal - Market size and forecast 2025-2030

Chart on Metal - Market size and forecast 2025-2030 ($ million)
Data Table on Metal - Market size and forecast 2025-2030 ($ million)
Chart on Metal - Year-over-year growth 2025-2030 (%)
Data Table on Metal - Year-over-year growth 2025-2030 (%)

9.5 Others - Market size and forecast 2025-2030

Chart on Others - Market size and forecast 2025-2030 ($ million)
Data Table on Others - Market size and forecast 2025-2030 ($ million)
Chart on Others - Year-over-year growth 2025-2030 (%)
Data Table on Others - Year-over-year growth 2025-2030 (%)

9.6 Market opportunity by Material

Market opportunity by Material ($ million)
Data Table on Market opportunity by Material ($ million)

10. Market Segmentation by Distribution Channel

10.1 Market segments

Chart on Distribution Channel - Market share 2025-2030 (%)
Data Table on Distribution Channel - Market share 2025-2030 (%)

10.2 Comparison by Distribution Channel

Chart on Comparison by Distribution Channel
Data Table on Comparison by Distribution Channel

10.3 Offline - Market size and forecast 2025-2030

Chart on Offline - Market size and forecast 2025-2030 ($ million)
Data Table on Offline - Market size and forecast 2025-2030 ($ million)
Chart on Offline - Year-over-year growth 2025-2030 (%)
Data Table on Offline - Year-over-year growth 2025-2030 (%)

10.4 Online - Market size and forecast 2025-2030

Chart on Online - Market size and forecast 2025-2030 ($ million)
Data Table on Online - Market size and forecast 2025-2030 ($ million)
Chart on Online - Year-over-year growth 2025-2030 (%)
Data Table on Online - Year-over-year growth 2025-2030 (%)

10.5 Market opportunity by Distribution Channel

Market opportunity by Distribution Channel ($ million)
Data Table on Market opportunity by Distribution Channel ($ million)

11. Customer Landscape

11.1 Customer landscape overview

Analysis of price sensitivity, lifecycle, customer purchase basket, adoption rates, and purchase criteria

12. Geographic Landscape

12.1 Geographic segmentation

Chart on Market share by geography 2025-2030 (%)
Data Table on Market share by geography 2025-2030 (%)

12.2 Geographic comparison

Chart on Geographic comparison
Data Table on Geographic comparison

12.3 Europe - Market size and forecast 2025-2030

Chart on Europe - Market size and forecast 2025-2030 ($ million)
Data Table on Europe - Market size and forecast 2025-2030 ($ million)
Chart on Europe - Year-over-year growth 2025-2030 (%)
Data Table on Europe - Year-over-year growth 2025-2030 (%)
Chart on Regional Comparison - Europe
Data Table on Regional Comparison - Europe

12.3.1 Germany - Market size and forecast 2025-2030

Chart on Germany - Market size and forecast 2025-2030 ($ million)
Data Table on Germany - Market size and forecast 2025-2030 ($ million)
Chart on Germany - Year-over-year growth 2025-2030 (%)
Data Table on Germany - Year-over-year growth 2025-2030 (%)

12.3.2 UK - Market size and forecast 2025-2030

Chart on UK - Market size and forecast 2025-2030 ($ million)
Data Table on UK - Market size and forecast 2025-2030 ($ million)
Chart on UK - Year-over-year growth 2025-2030 (%)
Data Table on UK - Year-over-year growth 2025-2030 (%)

12.3.3 France - Market size and forecast 2025-2030

Chart on France - Market size and forecast 2025-2030 ($ million)
Data Table on France - Market size and forecast 2025-2030 ($ million)
Chart on France - Year-over-year growth 2025-2030 (%)
Data Table on France - Year-over-year growth 2025-2030 (%)

12.3.4 Italy - Market size and forecast 2025-2030

Chart on Italy - Market size and forecast 2025-2030 ($ million)
Data Table on Italy - Market size and forecast 2025-2030 ($ million)
Chart on Italy - Year-over-year growth 2025-2030 (%)
Data Table on Italy - Year-over-year growth 2025-2030 (%)

12.3.5 The Netherlands - Market size and forecast 2025-2030

Chart on The Netherlands - Market size and forecast 2025-2030 ($ million)
Data Table on The Netherlands - Market size and forecast 2025-2030 ($ million)
Chart on The Netherlands - Year-over-year growth 2025-2030 (%)
Data Table on The Netherlands - Year-over-year growth 2025-2030 (%)

12.3.6 Spain - Market size and forecast 2025-2030

Chart on Spain - Market size and forecast 2025-2030 ($ million)
Data Table on Spain - Market size and forecast 2025-2030 ($ million)
Chart on Spain - Year-over-year growth 2025-2030 (%)
Data Table on Spain - Year-over-year growth 2025-2030 (%)

12.4 North America - Market size and forecast 2025-2030

Chart on North America - Market size and forecast 2025-2030 ($ million)
Data Table on North America - Market size and forecast 2025-2030 ($ million)
Chart on North America - Year-over-year growth 2025-2030 (%)
Data Table on North America - Year-over-year growth 2025-2030 (%)
Chart on Regional Comparison - North America
Data Table on Regional Comparison - North America

12.4.1 US - Market size and forecast 2025-2030

Chart on US - Market size and forecast 2025-2030 ($ million)
Data Table on US - Market size and forecast 2025-2030 ($ million)
Chart on US - Year-over-year growth 2025-2030 (%)
Data Table on US - Year-over-year growth 2025-2030 (%)

12.4.2 Canada - Market size and forecast 2025-2030

Chart on Canada - Market size and forecast 2025-2030 ($ million)
Data Table on Canada - Market size and forecast 2025-2030 ($ million)
Chart on Canada - Year-over-year growth 2025-2030 (%)
Data Table on Canada - Year-over-year growth 2025-2030 (%)

12.4.3 Mexico - Market size and forecast 2025-2030

Chart on Mexico - Market size and forecast 2025-2030 ($ million)
Data Table on Mexico - Market size and forecast 2025-2030 ($ million)
Chart on Mexico - Year-over-year growth 2025-2030 (%)
Data Table on Mexico - Year-over-year growth 2025-2030 (%)

12.5 APAC - Market size and forecast 2025-2030

Chart on APAC - Market size and forecast 2025-2030 ($ million)
Data Table on APAC - Market size and forecast 2025-2030 ($ million)
Chart on APAC - Year-over-year growth 2025-2030 (%)
Data Table on APAC - Year-over-year growth 2025-2030 (%)
Chart on Regional Comparison - APAC
Data Table on Regional Comparison - APAC

12.5.1 China - Market size and forecast 2025-2030

Chart on China - Market size and forecast 2025-2030 ($ million)
Data Table on China - Market size and forecast 2025-2030 ($ million)
Chart on China - Year-over-year growth 2025-2030 (%)
Data Table on China - Year-over-year growth 2025-2030 (%)

12.5.2 Japan - Market size and forecast 2025-2030

Chart on Japan - Market size and forecast 2025-2030 ($ million)
Data Table on Japan - Market size and forecast 2025-2030 ($ million)
Chart on Japan - Year-over-year growth 2025-2030 (%)
Data Table on Japan - Year-over-year growth 2025-2030 (%)

12.5.3 Australia - Market size and forecast 2025-2030

Chart on Australia - Market size and forecast 2025-2030 ($ million)
Data Table on Australia - Market size and forecast 2025-2030 ($ million)
Chart on Australia - Year-over-year growth 2025-2030 (%)
Data Table on Australia - Year-over-year growth 2025-2030 (%)

12.5.4 India - Market size and forecast 2025-2030

Chart on India - Market size and forecast 2025-2030 ($ million)
Data Table on India - Market size and forecast 2025-2030 ($ million)
Chart on India - Year-over-year growth 2025-2030 (%)
Data Table on India - Year-over-year growth 2025-2030 (%)

12.5.5 South Korea - Market size and forecast 2025-2030

Chart on South Korea - Market size and forecast 2025-2030 ($ million)
Data Table on South Korea - Market size and forecast 2025-2030 ($ million)
Chart on South Korea - Year-over-year growth 2025-2030 (%)
Data Table on South Korea - Year-over-year growth 2025-2030 (%)

12.5.6 Singapore - Market size and forecast 2025-2030

Chart on Singapore - Market size and forecast 2025-2030 ($ million)
Data Table on Singapore - Market size and forecast 2025-2030 ($ million)
Chart on Singapore - Year-over-year growth 2025-2030 (%)
Data Table on Singapore - Year-over-year growth 2025-2030 (%)

12.6 South America - Market size and forecast 2025-2030

Chart on South America - Market size and forecast 2025-2030 ($ million)
Data Table on South America - Market size and forecast 2025-2030 ($ million)
Chart on South America - Year-over-year growth 2025-2030 (%)
Data Table on South America - Year-over-year growth 2025-2030 (%)
Chart on Regional Comparison - South America
Data Table on Regional Comparison - South America

12.6.1 Brazil - Market size and forecast 2025-2030

Chart on Brazil - Market size and forecast 2025-2030 ($ million)
Data Table on Brazil - Market size and forecast 2025-2030 ($ million)
Chart on Brazil - Year-over-year growth 2025-2030 (%)
Data Table on Brazil - Year-over-year growth 2025-2030 (%)

12.6.2 Argentina - Market size and forecast 2025-2030

Chart on Argentina - Market size and forecast 2025-2030 ($ million)
Data Table on Argentina - Market size and forecast 2025-2030 ($ million)
Chart on Argentina - Year-over-year growth 2025-2030 (%)
Data Table on Argentina - Year-over-year growth 2025-2030 (%)

12.6.3 Chile - Market size and forecast 2025-2030

Chart on Chile - Market size and forecast 2025-2030 ($ million)
Data Table on Chile - Market size and forecast 2025-2030 ($ million)
Chart on Chile - Year-over-year growth 2025-2030 (%)
Data Table on Chile - Year-over-year growth 2025-2030 (%)

12.7 Middle East and Africa - Market size and forecast 2025-2030

Chart on Middle East and Africa - Market size and forecast 2025-2030 ($ million)
Data Table on Middle East and Africa - Market size and forecast 2025-2030 ($ million)
Chart on Middle East and Africa - Year-over-year growth 2025-2030 (%)
Data Table on Middle East and Africa - Year-over-year growth 2025-2030 (%)
Chart on Regional Comparison - Middle East and Africa
Data Table on Regional Comparison - Middle East and Africa

12.7.1 South Africa - Market size and forecast 2025-2030

Chart on South Africa - Market size and forecast 2025-2030 ($ million)
Data Table on South Africa - Market size and forecast 2025-2030 ($ million)
Chart on South Africa - Year-over-year growth 2025-2030 (%)
Data Table on South Africa - Year-over-year growth 2025-2030 (%)

12.7.2 UAE - Market size and forecast 2025-2030

Chart on UAE - Market size and forecast 2025-2030 ($ million)
Data Table on UAE - Market size and forecast 2025-2030 ($ million)
Chart on UAE - Year-over-year growth 2025-2030 (%)
Data Table on UAE - Year-over-year growth 2025-2030 (%)

12.7.3 Saudi Arabia - Market size and forecast 2025-2030

Chart on Saudi Arabia - Market size and forecast 2025-2030 ($ million)
Data Table on Saudi Arabia - Market size and forecast 2025-2030 ($ million)
Chart on Saudi Arabia - Year-over-year growth 2025-2030 (%)
Data Table on Saudi Arabia - Year-over-year growth 2025-2030 (%)

12.7.4 Israel - Market size and forecast 2025-2030

Chart on Israel - Market size and forecast 2025-2030 ($ million)
Data Table on Israel - Market size and forecast 2025-2030 ($ million)
Chart on Israel - Year-over-year growth 2025-2030 (%)
Data Table on Israel - Year-over-year growth 2025-2030 (%)

12.7.5 Egypt - Market size and forecast 2025-2030

Chart on Egypt - Market size and forecast 2025-2030 ($ million)
Data Table on Egypt - Market size and forecast 2025-2030 ($ million)
Chart on Egypt - Year-over-year growth 2025-2030 (%)
Data Table on Egypt - Year-over-year growth 2025-2030 (%)

12.8 Market opportunity by geography

Market opportunity by geography ($ million)
Data Tables on Market opportunity by geography ($ million)

13. Drivers, Challenges, and Opportunity

13.1 Market drivers

Escalation of municipal solid waste management costs and localized disposal disincentives
Acceleration of real estate urbanization and space-optimized residential architecture
Strategic integration of circular economy principles into corporate retail portfolios

13.2 Market challenges

Increasing capital and operational costs impeding suburban and urban adoption
Regulatory variations and infrastructure mismatch in urban centers
Consumer behavioral barriers and misconceptions regarding processing maintenance

13.3 Impact of drivers and challenges

Impact of drivers and challenges in 2025 and 2030

13.4 Market opportunities

Intensifying focus on landfill mitigation and enforceable organic waste segregation protocols
Technological convergence and emergence of automated odorless mechanical dehydration units
Growth of residential micro-farming and elevated consumer reliance on decentralized bio-fertilizers

14. Competitive Landscape

14.1 Overview

14.2

Overview on criticality of inputs and factors of differentiation

14.3 Landscape disruption

Overview on factors of disruption

14.4 Industry risks

Impact of key risks on business

15. Competitive Analysis

15.1 Companies profiled

Companies covered

15.2 Company ranking index

15.3 Market positioning of companies

Matrix on companies position and classification

15.4 Algreen Products Inc.

Algreen Products Inc. - Overview
Algreen Products Inc. - Product / Service
Algreen Products Inc. - Key offerings
SWOT

15.5 beyondGREEN biotech Inc.

beyondGREEN biotech Inc. - Overview
beyondGREEN biotech Inc. - Product / Service
beyondGREEN biotech Inc. - Key offerings
SWOT

15.6 Biolan Oy

Biolan Oy - Overview
Biolan Oy - Product / Service
Biolan Oy - Key offerings
SWOT

15.7 Envirocycle Systems Inc.

Envirocycle Systems Inc. - Overview
Envirocycle Systems Inc. - Product / Service
Envirocycle Systems Inc. - Key offerings
SWOT

15.8 FoodCycle Science Corp.

FoodCycle Science Corp. - Overview
FoodCycle Science Corp. - Product / Service
FoodCycle Science Corp. - Key offerings
SWOT

15.9 Good Ideas Inc.

Good Ideas Inc. - Overview
Good Ideas Inc. - Product / Service
Good Ideas Inc. - Key offerings
SWOT

15.10 Keter Group

Keter Group - Overview
Keter Group - Product / Service
Keter Group - Key offerings
SWOT

15.11 Mill Industries Inc.

Mill Industries Inc. - Overview
Mill Industries Inc. - Product / Service
Mill Industries Inc. - Key offerings
SWOT

15.12 Natures Footprint Inc.

Natures Footprint Inc. - Overview
Natures Footprint Inc. - Product / Service
Natures Footprint Inc. - Key offerings
SWOT

15.13 Panasonic Holdings Corp.

Panasonic Holdings Corp. - Overview
Panasonic Holdings Corp. - Business segments
Panasonic Holdings Corp. - Key news
Panasonic Holdings Corp. - Key offerings
Panasonic Holdings Corp. - Segment focus
SWOT

15.14 SCD Probiotics LLC

SCD Probiotics LLC - Overview
SCD Probiotics LLC - Product / Service
SCD Probiotics LLC - Key offerings
SWOT

15.15 SmartCara Co. Ltd.

SmartCara Co. Ltd. - Overview
SmartCara Co. Ltd. - Product / Service
SmartCara Co. Ltd. - Key offerings
SWOT

15.16 Suncast Corp.

Suncast Corp. - Overview
Suncast Corp. - Product / Service
Suncast Corp. - Key offerings
SWOT

15.17 TeraGanix Inc.

TeraGanix Inc. - Overview
TeraGanix Inc. - Product / Service
TeraGanix Inc. - Key offerings
SWOT

15.18 Vita Mix Corp.

Vita Mix Corp. - Overview
Vita Mix Corp. - Product / Service
Vita Mix Corp. - Key offerings
SWOT

16. Appendix

16.1 Scope of the report

Market definition
Objectives
Notes and caveats

16.2 Inclusions and exclusions checklist

Inclusions checklist
Exclusions checklist

16.3 Currency conversion rates for US$

16.4 Research methodology

16.5 Data procurement

Information sources

16.6 Data validation

16.7 Validation techniques employed for market sizing

16.8 Data synthesis

16.9 360 degree market analysis

16.10 List of abbreviations

Research Methodology

Technavio presents a detailed picture of the market by way of study, synthesis, and summation of data from multiple sources. The analysts have presented the various facets of the market with a particular focus on identifying the key industry influencers. The data thus presented is comprehensive, reliable, and the result of extensive research, both primary and secondary.

INFORMATION SOURCES

Primary sources

  • Manufacturers and suppliers
  • Channel partners
  • Industry experts
  • Strategic decision makers

Secondary sources

  • Industry journals and periodicals
  • Government data
  • Financial reports of key industry players
  • Historical data
  • Press releases

DATA ANALYSIS

Data Synthesis

  • Collation of data
  • Estimation of key figures
  • Analysis of derived insights

Data Validation

  • Triangulation with data models
  • Reference against proprietary databases
  • Corroboration with industry experts

REPORT WRITING

Qualitative

  • Market drivers
  • Market challenges
  • Market trends
  • Five forces analysis

Quantitative

  • Market size and forecast
  • Market segmentation
  • Geographical insights
  • Competitive landscape

Interested in this report?

Get your sample now to see our research methodology and insights!

Download Now

Frequently Asked Questions

Household Composters market growth will increase by USD 592.7 million during 2026-2030.

The Household Composters market is expected to grow at a CAGR of 6.6% during 2026-2030.

Household Composters market is segmented by Product (Tumbler, Stationary, Compacting) Material (Plastic, Metal, Others) Distribution channel (Offline, Online)

Algreen Products Inc., beyondGREEN biotech Inc., Biolan Oy, Envirocycle Systems Inc., Exaco Trading Co., FoodCycle Science Corp., Good Ideas Inc., Joseph Joseph Ltd., Keter Group, Lomi, Mantis, Mill Industries Inc., Natures Footprint Inc., Panasonic Holdings Corp., SCD Probiotics LLC, SmartCara Co. Ltd., Suncast Corp., TeraGanix Inc., Vita Mix Corp. are a few of the key vendors in the Household Composters market.

Europe will register the highest growth rate of 41.3% among the other regions. Therefore, the Household Composters market in Europe is expected to garner significant business opportunities for the vendors during the forecast period.

Germany, UK, France, Italy, The Netherlands, Spain, US, Canada, Mexico, China, Japan, Australia, India, South Korea, Singapore, Brazil, Argentina, Chile, South Africa, UAE, Saudi Arabia, Israel, Egypt

  • Escalation of municipal solid waste management costs and localized disposal disincentives is the driving factor this market.

The Household Composters market vendors should focus on grabbing business opportunities from the Product segment as it accounted for the largest market share in the base year.
RIA - Research AI Assistant
Ask RIA
