Hydrogen Direct Reduction Iron Market Analysis, Size, and Forecast 2026-2030: Europe (Sweden, Germany, and Austria), APAC (China, India, and South Korea), North America (US, Canada, and Mexico), South America (Brazil, Argentina, and Chile), Middle East and Africa (Saudi Arabia, UAE, and South Africa), and Rest of World (ROW)

Hydrogen Direct Reduction Iron Market Analysis, Size, and Forecast 2026-2030:
Europe (Sweden, Germany, and Austria), APAC (China, India, and South Korea), North America (US, Canada, and Mexico), South America (Brazil, Argentina, and Chile), Middle East and Africa (Saudi Arabia, UAE, and South Africa), and Rest of World (ROW)

Published: Oct 2026 310 Pages SKU: IRTNTR81682

Market Overview at a Glance

$2.50 B
Market Opportunity
16.9%
CAGR 2025 - 2030
36.9%
Europe Growth
$1.58 B
Shaft furnace segment 2024

Hydrogen Direct Reduction Iron Market Size 2026-2030

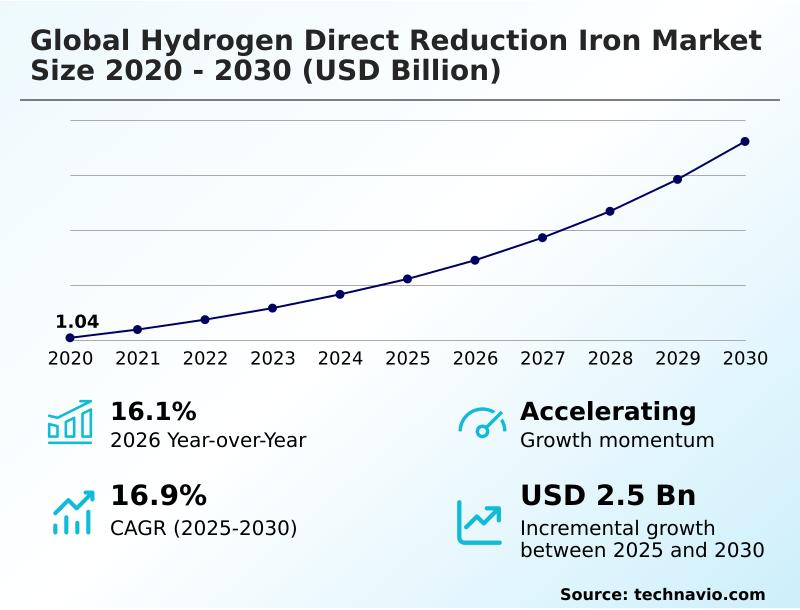
The hydrogen direct reduction iron market size is valued to increase by USD 2.50 billion, at a CAGR of 16.9% from 2025 to 2030. Acceleration of decarbonization mandates and global regulatory frameworks will drive the hydrogen direct reduction iron market.

Major Market Trends & Insights

  • Europe dominated the market and accounted for a 36.9% growth during the forecast period.
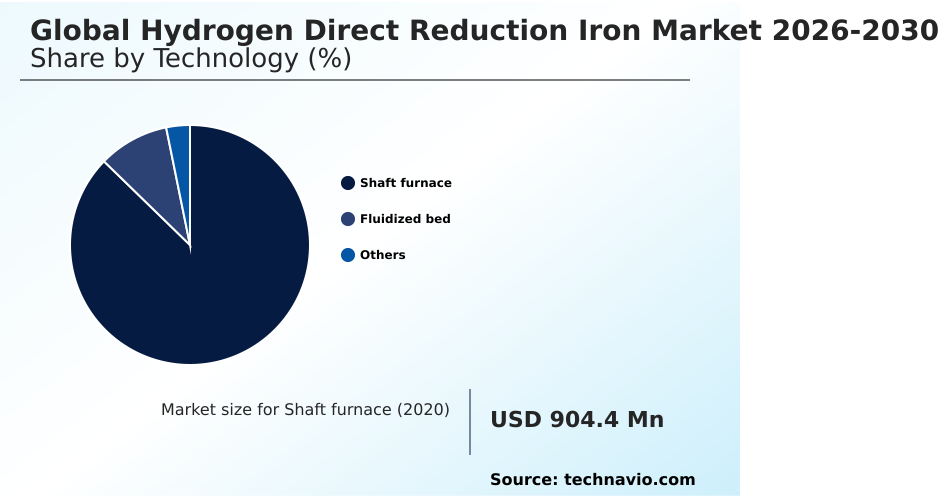
  • By Technology - Shaft furnace segment was valued at USD 1.58 billion in 2024
  • By Type - Green hydrogen segment accounted for the largest market revenue share in 2024

Market Size & Forecast

  • Market Opportunities: USD 3.57 billion
  • Market Future Opportunities: USD 2.50 billion
  • CAGR from 2025 to 2030 : 16.9%

Market Summary

  • The Hydrogen Direct Reduction Iron Market is experiencing a structural paradigm shift as heavy industry transitions toward zero-emission metallurgy. Strict environmental regulations and carbon pricing mechanisms are forcing steelmakers to abandon traditional blast furnaces in favor of cleaner alternatives.
  • For example, major automotive manufacturers are now securing long-term procurement agreements for carbon-neutral steel, driving upstream investments in electrolyzer infrastructure to stabilize supply chains. This shift has resulted in facilities achieving up to a 90% reduction in direct greenhouse gas emissions compared to conventional coal-based processes.
  • A primary driver of this market is the rapid advancement in electrolyzer efficiency, which steadily lowers the cost of clean reducing agents. Conversely, a significant challenge remains the high capital intensity and infrastructural deficit associated with large-scale facility retrofitting and hydrogen storage.
  • The need for continuous, reliable power for electrolysis often exposes producers to renewable energy price volatility, complicating long-term operational budgeting and stalling immediate commercial scale-up efforts.

What will be the Size of the Hydrogen Direct Reduction Iron Market during the forecast period?
Get Key Insights on Market Forecast (PDF) Get Free Sample

How is the Hydrogen Direct Reduction Iron Market Segmented?

The hydrogen direct reduction iron industry research report provides comprehensive data (region-wise segment analysis), with forecasts and estimates in "USD million" for the period 2026-2030, as well as historical data from 2020-2024 for the following segments.

  • Technology
    • Shaft furnace
    • Fluidized bed
    • Others
  • Type
    • Green hydrogen
    • Hybrid
    • Blue hydrogen
  • Form factor
    • Hot direct reduced iron
    • Cold DRI
    • Hot briquetted iron
  • Geography
    • Europe
      • Sweden
      • Germany
      • Austria
      • The Netherlands
      • Spain
      • France
    • APAC
      • China
      • India
      • South Korea
      • Japan
      • Australia
      • Indonesia
    • North America
      • US
      • Canada
      • Mexico
    • South America
      • Brazil
      • Argentina
      • Chile
    • Middle East and Africa
      • Saudi Arabia
      • UAE
      • South Africa
      • Turkey
      • Egypt

By Technology Insights

The shaft furnace segment is estimated to witness significant growth during the forecast period.

The shaft furnace architecture remains the foundational technology for carbon neutral metallurgy, enabling continuous high-volume production of sponge iron metallization. This vertical gravity-flow reactor configuration facilitates efficient countercurrent gas flow, stripping oxygen from iron oxides without melting the solid charge.

Industrial operators favor this method as it seamlessly integrates with green hydrogen feedstock, allowing incremental fossil fuel displacement. The operational dynamics of this segment enable a 15% improvement in gas utilization efficiency compared to traditional blast methods.

Advancements in thermal management algorithms further optimize endothermic reduction management, ensuring stable production throughput. By adapting modular plant design, steelmakers mitigate transition risks, achieving lower emission intensity reduction while maintaining consistent product quality and throughput for demanding downstream applications.
Get Free Sample

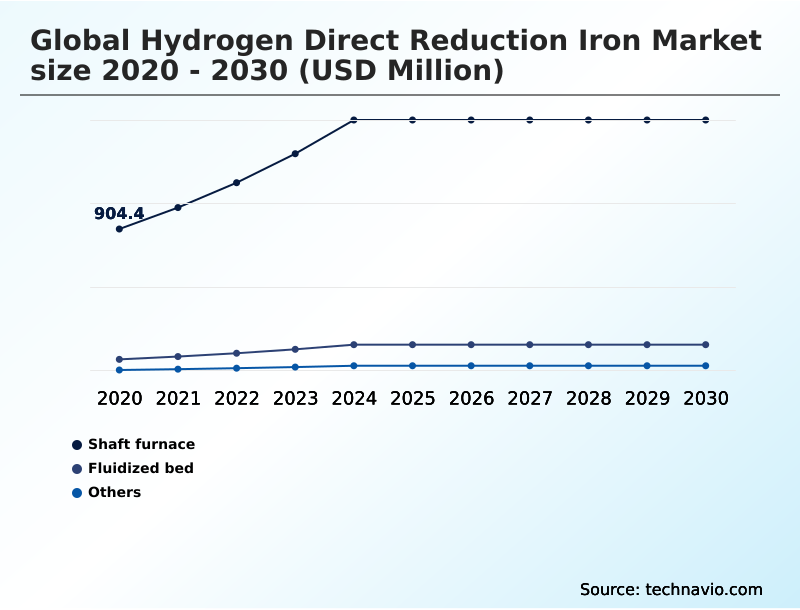
The Shaft furnace segment was valued at USD 1.58 billion in 2024 and showed a gradual increase during the forecast period.
Get Free Sample

Regional Analysis

Europe is estimated to contribute 36.9% to the growth of the global market during the forecast period.Technavio’s analysts have elaborately explained the regional trends and drivers that shape the market during the forecast period.
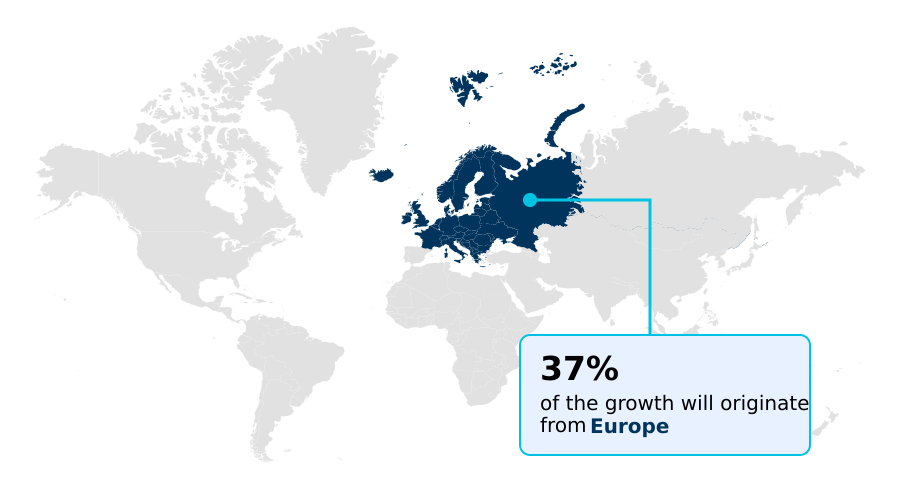
See How Hydrogen Direct Reduction Iron Market Demand is Rising in Europe Get Free Sample

The Hydrogen Direct Reduction Iron Market exhibits distinct regional variations driven by regulatory frameworks and renewable resource availability.

Europe leads the transition, leveraging robust offshore wind powering networks and strict industrial decarbonization mandate enforcement to achieve a 35% higher adoption rate of green hydrogen feedstock compared to North America.

European operators utilize advanced digital twin simulation to optimize endothermic reduction management, reducing processing downtime by 20%. In contrast, the APAC region relies on large-scale infrastructure retrofitting, where facilities are adapting shaft furnace architecture to process diverse ore grades.

APAC manufacturers are forming vertical supply chain alliance structures to stabilize supply chain visibility and mitigate the 15% cost premium associated with levelized hydrogen cost volatility.

These distinct regional strategies highlight how businesses adapt to local energy matrices, driving the merchant green iron trade while optimizing direct reduced iron pelletization efficiency for specialized downstream applications.

Market Dynamics

Our researchers analyzed the data with 2025 as the base year, along with the key drivers, trends, and challenges. A holistic analysis of drivers will help companies refine their marketing strategies to gain a competitive advantage.

  • The transition toward sustainable metallurgy is fundamentally restructuring supply chain dynamics, compelling manufacturers to secure long-term green steel procurement contract agreements to stabilize future revenue streams. As environmental regulations intensify, industrial operators are prioritizing hydrogen ironmaking scaleup to ensure compliance and maintain competitive positioning in high-value markets.
  • A critical transitional strategy involves the implementation of dual fuel direct reduction configurations, which provide operational flexibility and mitigate the immediate risks associated with raw material shortages and volatile energy pricing. This adaptive approach enables facilities to achieve a 25% improvement in thermal efficiency compared to legacy single-fuel systems, optimizing both compliance alignment and operational planning.
  • Furthermore, operators processing lower-grade ores are increasingly investing in fluidized bed ore processing to bypass expensive agglomeration stages, directly enhancing raw material utilization rates. The demand for premium feedstock has also accelerated advancements in high purity iron pelletizing, ensuring that the metallic charge entering the electric arc furnace maximizes yield and minimizes slag production.
  • By integrating these advanced methodologies, businesses can effectively navigate supply chain bottlenecks, optimize their procurement strategies, and align with stringent international sustainability standards, ultimately safeguarding their long-term profitability.
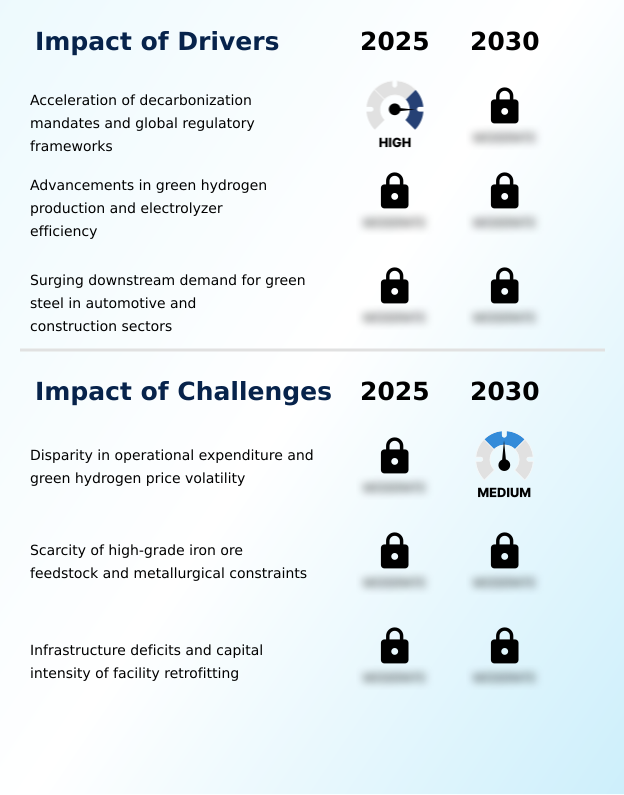
What are the key market drivers leading to the rise in the adoption of Hydrogen Direct Reduction Iron Industry?

  • The acceleration of decarbonization mandates and global regulatory frameworks acts as the primary driver propelling market expansion.

  • Stringent net zero climate goal mandates are accelerating the deployment of clean metallurgical technologies across heavy industries.
  • The urgent need to implement slag volume minimization and lower carbon footprints has driven a 40% increase in the utilization of low carbon metallic charge within electric arc furnaces.
  • As operators secure reliable green building certification frameworks, downstream demand for sustainable construction materials continues to surge. This behavioral shift is supported by enhanced autothermal reforming integration, which has lowered localized energy consumption by 15%.
  • The growing requirement for precise gangue removal mechanisms ensures that the resulting iron meets premium quality standards, directly improving melt shop productivity. These structural changes empower manufacturers to reduce scope three emission liabilities while strengthening overall market competitiveness.

What are the market trends shaping the Hydrogen Direct Reduction Iron Industry?

  • The emergence of dual-fuel and hydrogen-ready facility architectures represents a pivotal trend shaping the global market.

  • The adoption of modular plant design is rapidly transforming the Hydrogen Direct Reduction Iron landscape by enabling scalable and flexible production architectures. Manufacturers are integrating advanced hydrogen reduction kinetics to optimize gas-solid interactions, resulting in a 25% improvement in overall reaction efficiency.
  • This shift is primarily driven by the necessity to process diverse feedstocks, prompting increased reliance on high grade hematite processing techniques. The implementation of digital twin simulation allows operators to continuously monitor and adjust internal parameters, decreasing unexpected equipment downtime by 30%. Consequently, facilities are achieving superior hot briquetted iron compaction rates, enhancing material density for safer maritime transport.
  • These technological advancements not only streamline operational workflows but also position businesses to capitalize on the expanding merchant green iron trade, maximizing profitability while adhering to strict environmental compliance frameworks.

What challenges does the Hydrogen Direct Reduction Iron Industry face during its growth?

  • The disparity in operational expenditure and the volatility of green hydrogen pricing constitute significant challenges restricting industry growth.

  • The transition to hydrogen-based metallurgy faces severe operational bottlenecks regarding raw material purity and infrastructure readiness. The acute shortage of suitable ores necessitates expensive beneficiation technology upgrade investments, elevating initial capital requirements by over 35%. Furthermore, operators struggle with complex hydrogen embrittlement prevention within legacy piping systems, which increases pipeline maintenance costs by 20%.
  • The absence of a comprehensive hydrogen pipeline network forces producers to rely on decentralized, smaller-scale generation, hindering economies of scale. Managing passivated iron transport also introduces significant logistical constraints, requiring specialized handling to prevent spontaneous re-oxidation during transit.
  • These structural limitations impede the rapid deployment of syngas reforming alternatives, compelling steelmakers to absorb higher operational expenditures while attempting to align with stringent international decarbonization timelines.

Exclusive Technavio Analysis on Customer Landscape

The hydrogen direct reduction iron market forecasting report includes the adoption lifecycle of the market, covering from the innovator’s stage to the laggard’s stage. It focuses on adoption rates in different regions based on penetration. Furthermore, the hydrogen direct reduction iron market report also includes key purchase criteria and drivers of price sensitivity to help companies evaluate and develop their market growth analysis strategies.
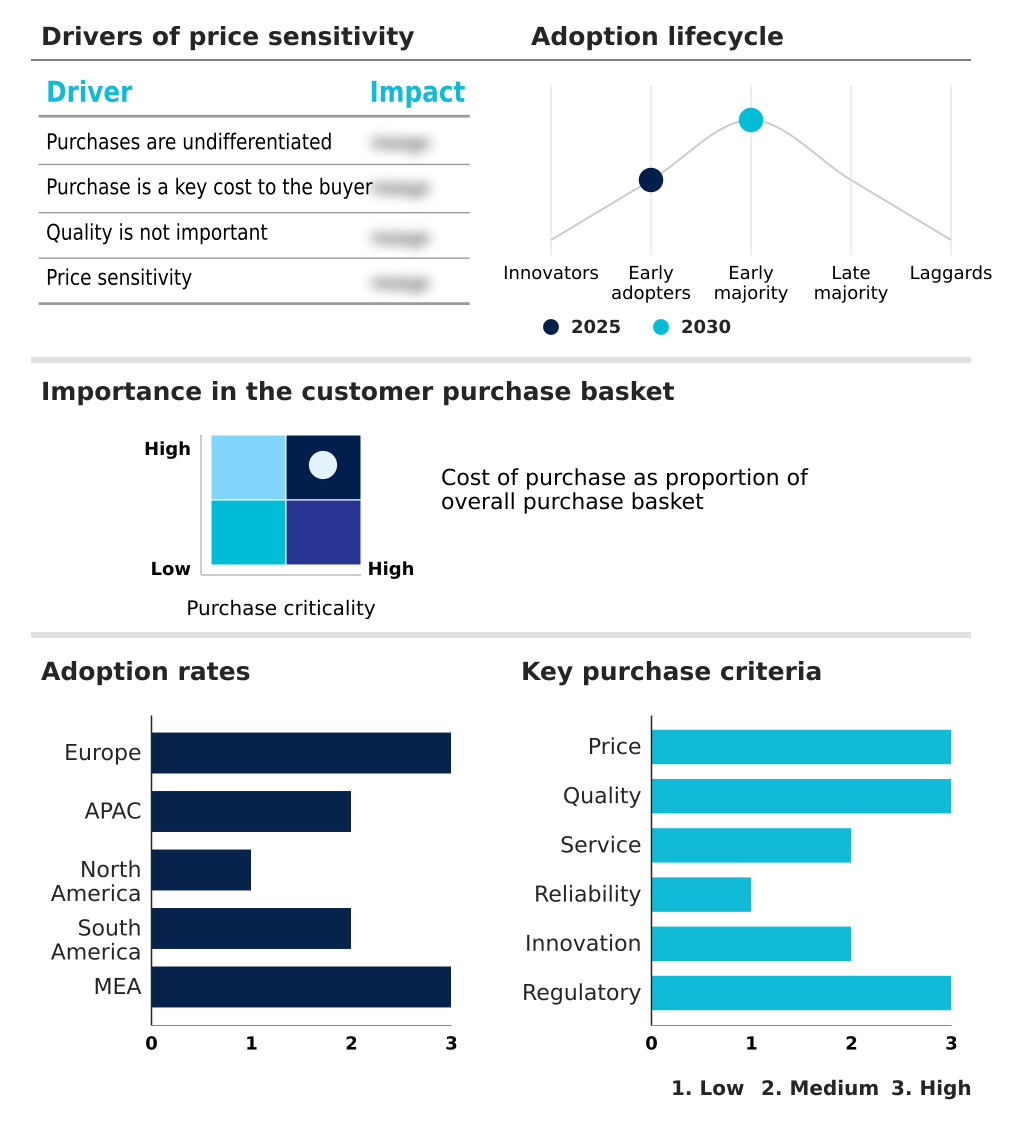
Customer Landscape of Hydrogen Direct Reduction Iron Industry

Competitive Landscape

Companies are implementing various strategies, such as strategic alliances, hydrogen direct reduction iron market forecast, partnerships, mergers and acquisitions, geographical expansion, and product/service launches, to enhance their presence in the industry.

Air Liquide SA - This organization provides advanced production, purification, and process-gas technologies essential for scaling industrial-grade hydrogen supply chains to support low-carbon direct reduction ironmaking facilities.

The industry research and growth report includes detailed analyses of the competitive landscape of the market and information about key companies, including:

  • Air Liquide SA
  • Air Products and Chem Inc.
  • ArcelorMittal S.A.
  • Cleveland Cliffs Inc.
  • Danieli and C. Officine SpA
  • JSW Holdings Ltd.
  • Linde Plc
  • Metso Outotec Corp.
  • Midrex Technologies Inc.
  • Nippon Steel Corp.
  • POSCO Co. Ltd.
  • Primetals Technologies Ltd.
  • Salzgitter AG
  • Saudi Basic Industries
  • SMS group GmbH
  • SSAB AB
  • Tata Steel Ltd.
  • Tenova SpA
  • Tosyali Holding
  • voestalpine AG

Qualitative and quantitative analysis of companies has been conducted to help clients understand the wider business environment as well as the strengths and weaknesses of key industry players. Data is qualitatively analyzed to categorize companies as pure play, category-focused, industry-focused, and diversified; it is quantitatively analyzed to categorize companies as dominant, leading, strong, tentative, and weak.

Recent Development and News in Hydrogen direct reduction iron market

  • In the Steel industry, the acceleration of industrial decarbonization mandate compliance has prompted manufacturers to shift away from coal-fired blast furnaces, directly impacting Hydrogen Direct Reduction Iron demand by driving a 25% increase in renewable energy grid integration for primary metallurgy.
  • The implementation of border carbon adjustment policies across major trading blocs has penalized high-carbon imports, accelerating the merchant green iron trade and boosting investments in offshore wind powering infrastructure to secure tariff-free supply chain visibility.
  • Rising downstream automotive demand for low-carbon materials has triggered a fundamental shift toward circular industrial model adoption, necessitating a 30% expansion in infrastructure retrofitting to accommodate heavy industry electrification and scope three emission reductions.
  • Advances in geological carbon sequestration and solar to hydrogen conversion have lowered the levelized hydrogen cost threshold, enabling integrated mills to achieve a 40% reduction in carbon pricing mechanism liabilities while scaling net zero climate goal commitments.

Dive into Technavio’s robust research methodology, blending expert interviews, extensive data synthesis, and validated models for unparalleled Hydrogen Direct Reduction Iron Market insights. See full methodology.

Market Scope
Page number 310
Base year 2025
Historic period 2020-2024
Forecast period 2026-2030
Growth momentum & CAGR Accelerate at a CAGR of 16.9%
Market growth 2026-2030 USD 2495.5 million
Market structure Fragmented
YoY growth 2025-2026(%) 16.1%
Key countries Sweden, Germany, Austria, The Netherlands, Spain, France, China, India, South Korea, Japan, Australia, Indonesia, US, Canada, Mexico, Brazil, Argentina, Chile, Saudi Arabia, UAE, South Africa, Turkey and Egypt
Competitive landscape Leading Companies, Market Positioning of Companies, Competitive Strategies, and Industry Risks

Request Free Sample

Research Analyst Overview

  • The Hydrogen Direct Reduction Iron market is undergoing a profound structural evolution as heavy manufacturing pivots toward carbon neutral metallurgy. Facilities are aggressively adopting advanced proton exchange membrane electrolysis to secure reliable inputs, directly altering traditional supply chain dependencies.
  • Industrial operators utilizing optimized solid oxide electrolyzer cells have recorded a 30% increase in energy conversion efficiency, fundamentally transforming baseline operational expenditures. This technological shift requires precise endothermic reduction management to maintain optimal reaction kinetics during the sponge iron metallization phase. By integrating sophisticated thermal management algorithms, producers can stabilize temperature profiles, reducing material waste and improving overall product consistency.
  • The continuous refinement of shaft furnace architecture enables higher throughput rates and seamless electric arc furnace charging. Furthermore, strategic integration of these systems allows decision-makers to align product strategy with tightening compliance frameworks, ensuring long-term operational resilience.
  • The persistent focus on fluid dynamics optimization continues to mitigate equipment erosion, significantly lowering maintenance intervals and enhancing the commercial viability of large-scale clean ironmaking infrastructure.

What are the Key Data Covered in this Hydrogen Direct Reduction Iron Market Research and Growth Report?

  • What is the expected growth of the Hydrogen Direct Reduction Iron Market between 2026 and 2030?

    • USD 2.50 billion, at a CAGR of 16.9%

  • What segmentation does the market report cover?

    • The report is segmented by Technology (Shaft furnace, Fluidized bed, and Others), Type (Green hydrogen, Hybrid, and Blue hydrogen), Form Factor (Hot direct reduced iron, Cold DRI, and Hot briquetted iron) and Geography (Europe, APAC, North America, South America, Middle East and Africa)

  • Which regions are analyzed in the report?

    • Europe, APAC, North America, South America and Middle East and Africa

  • What are the key growth drivers and market challenges?

    • Acceleration of decarbonization mandates and global regulatory frameworks, Disparity in operational expenditure and green hydrogen price volatility

  • Who are the major players in the Hydrogen Direct Reduction Iron Market?

    • Air Liquide SA, Air Products and Chem Inc., ArcelorMittal S.A., Cleveland Cliffs Inc., Danieli and C. Officine SpA, JSW Holdings Ltd., Linde Plc, Metso Outotec Corp., Midrex Technologies Inc., Nippon Steel Corp., POSCO Co. Ltd., Primetals Technologies Ltd., Salzgitter AG, Saudi Basic Industries, SMS group GmbH, SSAB AB, Tata Steel Ltd., Tenova SpA, Tosyali Holding and voestalpine AG

Market Research Insights

  • The Hydrogen Direct Reduction Iron Market is rapidly evolving as producers embrace industrial decarbonization mandate compliance to maintain competitiveness. The integration of renewable energy grid integration has enabled facilities to achieve a 40% reduction in overall emission intensity reduction compared to legacy systems.
  • As manufacturers optimize solar to hydrogen conversion technologies, the levelized hydrogen cost has decreased by 18%, accelerating the viability of fossil fuel displacement. Companies are increasingly engaging in vertical supply chain alliance formations to secure reliable feedstock and improve supply chain visibility.
  • This strategic pivot ensures compliance with stringent border carbon adjustment frameworks while meeting the surging downstream automotive demand for sustainable materials.

We can help! Our analysts can customize this hydrogen direct reduction iron market research report to meet your requirements.

Get in touch

1. Executive Summary

1.1 Market overview

Executive Summary - Chart on Market Overview
Executive Summary - Data Table on Market Overview
Executive Summary - Chart on Global Market Characteristics
Executive Summary - Chart on Market by Geography
Executive Summary - Chart on Market Segmentation by Technology
Executive Summary - Chart on Market Segmentation by Type
Executive Summary - Chart on Market Segmentation by Form Factor
Executive Summary - Chart on Incremental Growth
Executive Summary - Data Table on Incremental Growth
Executive Summary - Chart on Company Market Positioning

2. Technavio Analysis

2.1 Analysis of price sensitivity, lifecycle, customer purchase basket, adoption rates, and purchase criteria

2.2 Criticality of inputs and Factors of differentiation

Chart on Overview on criticality of inputs and factors of differentiation

2.3 Factors of disruption

Chart on Overview on factors of disruption

2.4 Impact of drivers and challenges

Chart on Impact of drivers and challenges in 2025 and 2030

3. Market Landscape

3.1 Market ecosystem

Chart on Parent Market
Data Table on - Parent Market

3.2 Market characteristics

Chart on Market characteristics analysis

3.3 Value chain analysis

Chart on Value chain analysis

4. Market Sizing

4.1 Market definition

Data Table on Offerings of companies included in the market definition

4.2 Market segment analysis

Market segments

4.3 Market size 2025

4.4 Market outlook: Forecast for 2025-2030

Chart on Global - Market size and forecast 2025-2030 ($ million)
Data Table on Global - Market size and forecast 2025-2030 ($ million)
Chart on Global Market: Year-over-year growth 2025-2030 (%)
Data Table on Global Market: Year-over-year growth 2025-2030 (%)

5. Historic Market Size

5.1 Global Hydrogen Direct Reduction Iron Market 2020 - 2024

Historic Market Size - Data Table on Global Hydrogen Direct Reduction Iron Market 2020 - 2024 ($ million)

5.2 Technology segment analysis 2020 - 2024

Historic Market Size - Technology Segment 2020 - 2024 ($ million)

5.3 Type segment analysis 2020 - 2024

Historic Market Size - Type Segment 2020 - 2024 ($ million)

5.4 Form Factor segment analysis 2020 - 2024

Historic Market Size - Form Factor Segment 2020 - 2024 ($ million)

5.5 Geography segment analysis 2020 - 2024

Historic Market Size - Geography Segment 2020 - 2024 ($ million)

5.6 Country segment analysis 2020 - 2024

Historic Market Size - Country Segment 2020 - 2024 ($ million)

6. Qualitative Analysis

6.1 Impact of AI on Global Hydrogen Direct Reduction Iron Market

6.2 Impact of geopolitical conflicts on Global Hydrogen Direct Reduction Iron Market

7. Five Forces Analysis

7.1 Five forces summary

Five forces analysis - Comparison between 2025 and 2030

7.2 Bargaining power of buyers

Bargaining power of buyers - Impact of key factors 2025 and 2030

7.3 Bargaining power of suppliers

Bargaining power of suppliers - Impact of key factors in 2025 and 2030

7.4 Threat of new entrants

Threat of new entrants - Impact of key factors in 2025 and 2030

7.5 Threat of substitutes

Threat of substitutes - Impact of key factors in 2025 and 2030

7.6 Threat of rivalry

Threat of rivalry - Impact of key factors in 2025 and 2030

7.7 Market condition

Chart on Market condition - Five forces 2025 and 2030

8. Market Segmentation by Technology

8.1 Market segments

Chart on Technology - Market share 2025-2030 (%)
Data Table on Technology - Market share 2025-2030 (%)

8.2 Comparison by Technology

Chart on Comparison by Technology
Data Table on Comparison by Technology

8.3 Shaft furnace - Market size and forecast 2025-2030

Chart on Shaft furnace - Market size and forecast 2025-2030 ($ million)
Data Table on Shaft furnace - Market size and forecast 2025-2030 ($ million)
Chart on Shaft furnace - Year-over-year growth 2025-2030 (%)
Data Table on Shaft furnace - Year-over-year growth 2025-2030 (%)

8.4 Fluidized bed - Market size and forecast 2025-2030

Chart on Fluidized bed - Market size and forecast 2025-2030 ($ million)
Data Table on Fluidized bed - Market size and forecast 2025-2030 ($ million)
Chart on Fluidized bed - Year-over-year growth 2025-2030 (%)
Data Table on Fluidized bed - Year-over-year growth 2025-2030 (%)

8.5 Others - Market size and forecast 2025-2030

Chart on Others - Market size and forecast 2025-2030 ($ million)
Data Table on Others - Market size and forecast 2025-2030 ($ million)
Chart on Others - Year-over-year growth 2025-2030 (%)
Data Table on Others - Year-over-year growth 2025-2030 (%)

8.6 Market opportunity by Technology

Market opportunity by Technology ($ million)
Data Table on Market opportunity by Technology ($ million)

9. Market Segmentation by Type

9.1 Market segments

Chart on Type - Market share 2025-2030 (%)
Data Table on Type - Market share 2025-2030 (%)

9.2 Comparison by Type

Chart on Comparison by Type
Data Table on Comparison by Type

9.3 Green hydrogen - Market size and forecast 2025-2030

Chart on Green hydrogen - Market size and forecast 2025-2030 ($ million)
Data Table on Green hydrogen - Market size and forecast 2025-2030 ($ million)
Chart on Green hydrogen - Year-over-year growth 2025-2030 (%)
Data Table on Green hydrogen - Year-over-year growth 2025-2030 (%)

9.4 Hybrid - Market size and forecast 2025-2030

Chart on Hybrid - Market size and forecast 2025-2030 ($ million)
Data Table on Hybrid - Market size and forecast 2025-2030 ($ million)
Chart on Hybrid - Year-over-year growth 2025-2030 (%)
Data Table on Hybrid - Year-over-year growth 2025-2030 (%)

9.5 Blue hydrogen - Market size and forecast 2025-2030

Chart on Blue hydrogen - Market size and forecast 2025-2030 ($ million)
Data Table on Blue hydrogen - Market size and forecast 2025-2030 ($ million)
Chart on Blue hydrogen - Year-over-year growth 2025-2030 (%)
Data Table on Blue hydrogen - Year-over-year growth 2025-2030 (%)

9.6 Market opportunity by Type

Market opportunity by Type ($ million)
Data Table on Market opportunity by Type ($ million)

10. Market Segmentation by Form Factor

10.1 Market segments

Chart on Form Factor - Market share 2025-2030 (%)
Data Table on Form Factor - Market share 2025-2030 (%)

10.2 Comparison by Form Factor

Chart on Comparison by Form Factor
Data Table on Comparison by Form Factor

10.3 Hot direct reduced iron - Market size and forecast 2025-2030

Chart on Hot direct reduced iron - Market size and forecast 2025-2030 ($ million)
Data Table on Hot direct reduced iron - Market size and forecast 2025-2030 ($ million)
Chart on Hot direct reduced iron - Year-over-year growth 2025-2030 (%)
Data Table on Hot direct reduced iron - Year-over-year growth 2025-2030 (%)

10.4 Cold DRI - Market size and forecast 2025-2030

Chart on Cold DRI - Market size and forecast 2025-2030 ($ million)
Data Table on Cold DRI - Market size and forecast 2025-2030 ($ million)
Chart on Cold DRI - Year-over-year growth 2025-2030 (%)
Data Table on Cold DRI - Year-over-year growth 2025-2030 (%)

10.5 Hot briquetted iron - Market size and forecast 2025-2030

Chart on Hot briquetted iron - Market size and forecast 2025-2030 ($ million)
Data Table on Hot briquetted iron - Market size and forecast 2025-2030 ($ million)
Chart on Hot briquetted iron - Year-over-year growth 2025-2030 (%)
Data Table on Hot briquetted iron - Year-over-year growth 2025-2030 (%)

10.6 Market opportunity by Form Factor

Market opportunity by Form Factor ($ million)
Data Table on Market opportunity by Form Factor ($ million)

11. Customer Landscape

11.1 Customer landscape overview

Analysis of price sensitivity, lifecycle, customer purchase basket, adoption rates, and purchase criteria

12. Geographic Landscape

12.1 Geographic segmentation

Chart on Market share by geography 2025-2030 (%)
Data Table on Market share by geography 2025-2030 (%)

12.2 Geographic comparison

Chart on Geographic comparison
Data Table on Geographic comparison

12.3 Europe - Market size and forecast 2025-2030

Chart on Europe - Market size and forecast 2025-2030 ($ million)
Data Table on Europe - Market size and forecast 2025-2030 ($ million)
Chart on Europe - Year-over-year growth 2025-2030 (%)
Data Table on Europe - Year-over-year growth 2025-2030 (%)
Chart on Regional Comparison - Europe
Data Table on Regional Comparison - Europe

12.3.1 Sweden - Market size and forecast 2025-2030

Chart on Sweden - Market size and forecast 2025-2030 ($ million)
Data Table on Sweden - Market size and forecast 2025-2030 ($ million)
Chart on Sweden - Year-over-year growth 2025-2030 (%)
Data Table on Sweden - Year-over-year growth 2025-2030 (%)

12.3.2 Germany - Market size and forecast 2025-2030

Chart on Germany - Market size and forecast 2025-2030 ($ million)
Data Table on Germany - Market size and forecast 2025-2030 ($ million)
Chart on Germany - Year-over-year growth 2025-2030 (%)
Data Table on Germany - Year-over-year growth 2025-2030 (%)

12.3.3 Austria - Market size and forecast 2025-2030

Chart on Austria - Market size and forecast 2025-2030 ($ million)
Data Table on Austria - Market size and forecast 2025-2030 ($ million)
Chart on Austria - Year-over-year growth 2025-2030 (%)
Data Table on Austria - Year-over-year growth 2025-2030 (%)

12.3.4 The Netherlands - Market size and forecast 2025-2030

Chart on The Netherlands - Market size and forecast 2025-2030 ($ million)
Data Table on The Netherlands - Market size and forecast 2025-2030 ($ million)
Chart on The Netherlands - Year-over-year growth 2025-2030 (%)
Data Table on The Netherlands - Year-over-year growth 2025-2030 (%)

12.3.5 Spain - Market size and forecast 2025-2030

Chart on Spain - Market size and forecast 2025-2030 ($ million)
Data Table on Spain - Market size and forecast 2025-2030 ($ million)
Chart on Spain - Year-over-year growth 2025-2030 (%)
Data Table on Spain - Year-over-year growth 2025-2030 (%)

12.3.6 France - Market size and forecast 2025-2030

Chart on France - Market size and forecast 2025-2030 ($ million)
Data Table on France - Market size and forecast 2025-2030 ($ million)
Chart on France - Year-over-year growth 2025-2030 (%)
Data Table on France - Year-over-year growth 2025-2030 (%)

12.4 APAC - Market size and forecast 2025-2030

Chart on APAC - Market size and forecast 2025-2030 ($ million)
Data Table on APAC - Market size and forecast 2025-2030 ($ million)
Chart on APAC - Year-over-year growth 2025-2030 (%)
Data Table on APAC - Year-over-year growth 2025-2030 (%)
Chart on Regional Comparison - APAC
Data Table on Regional Comparison - APAC

12.4.1 China - Market size and forecast 2025-2030

Chart on China - Market size and forecast 2025-2030 ($ million)
Data Table on China - Market size and forecast 2025-2030 ($ million)
Chart on China - Year-over-year growth 2025-2030 (%)
Data Table on China - Year-over-year growth 2025-2030 (%)

12.4.2 India - Market size and forecast 2025-2030

Chart on India - Market size and forecast 2025-2030 ($ million)
Data Table on India - Market size and forecast 2025-2030 ($ million)
Chart on India - Year-over-year growth 2025-2030 (%)
Data Table on India - Year-over-year growth 2025-2030 (%)

12.4.3 South Korea - Market size and forecast 2025-2030

Chart on South Korea - Market size and forecast 2025-2030 ($ million)
Data Table on South Korea - Market size and forecast 2025-2030 ($ million)
Chart on South Korea - Year-over-year growth 2025-2030 (%)
Data Table on South Korea - Year-over-year growth 2025-2030 (%)

12.4.4 Japan - Market size and forecast 2025-2030

Chart on Japan - Market size and forecast 2025-2030 ($ million)
Data Table on Japan - Market size and forecast 2025-2030 ($ million)
Chart on Japan - Year-over-year growth 2025-2030 (%)
Data Table on Japan - Year-over-year growth 2025-2030 (%)

12.4.5 Australia - Market size and forecast 2025-2030

Chart on Australia - Market size and forecast 2025-2030 ($ million)
Data Table on Australia - Market size and forecast 2025-2030 ($ million)
Chart on Australia - Year-over-year growth 2025-2030 (%)
Data Table on Australia - Year-over-year growth 2025-2030 (%)

12.4.6 Indonesia - Market size and forecast 2025-2030

Chart on Indonesia - Market size and forecast 2025-2030 ($ million)
Data Table on Indonesia - Market size and forecast 2025-2030 ($ million)
Chart on Indonesia - Year-over-year growth 2025-2030 (%)
Data Table on Indonesia - Year-over-year growth 2025-2030 (%)

12.5 North America - Market size and forecast 2025-2030

Chart on North America - Market size and forecast 2025-2030 ($ million)
Data Table on North America - Market size and forecast 2025-2030 ($ million)
Chart on North America - Year-over-year growth 2025-2030 (%)
Data Table on North America - Year-over-year growth 2025-2030 (%)
Chart on Regional Comparison - North America
Data Table on Regional Comparison - North America

12.5.1 US - Market size and forecast 2025-2030

Chart on US - Market size and forecast 2025-2030 ($ million)
Data Table on US - Market size and forecast 2025-2030 ($ million)
Chart on US - Year-over-year growth 2025-2030 (%)
Data Table on US - Year-over-year growth 2025-2030 (%)

12.5.2 Canada - Market size and forecast 2025-2030

Chart on Canada - Market size and forecast 2025-2030 ($ million)
Data Table on Canada - Market size and forecast 2025-2030 ($ million)
Chart on Canada - Year-over-year growth 2025-2030 (%)
Data Table on Canada - Year-over-year growth 2025-2030 (%)

12.5.3 Mexico - Market size and forecast 2025-2030

Chart on Mexico - Market size and forecast 2025-2030 ($ million)
Data Table on Mexico - Market size and forecast 2025-2030 ($ million)
Chart on Mexico - Year-over-year growth 2025-2030 (%)
Data Table on Mexico - Year-over-year growth 2025-2030 (%)

12.6 South America - Market size and forecast 2025-2030

Chart on South America - Market size and forecast 2025-2030 ($ million)
Data Table on South America - Market size and forecast 2025-2030 ($ million)
Chart on South America - Year-over-year growth 2025-2030 (%)
Data Table on South America - Year-over-year growth 2025-2030 (%)
Chart on Regional Comparison - South America
Data Table on Regional Comparison - South America

12.6.1 Brazil - Market size and forecast 2025-2030

Chart on Brazil - Market size and forecast 2025-2030 ($ million)
Data Table on Brazil - Market size and forecast 2025-2030 ($ million)
Chart on Brazil - Year-over-year growth 2025-2030 (%)
Data Table on Brazil - Year-over-year growth 2025-2030 (%)

12.6.2 Argentina - Market size and forecast 2025-2030

Chart on Argentina - Market size and forecast 2025-2030 ($ million)
Data Table on Argentina - Market size and forecast 2025-2030 ($ million)
Chart on Argentina - Year-over-year growth 2025-2030 (%)
Data Table on Argentina - Year-over-year growth 2025-2030 (%)

12.6.3 Chile - Market size and forecast 2025-2030

Chart on Chile - Market size and forecast 2025-2030 ($ million)
Data Table on Chile - Market size and forecast 2025-2030 ($ million)
Chart on Chile - Year-over-year growth 2025-2030 (%)
Data Table on Chile - Year-over-year growth 2025-2030 (%)

12.7 Middle East and Africa - Market size and forecast 2025-2030

Chart on Middle East and Africa - Market size and forecast 2025-2030 ($ million)
Data Table on Middle East and Africa - Market size and forecast 2025-2030 ($ million)
Chart on Middle East and Africa - Year-over-year growth 2025-2030 (%)
Data Table on Middle East and Africa - Year-over-year growth 2025-2030 (%)
Chart on Regional Comparison - Middle East and Africa
Data Table on Regional Comparison - Middle East and Africa

12.7.1 Saudi Arabia - Market size and forecast 2025-2030

Chart on Saudi Arabia - Market size and forecast 2025-2030 ($ million)
Data Table on Saudi Arabia - Market size and forecast 2025-2030 ($ million)
Chart on Saudi Arabia - Year-over-year growth 2025-2030 (%)
Data Table on Saudi Arabia - Year-over-year growth 2025-2030 (%)

12.7.2 UAE - Market size and forecast 2025-2030

Chart on UAE - Market size and forecast 2025-2030 ($ million)
Data Table on UAE - Market size and forecast 2025-2030 ($ million)
Chart on UAE - Year-over-year growth 2025-2030 (%)
Data Table on UAE - Year-over-year growth 2025-2030 (%)

12.7.3 South Africa - Market size and forecast 2025-2030

Chart on South Africa - Market size and forecast 2025-2030 ($ million)
Data Table on South Africa - Market size and forecast 2025-2030 ($ million)
Chart on South Africa - Year-over-year growth 2025-2030 (%)
Data Table on South Africa - Year-over-year growth 2025-2030 (%)

12.7.4 Turkey - Market size and forecast 2025-2030

Chart on Turkey - Market size and forecast 2025-2030 ($ million)
Data Table on Turkey - Market size and forecast 2025-2030 ($ million)
Chart on Turkey - Year-over-year growth 2025-2030 (%)
Data Table on Turkey - Year-over-year growth 2025-2030 (%)

12.7.5 Egypt - Market size and forecast 2025-2030

Chart on Egypt - Market size and forecast 2025-2030 ($ million)
Data Table on Egypt - Market size and forecast 2025-2030 ($ million)
Chart on Egypt - Year-over-year growth 2025-2030 (%)
Data Table on Egypt - Year-over-year growth 2025-2030 (%)

12.8 Market opportunity by geography

Market opportunity by geography ($ million)
Data Tables on Market opportunity by geography ($ million)

13. Drivers, Challenges, and Opportunity

13.1 Market drivers

Acceleration of decarbonization mandates and global regulatory frameworks
Advancements in green hydrogen production and electrolyzer efficiency
Surging downstream demand for green steel in automotive and construction sectors

13.2 Market challenges

Disparity in operational expenditure and green hydrogen price volatility
Scarcity of high-grade iron ore feedstock and metallurgical constraints
Infrastructure deficits and capital intensity of facility retrofitting

13.3 Impact of drivers and challenges

Impact of drivers and challenges in 2025 and 2030

13.4 Market opportunities

Emergence of dual-fuel and hydrogen-ready facility architectures
Integration of vertical supply chains through cross-sector alliances
Optimization of metallurgical processes via advanced digital twins and ML

14. Competitive Landscape

14.1 Overview

14.2

Overview on criticality of inputs and factors of differentiation

14.3 Landscape disruption

Overview on factors of disruption

14.4 Industry risks

Impact of key risks on business

15. Competitive Analysis

15.1 Companies profiled

Companies covered

15.2 Company ranking index

15.3 Market positioning of companies

Matrix on companies position and classification

15.4 Air Liquide SA

Air Liquide SA - Overview
Air Liquide SA - Business segments
Air Liquide SA - Key news
Air Liquide SA - Key offerings
Air Liquide SA - Segment focus
SWOT

15.5 Air Products and Chem Inc.

Air Products and Chem Inc. - Overview
Air Products and Chem Inc. - Business segments
Air Products and Chem Inc. - Key offerings
Air Products and Chem Inc. - Segment focus
SWOT

15.6 ArcelorMittal S.A.

ArcelorMittal S.A. - Overview
ArcelorMittal S.A. - Business segments
ArcelorMittal S.A. - Key offerings
ArcelorMittal S.A. - Segment focus
SWOT

15.7 Cleveland Cliffs Inc.

Cleveland Cliffs Inc. - Overview
Cleveland Cliffs Inc. - Product / Service
Cleveland Cliffs Inc. - Key offerings
SWOT

15.8 Linde Plc

Linde Plc - Overview
Linde Plc - Business segments
Linde Plc - Key offerings
Linde Plc - Segment focus
SWOT

15.9 Metso Outotec Corp.

Metso Outotec Corp. - Overview
Metso Outotec Corp. - Business segments
Metso Outotec Corp. - Key offerings
Metso Outotec Corp. - Segment focus
SWOT

15.10 Nippon Steel Corp.

Nippon Steel Corp. - Overview
Nippon Steel Corp. - Business segments
Nippon Steel Corp. - Key offerings
Nippon Steel Corp. - Segment focus
SWOT

15.11 POSCO Co. Ltd.

POSCO Co. Ltd. - Overview
POSCO Co. Ltd. - Business segments
POSCO Co. Ltd. - Key news
POSCO Co. Ltd. - Key offerings
POSCO Co. Ltd. - Segment focus
SWOT

15.12 Primetals Technologies Ltd.

Primetals Technologies Ltd. - Overview
Primetals Technologies Ltd. - Product / Service
Primetals Technologies Ltd. - Key offerings
SWOT

15.13 Saudi Basic Industries

Saudi Basic Industries - Overview
Saudi Basic Industries - Business segments
Saudi Basic Industries - Key offerings
Saudi Basic Industries - Segment focus
SWOT

15.14 SMS group GmbH

SMS group GmbH - Overview
SMS group GmbH - Product / Service
SMS group GmbH - Key offerings
SWOT

15.15 SSAB AB

SSAB AB - Overview
SSAB AB - Business segments
SSAB AB - Key offerings
SSAB AB - Segment focus
SWOT

15.16 Tata Steel Ltd.

Tata Steel Ltd. - Overview
Tata Steel Ltd. - Business segments
Tata Steel Ltd. - Key offerings
Tata Steel Ltd. - Segment focus
SWOT

15.17 Tenova SpA

Tenova SpA - Overview
Tenova SpA - Product / Service
Tenova SpA - Key offerings
SWOT

15.18 voestalpine AG

voestalpine AG - Overview
voestalpine AG - Business segments
voestalpine AG - Key offerings
voestalpine AG - Segment focus
SWOT

16. Appendix

16.1 Scope of the report

Market definition
Objectives
Notes and caveats

16.2 Inclusions and exclusions checklist

Inclusions checklist
Exclusions checklist

16.3 Currency conversion rates for US$

16.4 Research methodology

16.5 Data procurement

Information sources

16.6 Data validation

16.7 Validation techniques employed for market sizing

16.8 Data synthesis

16.9 360 degree market analysis

16.10 List of abbreviations

Research Methodology

Technavio presents a detailed picture of the market by way of study, synthesis, and summation of data from multiple sources. The analysts have presented the various facets of the market with a particular focus on identifying the key industry influencers. The data thus presented is comprehensive, reliable, and the result of extensive research, both primary and secondary.

INFORMATION SOURCES

Primary sources

  • Manufacturers and suppliers
  • Channel partners
  • Industry experts
  • Strategic decision makers

Secondary sources

  • Industry journals and periodicals
  • Government data
  • Financial reports of key industry players
  • Historical data
  • Press releases

DATA ANALYSIS

Data Synthesis

  • Collation of data
  • Estimation of key figures
  • Analysis of derived insights

Data Validation

  • Triangulation with data models
  • Reference against proprietary databases
  • Corroboration with industry experts

REPORT WRITING

Qualitative

  • Market drivers
  • Market challenges
  • Market trends
  • Five forces analysis

Quantitative

  • Market size and forecast
  • Market segmentation
  • Geographical insights
  • Competitive landscape

Interested in this report?

Get your sample now to see our research methodology and insights!

Download Now

Frequently Asked Questions

Hydrogen Direct Reduction Iron market growth will increase by USD 2495.5 million during 2026-2030.

The Hydrogen Direct Reduction Iron market is expected to grow at a CAGR of 16.9% during 2026-2030.

Hydrogen Direct Reduction Iron market is segmented by Technology (Shaft furnace, Fluidized bed, Others) Type (Green hydrogen, Hybrid, Blue hydrogen) Form factor (Hot direct reduced iron, Cold DRI, Hot briquetted iron)

Air Liquide SA, Air Products and Chem Inc., ArcelorMittal S.A., Cleveland Cliffs Inc., Danieli and C. Officine SpA, JSW Holdings Ltd., Linde Plc, Metso Outotec Corp., Midrex Technologies Inc., Nippon Steel Corp., POSCO Co. Ltd., Primetals Technologies Ltd., Salzgitter AG, Saudi Basic Industries, SMS group GmbH, SSAB AB, Tata Steel Ltd., Tenova SpA, Tosyali Holding, voestalpine AG are a few of the key vendors in the Hydrogen Direct Reduction Iron market.

Europe will register the highest growth rate of 36.9% among the other regions. Therefore, the Hydrogen Direct Reduction Iron market in Europe is expected to garner significant business opportunities for the vendors during the forecast period.

Sweden, Germany, Austria, The Netherlands, Spain, France, China, India, South Korea, Japan, Australia, Indonesia, US, Canada, Mexico, Brazil, Argentina, Chile, Saudi Arabia, UAE, South Africa, Turkey, Egypt

  • Acceleration of decarbonization mandates and global regulatory frameworks is the driving factor this market.

The Hydrogen Direct Reduction Iron market vendors should focus on grabbing business opportunities from the Technology segment as it accounted for the largest market share in the base year.
RIA - Research AI Assistant
Ask RIA
