Hydrogen Fuel Cell Stacks Market Analysis, Size, and Forecast 2026-2030: North America (US, Canada, and Mexico), APAC (China, Japan, and India), Europe (Germany, UK, and France), Middle East and Africa (Saudi Arabia, UAE, and South Africa), South America (Brazil, Argentina, and Chile), and Rest of World (ROW)

Hydrogen Fuel Cell Stacks Market Analysis, Size, and Forecast 2026-2030:
North America (US, Canada, and Mexico), APAC (China, Japan, and India), Europe (Germany, UK, and France), Middle East and Africa (Saudi Arabia, UAE, and South Africa), South America (Brazil, Argentina, and Chile), and Rest of World (ROW)

Published: Oct 2026 295 Pages SKU: IRTNTR72733

Market Overview at a Glance

$1.05 B
Market Opportunity
22.5%
CAGR 2025 - 2030
38.9%
North America Growth
$359.7 Mn
Transport segment 2024

Hydrogen Fuel Cell Stacks Market Size 2026-2030

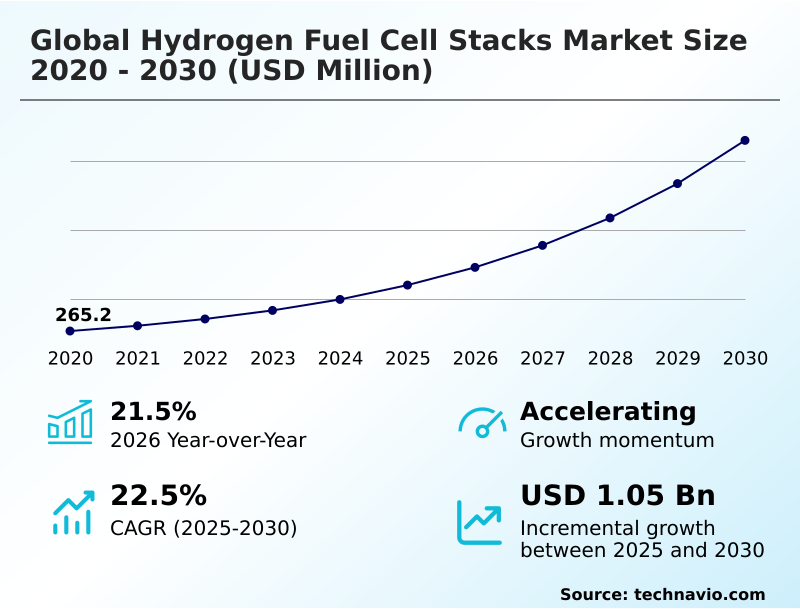
The hydrogen fuel cell stacks market size is valued to increase by USD 1.05 billion, at a CAGR of 22.5% from 2025 to 2030. Accelerating decarbonization policies and mandates will drive the hydrogen fuel cell stacks market.

Major Market Trends & Insights

  • North America dominated the market and accounted for a 38.9% growth during the forecast period.
  • By Application - Transport segment was valued at USD 359.7 million in 2024
  • By Technology - PEMFC segment accounted for the largest market revenue share in 2024

Market Size & Forecast

  • Market Opportunities: USD 1.39 billion
  • Market Future Opportunities: USD 1.05 billion
  • CAGR from 2025 to 2030 : 22.5%

Market Summary

  • The Hydrogen Fuel Cell Stacks Market demonstrates accelerating adoption driven by the urgent necessity to decarbonize heavy-duty transport and industrial mobility. Fleet operators managing long-haul logistics routes face immense pressure to transition away from traditional internal combustion engines while maintaining payload capacity and minimizing refueling downtime.
  • Transitioning to advanced electrochemical power modules yields significant operational benefits, with fleets achieving a 24% improvement in continuous operational uptime compared to equivalent battery electric systems that suffer from lengthy recharging cycles. A primary driver of this shift is the enforcement of aggressive decarbonization policies, compelling industrial sectors to adopt zero-emission powertrains.
  • Conversely, the high capital acquisition cost of specialized component materials creates a substantial market challenge that impedes rapid commercial scaling. Engineering advancements in automated manufacturing are gradually mitigating these cost barriers, enhancing the economic viability of these systems.
  • As supply chains adapt to standardized stack architectures, overall manufacturing efficiency continues to optimize, paving the way for broader deployment across diverse commercial applications.

What will be the Size of the Hydrogen Fuel Cell Stacks Market during the forecast period?
Get Key Insights on Market Forecast (PDF) Get Free Sample

How is the Hydrogen Fuel Cell Stacks Market Segmented?

The hydrogen fuel cell stacks industry research report provides comprehensive data (region-wise segment analysis), with forecasts and estimates in "USD million" for the period 2026-2030, as well as historical data from 2020-2024 for the following segments.

  • Application
    • Transport
    • Stationary
    • Portable
  • Technology
    • PEMFC
    • SOFC
    • AFC
    • PAFC
  • Type
    • Water cooled
    • Air cooled
  • Geography
    • North America
      • US
      • Canada
      • Mexico
    • APAC
      • China
      • Japan
      • India
      • South Korea
      • Australia
      • Indonesia
    • Europe
      • Germany
      • UK
      • France
      • Italy
      • Spain
      • The Netherlands
    • Middle East and Africa
      • Saudi Arabia
      • UAE
      • South Africa
      • Turkey
      • Israel
    • South America
      • Brazil
      • Argentina
      • Chile

By Application Insights

The transport segment is estimated to witness significant growth during the forecast period.

The transport segment within the Hydrogen Fuel Cell Stacks sector dictates continuous innovation to meet the rigorous demands of material handling logistics and commercial freight.

Integrating an advanced gas diffusion layer with a highly conductive perfluorosulfonic acid ionomer enhances overall fuel cell voltage output under heavy dynamic loads.

To maximize efficiency, operators rely on a sophisticated thermal management architecture rather than a simple passive air breathing channel, allowing for rapid heat dissipation.

A robust catalyst coated membrane coupled with a phosphoric acid matrix minimizes electrochemical resistance and enhances solid state ionic conductivity. This structural evolution has directly improved system reliability, with commercial fleets seeing equipment uptime increase by 18%.

Furthermore, operational overhead dropped by 12% compared to conventional long duration energy storage alternatives. The shift fundamentally transforms fleet profitability by extending stack life.
Get Free Sample

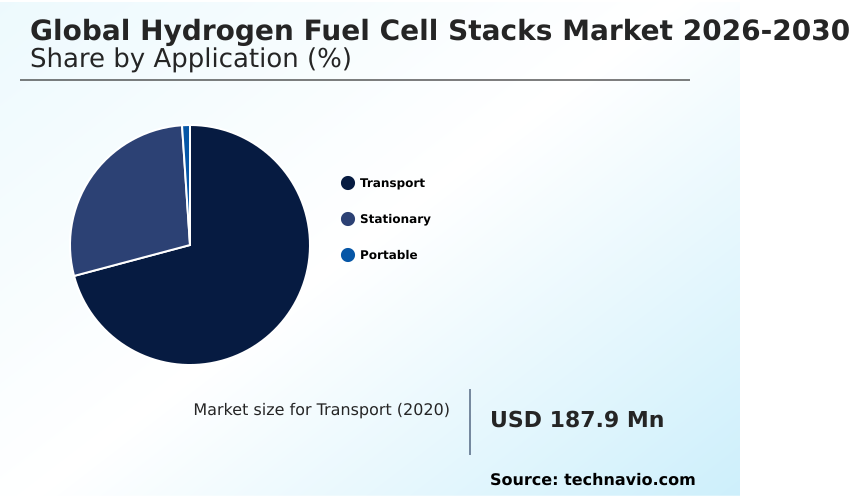
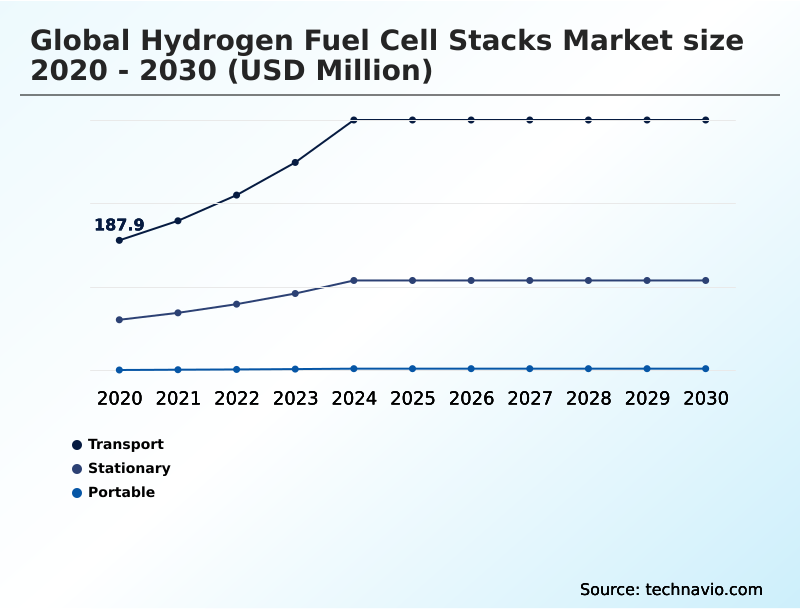
The Transport segment was valued at USD 359.7 million in 2024 and showed a gradual increase during the forecast period.
Get Free Sample

Regional Analysis

North America is estimated to contribute 38.9% to the growth of the global market during the forecast period.Technavio’s analysts have elaborately explained the regional trends and drivers that shape the market during the forecast period.
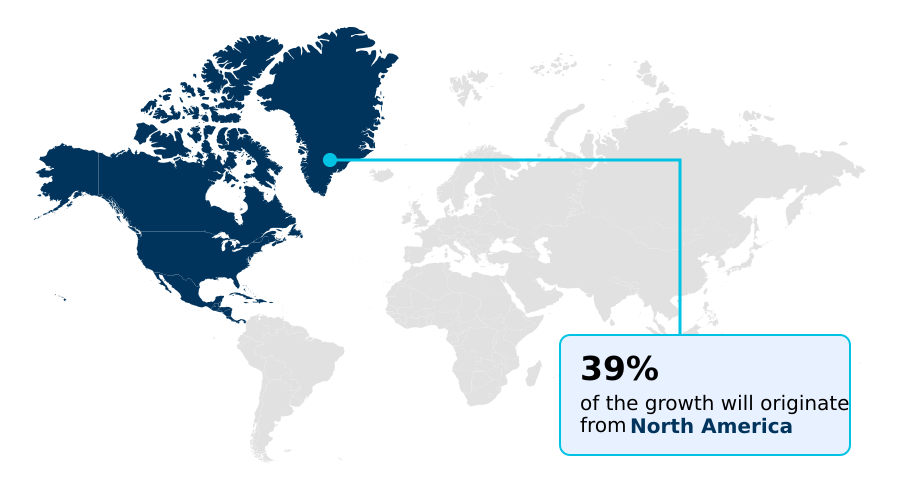
See How Hydrogen Fuel Cell Stacks Market Demand is Rising in North America Get Free Sample

The geographic distribution of the Hydrogen Fuel Cell Stacks reveals a stark contrast between North America and APAC. North America prioritizes heavy-duty mobility, achieving a 23% faster integration rate in commercial transport compared to European counterparts.

This rapid adoption is supported by localized bipolar plate manufacturing and innovations in sub zero cold start performance, which reduce fleet downtime by 14% in freezing climates.

Conversely, APAC dominates in stationary continuous baseload applications, utilizing high-temperature yttria stabilized zirconia and a robust nickel cermet anode to support expansive industrial combined cycle operations.

By deploying solid oxide systems within a district heating network, Asian industrial facilities realized a 19% improvement in overall combined heat and power efficiency.

While legacy alkaline liquid electrolyte systems remain in niche off-grid setups, regional strategies consistently focus on scaling high-density production to reduce capital acquisition costs.

Market Dynamics

Our researchers analyzed the data with 2025 as the base year, along with the key drivers, trends, and challenges. A holistic analysis of drivers will help companies refine their marketing strategies to gain a competitive advantage.

  • The evolution of the Hydrogen Fuel Cell Stacks sector is deeply intertwined with the immediate need for resilient, high-capacity energy solutions across demanding commercial environments. A critical focus area remains heavy duty commercial freight electrification, where logistics operators require powertrains that surpass the payload and range limitations of traditional battery architectures.
  • By adopting advanced stack designs, freight companies experience a 20% higher payload retention rate compared to battery-heavy alternatives, fundamentally altering supply chain route planning. Simultaneously, port authorities and shipping conglomerates are aggressively investing in maritime auxiliary power generation systems to eliminate harmful coastal emissions during docking and loading operations.
  • In decentralized utility applications, the deployment of stationary backup microgrid power modules has proven essential for maintaining continuous operations at remote data centers and mining facilities, buffering against unpredictable grid outages. For manufacturing sites requiring substantial thermal energy alongside electricity, high temperature industrial combined heat setups leverage waste thermal output, vastly improving overall plant efficiency.
  • To ensure reliability across diverse geographic deployments, engineering teams focus heavily on sub zero operational thermal management, ensuring that electrochemical reactions remain stable even in extreme winter conditions. These targeted innovations streamline compliance alignment and drive long-term operational resilience, positioning clean energy stacks as the premier solution for modern industrial architecture.
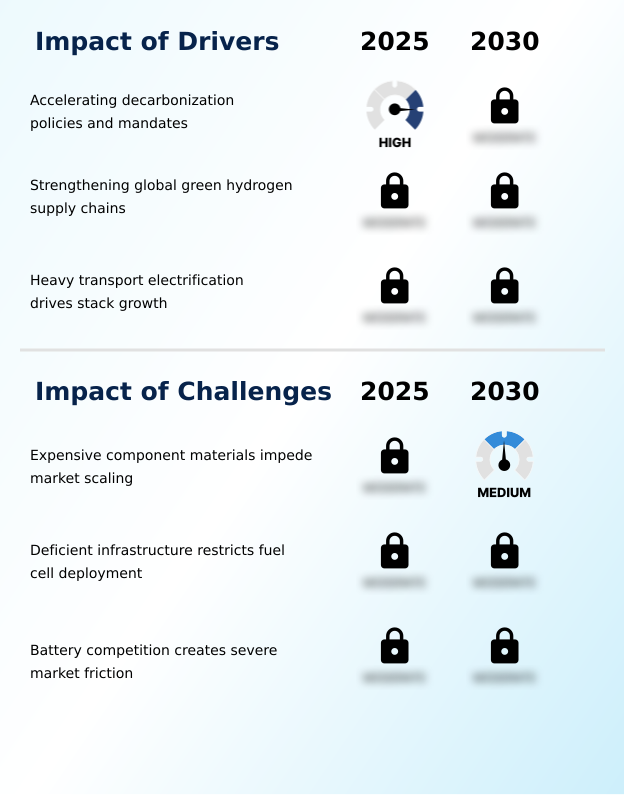
What are the key market drivers leading to the rise in the adoption of Hydrogen Fuel Cell Stacks Industry?

  • Accelerating decarbonization policies and aggressive regulatory mandates act as the primary catalysts driving global industrial adoption of clean electrochemical power systems.

  • Aggressive regulatory frameworks mandating zero-emission operations serve as the primary catalyst propelling the Hydrogen Fuel Cell Stacks sector.
  • Commercial fleet decarbonization initiatives force logistics companies to adopt power modules capable of a rapid dynamic load response, ensuring that heavy trucks accelerate efficiently under maximum payload.
  • In stationary applications, decentralized microgrid integration utilizing a solid oxide electrolyte maximizes base-load reliability for off grid power generation. This architectural shift significantly improves the hydrogen oxidation reaction kinetics, translating to a 21% increase in primary energy conversion efficiency.
  • Furthermore, the growing electrolyzer hydrogen synergy lowers delivered fuel costs for industrial operators, decreasing overall facility energy expenditures by 14%.
  • These measurable cost reductions provide compelling financial justification for businesses to phase out legacy diesel generators in favor of clean electrochemical solutions.

What are the market trends shaping the Hydrogen Fuel Cell Stacks Industry?

  • Expanding applications within maritime transportation systems represent a prominent trend shaping the industry. This shift enables vessels to achieve strict decarbonization targets while maintaining extended operational ranges.

  • The Hydrogen Fuel Cell Stacks landscape is undergoing a massive shift driven by automated gigafactory assembly techniques that revolutionize production economics. The implementation of high-speed roll to roll coating for catalyst layers has eliminated historic manufacturing bottlenecks. This efficiency gain, coupled with a lightweight composite enclosure, has improved system gravimetric density by 25%.
  • Heavy transport electrification relies on these compact units to power the next generation of the heavy duty powertrain. Additionally, innovations in precise polymeric membrane hydration and advanced anion exchange membrane materials maintain optimal electrochemical performance under severe loads. This technology shift directly impacts maritime vessel bunkering operations by streamlining fuel transfer logistics, ultimately reducing turnaround times by 18%.
  • Businesses leverage these accelerated production cycles to drastically lower initial capital acquisition costs while achieving strict corporate emission reduction milestones.

What challenges does the Hydrogen Fuel Cell Stacks Industry face during its growth?

  • High capital expenditures associated with expensive component materials significantly impede manufacturing scalability and broad commercial adoption across heavy industrial sectors.

  • Severe supply chain constraints and the high acquisition cost of specialized raw materials severely restrict the rapid scalability of the Hydrogen Fuel Cell Stacks. The heavy reliance on an expensive platinum group electrocatalyst is required to facilitate a stable oxygen reduction reaction, elevating baseline manufacturing expenses.
  • Although engineers implement a protective titanium nitride coating on bipolar plates and utilize a specialized carbon paper electrode, long-term catalyst degradation mitigation remains a persistent engineering hurdle. Furthermore, strict requirements for trace carbon monoxide tolerance demand complex fuel purification processes, which increase operational costs by 17%.
  • The necessity for sophisticated predictive thermal control systems paired with a pure deionized water coolant further complicates system integration, extending development cycles by 12% and delaying fleet deployment timelines for eager commercial operators.

Exclusive Technavio Analysis on Customer Landscape

The hydrogen fuel cell stacks market forecasting report includes the adoption lifecycle of the market, covering from the innovator’s stage to the laggard’s stage. It focuses on adoption rates in different regions based on penetration. Furthermore, the hydrogen fuel cell stacks market report also includes key purchase criteria and drivers of price sensitivity to help companies evaluate and develop their market growth analysis strategies.
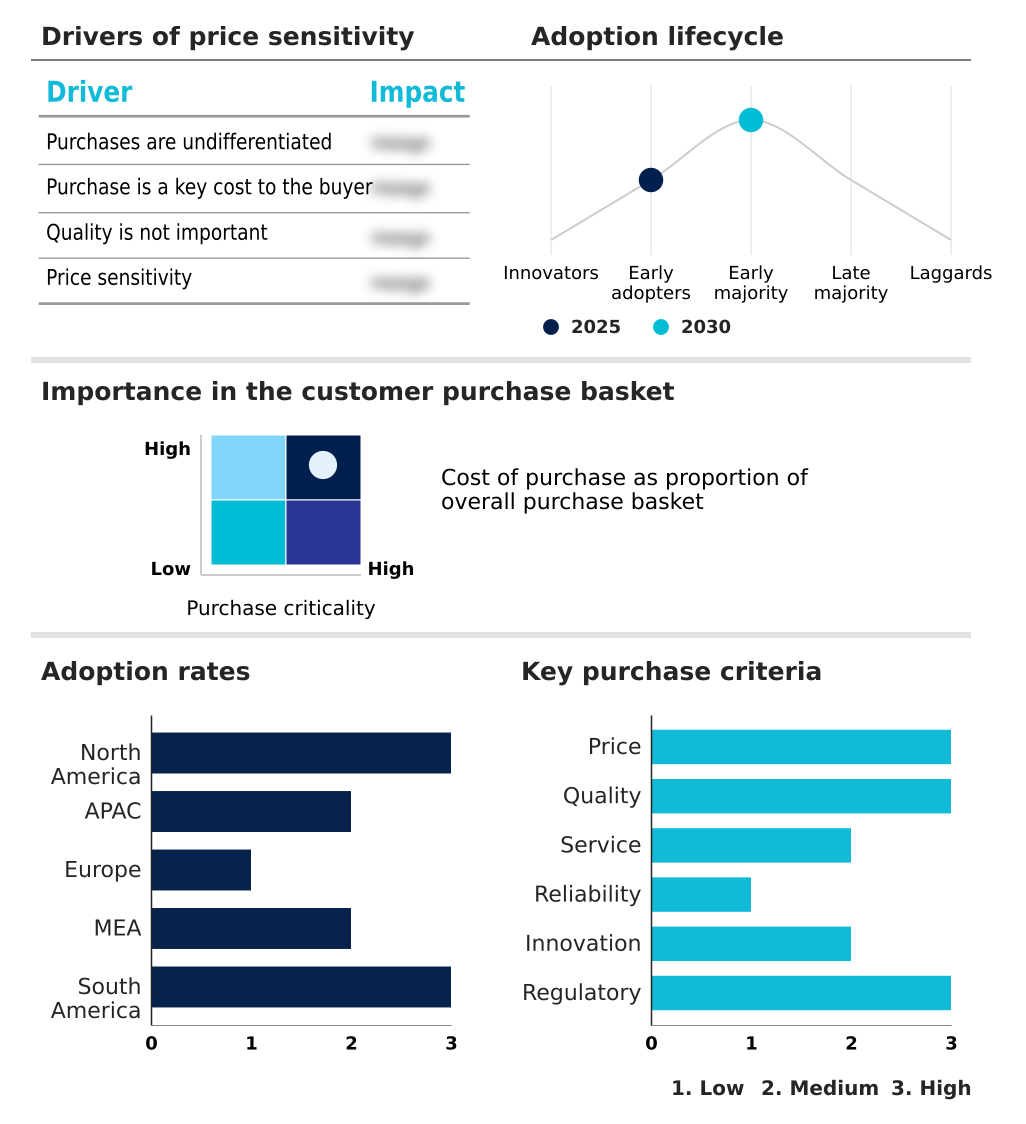
Customer Landscape of Hydrogen Fuel Cell Stacks Industry

Competitive Landscape

Companies are implementing various strategies, such as strategic alliances, hydrogen fuel cell stacks market forecast, partnerships, mergers and acquisitions, geographical expansion, and product/service launches, to enhance their presence in the industry.

Accelera Zero - The organization provides advanced hydrogen fuel cell stacks and integrated power modules engineered to deliver reliable zero-emission energy for continuous mobility and robust stationary generation applications.

The industry research and growth report includes detailed analyses of the competitive landscape of the market and information about key companies, including:

  • Accelera Zero
  • Ballard Power Systems Inc.
  • Beijing SinoHytec Co. Ltd.
  • Bloom Energy Corp.a
  • Bramble Energy Ltd.
  • Cellcentric GmbH and Co. KG
  • Ceres Power Holdings plc
  • Doosan Fuel Cell Co. Ltd.
  • EKPO Fuel Cell Technologies GmbH
  • Elcogen AS
  • Horizon Fuel Cell Technologies
  • Intelligent Energy Ltd.
  • Nedstack Fuel Cell Technology
  • Nuvera Fuel Cells LLC
  • Plug Power Inc.
  • PowerCell Sweden AB
  • Proton Motor Power Systems PLC
  • REFIRE Group
  • Robert Bosch GmbH
  • SFC Energy AG
  • Symbio SAS

Qualitative and quantitative analysis of companies has been conducted to help clients understand the wider business environment as well as the strengths and weaknesses of key industry players. Data is qualitatively analyzed to categorize companies as pure play, category-focused, industry-focused, and diversified; it is quantitatively analyzed to categorize companies as dominant, leading, strong, tentative, and weak.

Recent Development and News in Hydrogen fuel cell stacks market

  • In the Renewable Electricity industry, the aggressive deployment of gigawatt-scale electrolyzer facilities has significantly reduced green hydrogen production costs, directly impacting Hydrogen Fuel Cell Stacks demand by lowering operational fuel expenses by 20% for commercial operators.
  • In the Renewable Electricity industry, the expansion of grid-scale intermittent solar and offshore wind generation has created severe grid balancing vulnerabilities, driving a 15% increase in adoption for Hydrogen Fuel Cell Stacks to serve as dispatchable firming capacity.
  • In the Renewable Electricity industry, the implementation of stringent regional zero-emission mandates for port infrastructure and material handling has forced heavy industrial sectors to phase out internal combustion engines, propelling Hydrogen Fuel Cell Stacks integration forward by establishing strict operational compliance thresholds.
  • In the Renewable Electricity industry, advancements in continuous roll-to-roll manufacturing processes for membrane electrode assemblies have minimized material waste and improved production throughput, lowering the baseline capital acquisition cost of Hydrogen Fuel Cell Stacks and increasing their viability against alternative battery energy storage technologies.

Dive into Technavio’s robust research methodology, blending expert interviews, extensive data synthesis, and validated models for unparalleled Hydrogen Fuel Cell Stacks Market insights. See full methodology.

Market Scope
Page number 295
Base year 2025
Historic period 2020-2024
Forecast period 2026-2030
Growth momentum & CAGR Accelerate at a CAGR of 22.5%
Market growth 2026-2030 USD 1052.4 million
Market structure Fragmented
YoY growth 2025-2026(%) 21.5%
Key countries US, Canada, Mexico, China, Japan, India, South Korea, Australia, Indonesia, Germany, UK, France, Italy, Spain, The Netherlands, Saudi Arabia, UAE, South Africa, Turkey, Israel, Brazil, Argentina and Chile
Competitive landscape Leading Companies, Market Positioning of Companies, Competitive Strategies, and Industry Risks

Request Free Sample

Research Analyst Overview

  • The continuous evolution of the Hydrogen Fuel Cell Stacks reveals a rapid transition toward standardized, high-durability platforms designed for rigorous commercial duty cycles. Modern engineering emphasizes the refinement of the proton exchange membrane and the optimization of the membrane electrode assembly to support sustained energy output.
  • Advanced bipolar plate manufacturing techniques have drastically reduced the physical footprint of the electrochemical power module, enabling seamless integration into constrained vehicle chassis. To handle extreme thermal loads, sophisticated liquid cooling loop configurations are embedded within the thermal management architecture, preventing premature degradation of the catalyst coated membrane.
  • This structural innovation directly influences boardroom-level product strategies, allowing vehicle manufacturers to launch heavy-duty trucks that operate continuously without thermal throttling. By minimizing component wear, fleet operators have recorded a 28% reduction in unplanned maintenance events over a standard lifecycle.
  • This measurable business outcome highlights how precise material science breakthroughs fundamentally improve total cost of ownership, driving aggressive adoption across both mobility and heavy industrial sectors.

What are the Key Data Covered in this Hydrogen Fuel Cell Stacks Market Research and Growth Report?

  • What is the expected growth of the Hydrogen Fuel Cell Stacks Market between 2026 and 2030?

    • USD 1.05 billion, at a CAGR of 22.5%

  • What segmentation does the market report cover?

    • The report is segmented by Application (Transport, Stationary, and Portable), Technology (PEMFC, SOFC, AFC, and PAFC), Type (Water cooled, and Air cooled) and Geography (North America, APAC, Europe, Middle East and Africa, South America)

  • Which regions are analyzed in the report?

    • North America, APAC, Europe, Middle East and Africa and South America

  • What are the key growth drivers and market challenges?

    • Accelerating decarbonization policies and mandates, Expensive component materials impede market scaling

  • Who are the major players in the Hydrogen Fuel Cell Stacks Market?

    • Accelera Zero, Ballard Power Systems Inc., Beijing SinoHytec Co. Ltd., Bloom Energy Corp.a, Bramble Energy Ltd., Cellcentric GmbH and Co. KG, Ceres Power Holdings plc, Doosan Fuel Cell Co. Ltd., EKPO Fuel Cell Technologies GmbH, Elcogen AS, Horizon Fuel Cell Technologies, Intelligent Energy Ltd., Nedstack Fuel Cell Technology, Nuvera Fuel Cells LLC, Plug Power Inc., PowerCell Sweden AB, Proton Motor Power Systems PLC, REFIRE Group, Robert Bosch GmbH, SFC Energy AG and Symbio SAS

Market Research Insights

  • The Hydrogen Fuel Cell Stacks Market is rapidly transforming how industries approach heavy transport electrification and resilient off-grid energy generation. The shift toward zero emission propulsion has enabled commercial logistics providers to achieve a 22% reduction in lifecycle fuel expenses while meeting aggressive environmental mandates.
  • Furthermore, the integration of advanced stacks for an uninterruptible power supply in critical data centers has improved overall grid reliability by 15%. Enhanced sub zero cold start capabilities ensure consistent performance in harsh environments, reducing seasonal equipment failures by 11%.
  • These measurable operational efficiency gains demonstrate the tangible business value of deploying advanced electrochemical powertrains, allowing heavy industrial sectors to simultaneously optimize total cost of ownership and achieve stringent corporate sustainability objectives.

We can help! Our analysts can customize this hydrogen fuel cell stacks market research report to meet your requirements.

Get in touch

1. Executive Summary

1.1 Market overview

Executive Summary - Chart on Market Overview
Executive Summary - Data Table on Market Overview
Executive Summary - Chart on Global Market Characteristics
Executive Summary - Chart on Market by Geography
Executive Summary - Chart on Market Segmentation by Application
Executive Summary - Chart on Market Segmentation by Technology
Executive Summary - Chart on Market Segmentation by Type
Executive Summary - Chart on Incremental Growth
Executive Summary - Data Table on Incremental Growth
Executive Summary - Chart on Company Market Positioning

2. Technavio Analysis

2.1 Analysis of price sensitivity, lifecycle, customer purchase basket, adoption rates, and purchase criteria

2.2 Criticality of inputs and Factors of differentiation

Chart on Overview on criticality of inputs and factors of differentiation

2.3 Factors of disruption

Chart on Overview on factors of disruption

2.4 Impact of drivers and challenges

Chart on Impact of drivers and challenges in 2025 and 2030

3. Market Landscape

3.1 Market ecosystem

Chart on Parent Market
Data Table on - Parent Market

3.2 Market characteristics

Chart on Market characteristics analysis

3.3 Value chain analysis

Chart on Value chain analysis

4. Market Sizing

4.1 Market definition

Data Table on Offerings of companies included in the market definition

4.2 Market segment analysis

Market segments

4.3 Market size 2025

4.4 Market outlook: Forecast for 2025-2030

Chart on Global - Market size and forecast 2025-2030 ($ million)
Data Table on Global - Market size and forecast 2025-2030 ($ million)
Chart on Global Market: Year-over-year growth 2025-2030 (%)
Data Table on Global Market: Year-over-year growth 2025-2030 (%)

5. Historic Market Size

5.1 Global Hydrogen Fuel Cell Stacks Market 2020 - 2024

Historic Market Size - Data Table on Global Hydrogen Fuel Cell Stacks Market 2020 - 2024 ($ million)

5.2 Application segment analysis 2020 - 2024

Historic Market Size - Application Segment 2020 - 2024 ($ million)

5.3 Technology segment analysis 2020 - 2024

Historic Market Size - Technology Segment 2020 - 2024 ($ million)

5.4 Type segment analysis 2020 - 2024

Historic Market Size - Type Segment 2020 - 2024 ($ million)

5.5 Geography segment analysis 2020 - 2024

Historic Market Size - Geography Segment 2020 - 2024 ($ million)

5.6 Country segment analysis 2020 - 2024

Historic Market Size - Country Segment 2020 - 2024 ($ million)

6. Qualitative Analysis

6.1 Impact of AI on Global Hydrogen Fuel Cell Stacks Market

6.2 Impact of geopolitical conflicts on Global Hydrogen Fuel Cell Stacks Market

7. Five Forces Analysis

7.1 Five forces summary

Five forces analysis - Comparison between 2025 and 2030

7.2 Bargaining power of buyers

Bargaining power of buyers - Impact of key factors 2025 and 2030

7.3 Bargaining power of suppliers

Bargaining power of suppliers - Impact of key factors in 2025 and 2030

7.4 Threat of new entrants

Threat of new entrants - Impact of key factors in 2025 and 2030

7.5 Threat of substitutes

Threat of substitutes - Impact of key factors in 2025 and 2030

7.6 Threat of rivalry

Threat of rivalry - Impact of key factors in 2025 and 2030

7.7 Market condition

Chart on Market condition - Five forces 2025 and 2030

8. Market Segmentation by Application

8.1 Market segments

Chart on Application - Market share 2025-2030 (%)
Data Table on Application - Market share 2025-2030 (%)

8.2 Comparison by Application

Chart on Comparison by Application
Data Table on Comparison by Application

8.3 Transport - Market size and forecast 2025-2030

Chart on Transport - Market size and forecast 2025-2030 ($ million)
Data Table on Transport - Market size and forecast 2025-2030 ($ million)
Chart on Transport - Year-over-year growth 2025-2030 (%)
Data Table on Transport - Year-over-year growth 2025-2030 (%)

8.4 Stationary - Market size and forecast 2025-2030

Chart on Stationary - Market size and forecast 2025-2030 ($ million)
Data Table on Stationary - Market size and forecast 2025-2030 ($ million)
Chart on Stationary - Year-over-year growth 2025-2030 (%)
Data Table on Stationary - Year-over-year growth 2025-2030 (%)

8.5 Portable - Market size and forecast 2025-2030

Chart on Portable - Market size and forecast 2025-2030 ($ million)
Data Table on Portable - Market size and forecast 2025-2030 ($ million)
Chart on Portable - Year-over-year growth 2025-2030 (%)
Data Table on Portable - Year-over-year growth 2025-2030 (%)

8.6 Market opportunity by Application

Market opportunity by Application ($ million)
Data Table on Market opportunity by Application ($ million)

9. Market Segmentation by Technology

9.1 Market segments

Chart on Technology - Market share 2025-2030 (%)
Data Table on Technology - Market share 2025-2030 (%)

9.2 Comparison by Technology

Chart on Comparison by Technology
Data Table on Comparison by Technology

9.3 PEMFC - Market size and forecast 2025-2030

Chart on PEMFC - Market size and forecast 2025-2030 ($ million)
Data Table on PEMFC - Market size and forecast 2025-2030 ($ million)
Chart on PEMFC - Year-over-year growth 2025-2030 (%)
Data Table on PEMFC - Year-over-year growth 2025-2030 (%)

9.4 SOFC - Market size and forecast 2025-2030

Chart on SOFC - Market size and forecast 2025-2030 ($ million)
Data Table on SOFC - Market size and forecast 2025-2030 ($ million)
Chart on SOFC - Year-over-year growth 2025-2030 (%)
Data Table on SOFC - Year-over-year growth 2025-2030 (%)

9.5 AFC - Market size and forecast 2025-2030

Chart on AFC - Market size and forecast 2025-2030 ($ million)
Data Table on AFC - Market size and forecast 2025-2030 ($ million)
Chart on AFC - Year-over-year growth 2025-2030 (%)
Data Table on AFC - Year-over-year growth 2025-2030 (%)

9.6 PAFC - Market size and forecast 2025-2030

Chart on PAFC - Market size and forecast 2025-2030 ($ million)
Data Table on PAFC - Market size and forecast 2025-2030 ($ million)
Chart on PAFC - Year-over-year growth 2025-2030 (%)
Data Table on PAFC - Year-over-year growth 2025-2030 (%)

9.7 Market opportunity by Technology

Market opportunity by Technology ($ million)
Data Table on Market opportunity by Technology ($ million)

10. Market Segmentation by Type

10.1 Market segments

Chart on Type - Market share 2025-2030 (%)
Data Table on Type - Market share 2025-2030 (%)

10.2 Comparison by Type

Chart on Comparison by Type
Data Table on Comparison by Type

10.3 Water cooled - Market size and forecast 2025-2030

Chart on Water cooled - Market size and forecast 2025-2030 ($ million)
Data Table on Water cooled - Market size and forecast 2025-2030 ($ million)
Chart on Water cooled - Year-over-year growth 2025-2030 (%)
Data Table on Water cooled - Year-over-year growth 2025-2030 (%)

10.4 Air cooled - Market size and forecast 2025-2030

Chart on Air cooled - Market size and forecast 2025-2030 ($ million)
Data Table on Air cooled - Market size and forecast 2025-2030 ($ million)
Chart on Air cooled - Year-over-year growth 2025-2030 (%)
Data Table on Air cooled - Year-over-year growth 2025-2030 (%)

10.5 Market opportunity by Type

Market opportunity by Type ($ million)
Data Table on Market opportunity by Type ($ million)

11. Customer Landscape

11.1 Customer landscape overview

Analysis of price sensitivity, lifecycle, customer purchase basket, adoption rates, and purchase criteria

12. Geographic Landscape

12.1 Geographic segmentation

Chart on Market share by geography 2025-2030 (%)
Data Table on Market share by geography 2025-2030 (%)

12.2 Geographic comparison

Chart on Geographic comparison
Data Table on Geographic comparison

12.3 North America - Market size and forecast 2025-2030

Chart on North America - Market size and forecast 2025-2030 ($ million)
Data Table on North America - Market size and forecast 2025-2030 ($ million)
Chart on North America - Year-over-year growth 2025-2030 (%)
Data Table on North America - Year-over-year growth 2025-2030 (%)
Chart on Regional Comparison - North America
Data Table on Regional Comparison - North America

12.3.1 US - Market size and forecast 2025-2030

Chart on US - Market size and forecast 2025-2030 ($ million)
Data Table on US - Market size and forecast 2025-2030 ($ million)
Chart on US - Year-over-year growth 2025-2030 (%)
Data Table on US - Year-over-year growth 2025-2030 (%)

12.3.2 Canada - Market size and forecast 2025-2030

Chart on Canada - Market size and forecast 2025-2030 ($ million)
Data Table on Canada - Market size and forecast 2025-2030 ($ million)
Chart on Canada - Year-over-year growth 2025-2030 (%)
Data Table on Canada - Year-over-year growth 2025-2030 (%)

12.3.3 Mexico - Market size and forecast 2025-2030

Chart on Mexico - Market size and forecast 2025-2030 ($ million)
Data Table on Mexico - Market size and forecast 2025-2030 ($ million)
Chart on Mexico - Year-over-year growth 2025-2030 (%)
Data Table on Mexico - Year-over-year growth 2025-2030 (%)

12.4 APAC - Market size and forecast 2025-2030

Chart on APAC - Market size and forecast 2025-2030 ($ million)
Data Table on APAC - Market size and forecast 2025-2030 ($ million)
Chart on APAC - Year-over-year growth 2025-2030 (%)
Data Table on APAC - Year-over-year growth 2025-2030 (%)
Chart on Regional Comparison - APAC
Data Table on Regional Comparison - APAC

12.4.1 China - Market size and forecast 2025-2030

Chart on China - Market size and forecast 2025-2030 ($ million)
Data Table on China - Market size and forecast 2025-2030 ($ million)
Chart on China - Year-over-year growth 2025-2030 (%)
Data Table on China - Year-over-year growth 2025-2030 (%)

12.4.2 Japan - Market size and forecast 2025-2030

Chart on Japan - Market size and forecast 2025-2030 ($ million)
Data Table on Japan - Market size and forecast 2025-2030 ($ million)
Chart on Japan - Year-over-year growth 2025-2030 (%)
Data Table on Japan - Year-over-year growth 2025-2030 (%)

12.4.3 India - Market size and forecast 2025-2030

Chart on India - Market size and forecast 2025-2030 ($ million)
Data Table on India - Market size and forecast 2025-2030 ($ million)
Chart on India - Year-over-year growth 2025-2030 (%)
Data Table on India - Year-over-year growth 2025-2030 (%)

12.4.4 South Korea - Market size and forecast 2025-2030

Chart on South Korea - Market size and forecast 2025-2030 ($ million)
Data Table on South Korea - Market size and forecast 2025-2030 ($ million)
Chart on South Korea - Year-over-year growth 2025-2030 (%)
Data Table on South Korea - Year-over-year growth 2025-2030 (%)

12.4.5 Australia - Market size and forecast 2025-2030

Chart on Australia - Market size and forecast 2025-2030 ($ million)
Data Table on Australia - Market size and forecast 2025-2030 ($ million)
Chart on Australia - Year-over-year growth 2025-2030 (%)
Data Table on Australia - Year-over-year growth 2025-2030 (%)

12.4.6 Indonesia - Market size and forecast 2025-2030

Chart on Indonesia - Market size and forecast 2025-2030 ($ million)
Data Table on Indonesia - Market size and forecast 2025-2030 ($ million)
Chart on Indonesia - Year-over-year growth 2025-2030 (%)
Data Table on Indonesia - Year-over-year growth 2025-2030 (%)

12.5 Europe - Market size and forecast 2025-2030

Chart on Europe - Market size and forecast 2025-2030 ($ million)
Data Table on Europe - Market size and forecast 2025-2030 ($ million)
Chart on Europe - Year-over-year growth 2025-2030 (%)
Data Table on Europe - Year-over-year growth 2025-2030 (%)
Chart on Regional Comparison - Europe
Data Table on Regional Comparison - Europe

12.5.1 Germany - Market size and forecast 2025-2030

Chart on Germany - Market size and forecast 2025-2030 ($ million)
Data Table on Germany - Market size and forecast 2025-2030 ($ million)
Chart on Germany - Year-over-year growth 2025-2030 (%)
Data Table on Germany - Year-over-year growth 2025-2030 (%)

12.5.2 UK - Market size and forecast 2025-2030

Chart on UK - Market size and forecast 2025-2030 ($ million)
Data Table on UK - Market size and forecast 2025-2030 ($ million)
Chart on UK - Year-over-year growth 2025-2030 (%)
Data Table on UK - Year-over-year growth 2025-2030 (%)

12.5.3 France - Market size and forecast 2025-2030

Chart on France - Market size and forecast 2025-2030 ($ million)
Data Table on France - Market size and forecast 2025-2030 ($ million)
Chart on France - Year-over-year growth 2025-2030 (%)
Data Table on France - Year-over-year growth 2025-2030 (%)

12.5.4 Italy - Market size and forecast 2025-2030

Chart on Italy - Market size and forecast 2025-2030 ($ million)
Data Table on Italy - Market size and forecast 2025-2030 ($ million)
Chart on Italy - Year-over-year growth 2025-2030 (%)
Data Table on Italy - Year-over-year growth 2025-2030 (%)

12.5.5 Spain - Market size and forecast 2025-2030

Chart on Spain - Market size and forecast 2025-2030 ($ million)
Data Table on Spain - Market size and forecast 2025-2030 ($ million)
Chart on Spain - Year-over-year growth 2025-2030 (%)
Data Table on Spain - Year-over-year growth 2025-2030 (%)

12.5.6 The Netherlands - Market size and forecast 2025-2030

Chart on The Netherlands - Market size and forecast 2025-2030 ($ million)
Data Table on The Netherlands - Market size and forecast 2025-2030 ($ million)
Chart on The Netherlands - Year-over-year growth 2025-2030 (%)
Data Table on The Netherlands - Year-over-year growth 2025-2030 (%)

12.6 Middle East and Africa - Market size and forecast 2025-2030

Chart on Middle East and Africa - Market size and forecast 2025-2030 ($ million)
Data Table on Middle East and Africa - Market size and forecast 2025-2030 ($ million)
Chart on Middle East and Africa - Year-over-year growth 2025-2030 (%)
Data Table on Middle East and Africa - Year-over-year growth 2025-2030 (%)
Chart on Regional Comparison - Middle East and Africa
Data Table on Regional Comparison - Middle East and Africa

12.6.1 Saudi Arabia - Market size and forecast 2025-2030

Chart on Saudi Arabia - Market size and forecast 2025-2030 ($ million)
Data Table on Saudi Arabia - Market size and forecast 2025-2030 ($ million)
Chart on Saudi Arabia - Year-over-year growth 2025-2030 (%)
Data Table on Saudi Arabia - Year-over-year growth 2025-2030 (%)

12.6.2 UAE - Market size and forecast 2025-2030

Chart on UAE - Market size and forecast 2025-2030 ($ million)
Data Table on UAE - Market size and forecast 2025-2030 ($ million)
Chart on UAE - Year-over-year growth 2025-2030 (%)
Data Table on UAE - Year-over-year growth 2025-2030 (%)

12.6.3 South Africa - Market size and forecast 2025-2030

Chart on South Africa - Market size and forecast 2025-2030 ($ million)
Data Table on South Africa - Market size and forecast 2025-2030 ($ million)
Chart on South Africa - Year-over-year growth 2025-2030 (%)
Data Table on South Africa - Year-over-year growth 2025-2030 (%)

12.6.4 Turkey - Market size and forecast 2025-2030

Chart on Turkey - Market size and forecast 2025-2030 ($ million)
Data Table on Turkey - Market size and forecast 2025-2030 ($ million)
Chart on Turkey - Year-over-year growth 2025-2030 (%)
Data Table on Turkey - Year-over-year growth 2025-2030 (%)

12.6.5 Israel - Market size and forecast 2025-2030

Chart on Israel - Market size and forecast 2025-2030 ($ million)
Data Table on Israel - Market size and forecast 2025-2030 ($ million)
Chart on Israel - Year-over-year growth 2025-2030 (%)
Data Table on Israel - Year-over-year growth 2025-2030 (%)

12.7 South America - Market size and forecast 2025-2030

Chart on South America - Market size and forecast 2025-2030 ($ million)
Data Table on South America - Market size and forecast 2025-2030 ($ million)
Chart on South America - Year-over-year growth 2025-2030 (%)
Data Table on South America - Year-over-year growth 2025-2030 (%)
Chart on Regional Comparison - South America
Data Table on Regional Comparison - South America

12.7.1 Brazil - Market size and forecast 2025-2030

Chart on Brazil - Market size and forecast 2025-2030 ($ million)
Data Table on Brazil - Market size and forecast 2025-2030 ($ million)
Chart on Brazil - Year-over-year growth 2025-2030 (%)
Data Table on Brazil - Year-over-year growth 2025-2030 (%)

12.7.2 Argentina - Market size and forecast 2025-2030

Chart on Argentina - Market size and forecast 2025-2030 ($ million)
Data Table on Argentina - Market size and forecast 2025-2030 ($ million)
Chart on Argentina - Year-over-year growth 2025-2030 (%)
Data Table on Argentina - Year-over-year growth 2025-2030 (%)

12.7.3 Chile - Market size and forecast 2025-2030

Chart on Chile - Market size and forecast 2025-2030 ($ million)
Data Table on Chile - Market size and forecast 2025-2030 ($ million)
Chart on Chile - Year-over-year growth 2025-2030 (%)
Data Table on Chile - Year-over-year growth 2025-2030 (%)

12.8 Market opportunity by geography

Market opportunity by geography ($ million)
Data Tables on Market opportunity by geography ($ million)

13. Drivers, Challenges, and Opportunity

13.1 Market drivers

Accelerating decarbonization policies and mandates
Strengthening global green hydrogen supply chains
Heavy transport electrification drives stack growth

13.2 Market challenges

Expensive component materials impede market scaling
Deficient infrastructure restricts fuel cell deployment
Battery competition creates severe market friction

13.3 Impact of drivers and challenges

Impact of drivers and challenges in 2025 and 2030

13.4 Market opportunities

Expanding application in maritime transportation systems
Manufacturing innovations lowering overall stack costs
Growing integration in off grid microgrid networks

14. Competitive Landscape

14.1 Overview

14.2

Overview on criticality of inputs and factors of differentiation

14.3 Landscape disruption

Overview on factors of disruption

14.4 Industry risks

Impact of key risks on business

15. Competitive Analysis

15.1 Companies profiled

Companies covered

15.2 Company ranking index

15.3 Market positioning of companies

Matrix on companies position and classification

15.4 Accelera Zero

Accelera Zero - Overview
Accelera Zero - Product / Service
Accelera Zero - Key offerings
SWOT

15.5 Ballard Power Systems Inc.

Ballard Power Systems Inc. - Overview
Ballard Power Systems Inc. - Business segments
Ballard Power Systems Inc. - Key offerings
Ballard Power Systems Inc. - Segment focus
SWOT

15.6 Beijing SinoHytec Co. Ltd.

Beijing SinoHytec Co. Ltd. - Overview
Beijing SinoHytec Co. Ltd. - Product / Service
Beijing SinoHytec Co. Ltd. - Key offerings
SWOT

15.7 Bloom Energy Corp.a

Bloom Energy Corp.a - Overview
Bloom Energy Corp.a - Product / Service
Bloom Energy Corp.a - Key news
Bloom Energy Corp.a - Key offerings
SWOT

15.8 Horizon Fuel Cell Technologies

Horizon Fuel Cell Technologies - Overview
Horizon Fuel Cell Technologies - Product / Service
Horizon Fuel Cell Technologies - Key offerings
SWOT

15.9 Intelligent Energy Ltd.

Intelligent Energy Ltd. - Overview
Intelligent Energy Ltd. - Product / Service
Intelligent Energy Ltd. - Key offerings
SWOT

15.10 Nedstack Fuel Cell Technology

Nedstack Fuel Cell Technology - Overview
Nedstack Fuel Cell Technology - Product / Service
Nedstack Fuel Cell Technology - Key offerings
SWOT

15.11 Nuvera Fuel Cells LLC

Nuvera Fuel Cells LLC - Overview
Nuvera Fuel Cells LLC - Product / Service
Nuvera Fuel Cells LLC - Key offerings
SWOT

15.12 Plug Power Inc.

Plug Power Inc. - Overview
Plug Power Inc. - Product / Service
Plug Power Inc. - Key offerings
SWOT

15.13 PowerCell Sweden AB

PowerCell Sweden AB - Overview
PowerCell Sweden AB - Product / Service
PowerCell Sweden AB - Key offerings
SWOT

15.14 Proton Motor Power Systems PLC

Proton Motor Power Systems PLC - Overview
Proton Motor Power Systems PLC - Product / Service
Proton Motor Power Systems PLC - Key offerings
SWOT

15.15 REFIRE Group

REFIRE Group - Overview
REFIRE Group - Product / Service
REFIRE Group - Key offerings
SWOT

15.16 Robert Bosch GmbH

Robert Bosch GmbH - Overview
Robert Bosch GmbH - Product / Service
Robert Bosch GmbH - Key offerings
SWOT

15.17 SFC Energy AG

SFC Energy AG - Overview
SFC Energy AG - Business segments
SFC Energy AG - Key offerings
SFC Energy AG - Segment focus
SWOT

15.18 Symbio SAS

Symbio SAS - Overview
Symbio SAS - Product / Service
Symbio SAS - Key offerings
SWOT

16. Appendix

16.1 Scope of the report

Market definition
Objectives
Notes and caveats

16.2 Inclusions and exclusions checklist

Inclusions checklist
Exclusions checklist

16.3 Currency conversion rates for US$

16.4 Research methodology

16.5 Data procurement

Information sources

16.6 Data validation

16.7 Validation techniques employed for market sizing

16.8 Data synthesis

16.9 360 degree market analysis

16.10 List of abbreviations

Research Methodology

Technavio presents a detailed picture of the market by way of study, synthesis, and summation of data from multiple sources. The analysts have presented the various facets of the market with a particular focus on identifying the key industry influencers. The data thus presented is comprehensive, reliable, and the result of extensive research, both primary and secondary.

INFORMATION SOURCES

Primary sources

  • Manufacturers and suppliers
  • Channel partners
  • Industry experts
  • Strategic decision makers

Secondary sources

  • Industry journals and periodicals
  • Government data
  • Financial reports of key industry players
  • Historical data
  • Press releases

DATA ANALYSIS

Data Synthesis

  • Collation of data
  • Estimation of key figures
  • Analysis of derived insights

Data Validation

  • Triangulation with data models
  • Reference against proprietary databases
  • Corroboration with industry experts

REPORT WRITING

Qualitative

  • Market drivers
  • Market challenges
  • Market trends
  • Five forces analysis

Quantitative

  • Market size and forecast
  • Market segmentation
  • Geographical insights
  • Competitive landscape

Interested in this report?

Get your sample now to see our research methodology and insights!

Download Now

Frequently Asked Questions

Hydrogen Fuel Cell Stacks market growth will increase by USD 1052.4 million during 2026-2030.

The Hydrogen Fuel Cell Stacks market is expected to grow at a CAGR of 22.5% during 2026-2030.

Hydrogen Fuel Cell Stacks market is segmented by Application (Transport, Stationary, Portable) Technology (PEMFC, SOFC, AFC, PAFC) Type (Water cooled, Air cooled)

Accelera Zero, Ballard Power Systems Inc., Beijing SinoHytec Co. Ltd., Bloom Energy Corp.a, Bramble Energy Ltd., Cellcentric GmbH and Co. KG, Ceres Power Holdings plc, Doosan Fuel Cell Co. Ltd., EKPO Fuel Cell Technologies GmbH, Elcogen AS, Horizon Fuel Cell Technologies, Intelligent Energy Ltd., Nedstack Fuel Cell Technology, Nuvera Fuel Cells LLC, Plug Power Inc., PowerCell Sweden AB, Proton Motor Power Systems PLC, REFIRE Group, Robert Bosch GmbH, SFC Energy AG, Symbio SAS are a few of the key vendors in the Hydrogen Fuel Cell Stacks market.

North America will register the highest growth rate of 38.9% among the other regions. Therefore, the Hydrogen Fuel Cell Stacks market in North America is expected to garner significant business opportunities for the vendors during the forecast period.

US, Canada, Mexico, China, Japan, India, South Korea, Australia, Indonesia, Germany, UK, France, Italy, Spain, The Netherlands, Saudi Arabia, UAE, South Africa, Turkey, Israel, Brazil, Argentina, Chile

  • Accelerating decarbonization policies and mandates is the driving factor this market.

The Hydrogen Fuel Cell Stacks market vendors should focus on grabbing business opportunities from the Application segment as it accounted for the largest market share in the base year.
RIA - Research AI Assistant
Ask RIA
