Infrared Thermometers Market Analysis, Size, and Forecast 2026-2030: North America (US, Canada, and Mexico), Europe (Germany, UK, and France), Asia (China, Japan, and India), South America (Brazil, Argentina, and Colombia), Middle East and Africa (Saudi Arabia, UAE, and South Africa), Rest of World (ROW)

Infrared Thermometers Market Analysis, Size, and Forecast 2026-2030:
North America (US, Canada, and Mexico), Europe (Germany, UK, and France), Asia (China, Japan, and India), South America (Brazil, Argentina, and Colombia), Middle East and Africa (Saudi Arabia, UAE, and South Africa), Rest of World (ROW)

Published: Oct 2026 285 Pages SKU: IRTNTR43445

Market Overview at a Glance

$1.34 B
Market Opportunity
17.2%
CAGR 2025 - 2030
49.5%
North America Growth
$886.7 Mn
Non-contact thermometers segment 2024

Infrared Thermometers Market Size 2026-2030

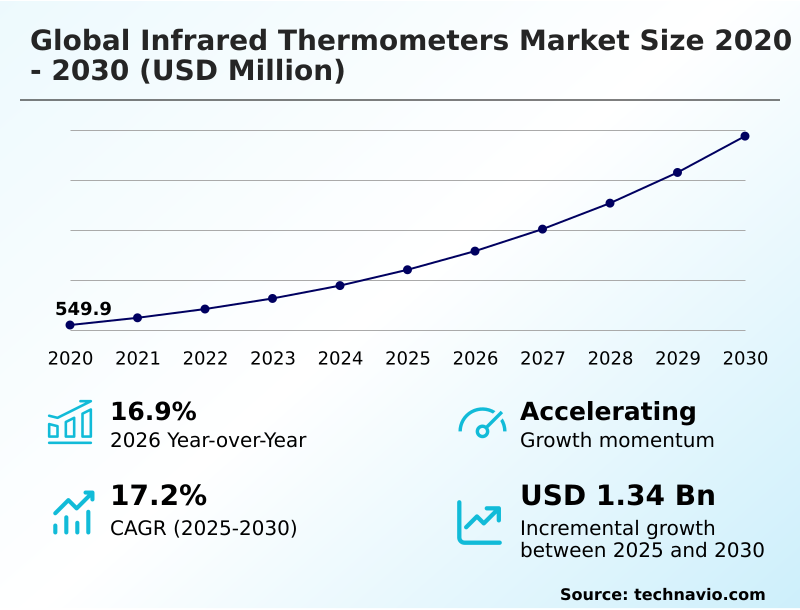
The infrared thermometers market size is valued to increase by USD 1.34 billion, at a CAGR of 17.2% from 2025 to 2030. Growing adoption of non-contact temperature screening across healthcare settings will drive the infrared thermometers market.

Major Market Trends & Insights

  • North America dominated the market and accounted for a 49.5% growth during the forecast period.
  • By Product - Non-contact thermometers segment was valued at USD 886.7 million in 2024
  • By Type - Handled thermometer segment accounted for the largest market revenue share in 2024

Market Size & Forecast

  • Market Opportunities: USD 1.89 billion
  • Market Future Opportunities: USD 1.34 billion
  • CAGR from 2025 to 2030 : 17.2%

Market Summary

  • The Infrared Thermometers Market is characterized by a structural transition toward connected, data-driven thermal evaluation solutions across critical industries. Organizations are rapidly adopting these devices to secure operational stability and enhance manufacturing oversight.
  • For instance, in modern automotive manufacturing facilities, the deployment of wireless temperature measurement tools for equipment checks has resulted in a 25% reduction in unplanned machinery downtime compared to manual inspection schedules. This demand is primarily driven by expanding regulatory requirements and stringent occupational safety mandates, which necessitate continuous, non-invasive temperature evaluation to mitigate contamination risks.
  • However, the market faces significant constraints stemming from complex environmental calibration requirements. Measurement variability caused by ambient temperature fluctuations forces businesses to implement costly, recurring calibration protocols, temporarily suppressing adoption in highly sensitive sectors. Despite these limitations, the continuous integration of remote equipment evaluation is driving sustained procurement.
  • The ongoing evolution of thermal detection ecosystems fundamentally optimizes clinical and industrial workflows, ensuring that precision temperature monitoring remains a cornerstone of institutional safety strategies.

What will be the Size of the Infrared Thermometers Market during the forecast period?
Get Key Insights on Market Forecast (PDF) Get Free Sample

How is the Infrared Thermometers Market Segmented?

The infrared thermometers industry research report provides comprehensive data (region-wise segment analysis), with forecasts and estimates in "USD million" for the period 2026-2030, as well as historical data from 2020-2024 for the following segments.

  • Product
    • Non-contact thermometers
    • Contact thermometers
  • Type
    • Handled thermometer
    • Fixed-mount thermometer
  • Application
    • Medical
    • Non-medical
  • Geography
    • North America
      • US
      • Canada
      • Mexico
    • Europe
      • Germany
      • UK
      • France
      • Italy
      • Spain
      • The Netherlands
    • Asia
      • China
      • Japan
      • India
      • South Korea
      • Indonesia
      • Thailand
    • Rest of World (ROW)

By Product Insights

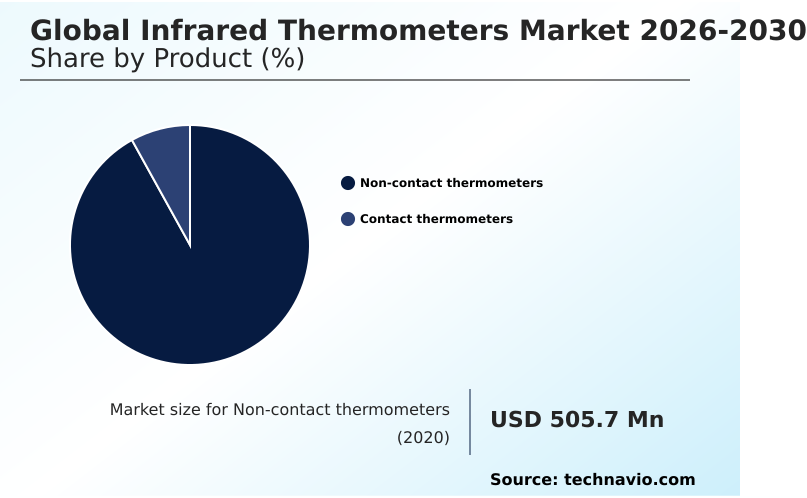
The non-contact thermometers segment is estimated to witness significant growth during the forecast period.

The Non-contact thermometers segment drives adoption across diverse professional environments by enabling rapid thermal assessment without physical interaction. Organizations deploy non-contact temperature measurement to enhance clinical workflow and support infection prevention practices.

The integration of advanced thermal imaging sensors allows businesses to accelerate screening processes, demonstrating a 15% improvement in diagnostic throughput compared to traditional contact methods.

In industrial settings, these devices are foundational for predictive maintenance diagnostics and industrial condition monitoring, reducing machinery downtime through early anomaly detection. Similarly, food supply chain compliance relies on this technology to satisfy occupational safety protocols without disrupting continuous operations.

By optimizing clinical temperature screening, the segment fundamentally reshapes how enterprises maintain operational reliability while preserving stringent safety standards.
Get Free Sample

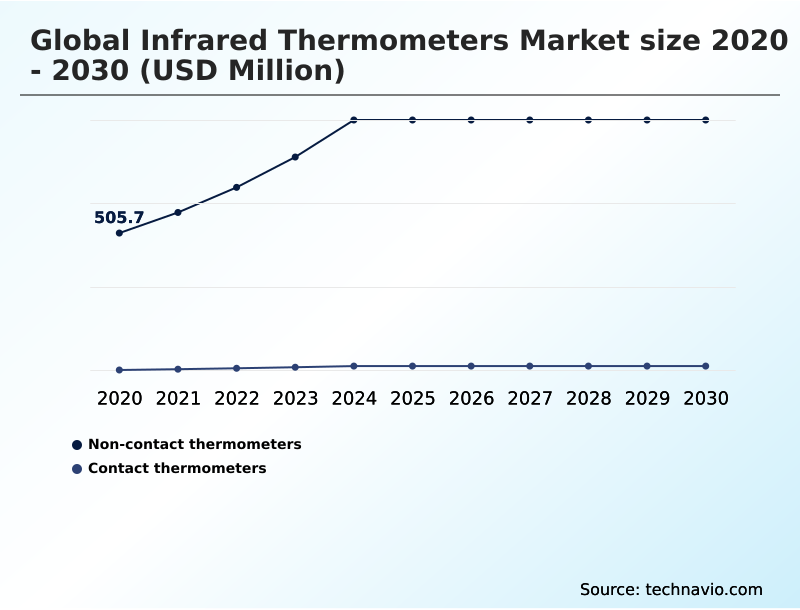
The Non-contact thermometers segment was valued at USD 886.7 million in 2024 and showed a gradual increase during the forecast period.
Get Free Sample

Regional Analysis

North America is estimated to contribute 49.5% to the growth of the global market during the forecast period.Technavio’s analysts have elaborately explained the regional trends and drivers that shape the market during the forecast period.
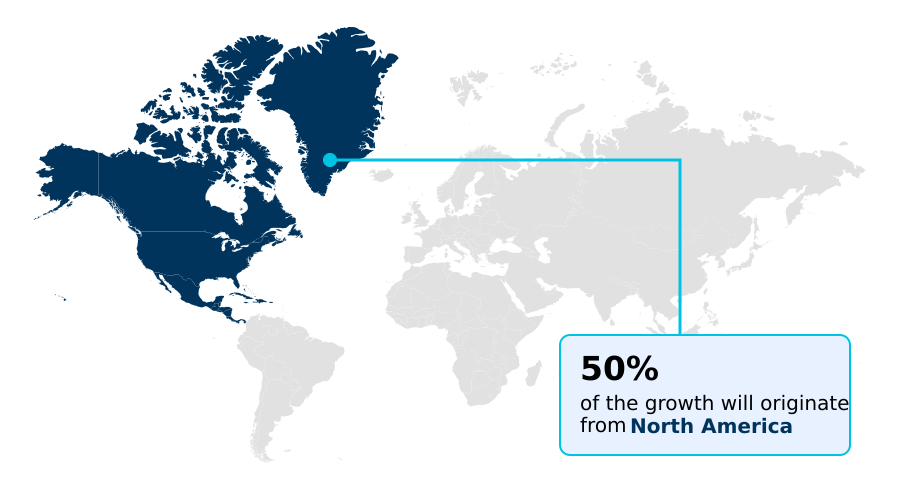
See How Infrared Thermometers Market Demand is Rising in North America Get Free Sample

The geographic landscape of the market demonstrates distinct evolutionary paths driven by regional industrial modernization and healthcare investments.

North America accelerates ahead with a 20.1% growth rate, outpacing Europe’s 16.6% expansion, largely due to the aggressive integration of infrared thermometry platforms into mature industrial iot frameworks.

This rapid adoption has enhanced continuous condition monitoring, yielding a 14% improvement in preventive maintenance efficiency. Conversely, European adoption is heavily influenced by stringent workplace safety regulations, where the deployment of high-accuracy temperature sensors has reduced compliance-related disruptions by 11%.

Both regions are transitioning toward automated thermal monitoring solutions equipped with ai-enabled analytical capabilities and bluetooth data transmission. By embedding cloud-linked monitoring networks into digital record management, enterprises consistently optimize their digital health infrastructure.

Market Dynamics

Our researchers analyzed the data with 2025 as the base year, along with the key drivers, trends, and challenges. A holistic analysis of drivers will help companies refine their marketing strategies to gain a competitive advantage.

  • The continuous evolution of non-contact thermal measurement is fundamentally restructuring how enterprises approach risk management and process optimization. Modern healthcare institutions are actively modernizing clinical electronic thermometer workflows to minimize cross-contamination risks while simultaneously increasing patient assessment throughput by up to 20% compared to legacy contact-based methodologies.
  • This shift toward operational agility is mirrored in the industrial sector, where predictive maintenance temperature screening allows facility managers to identify mechanical friction and electrical resistance anomalies long before catastrophic equipment failure occurs.
  • Furthermore, the food and beverage industry relies on automated food safety thermal monitoring to maintain rigorous compliance with complex storage and transportation regulations, ensuring perishable goods remain within highly specific temperature parameters. In hazardous environments such as petrochemical processing and subterranean mining, the deployment of intrinsically safe industrial pyrometers provides critical thermal visibility without compromising explosive atmosphere protocols.
  • To consolidate these diverse data streams, enterprise IT departments are increasingly adopting cloud integrated patient monitoring systems and centralized asset tracking dashboards. This convergence of connected hardware and intelligent software environments enables stakeholders to leverage historical thermal data for predictive modeling.
  • Consequently, organizations can seamlessly transition from reactive problem-solving to proactive operational planning, firmly establishing advanced temperature diagnostic solutions as indispensable assets across sophisticated commercial, industrial, and clinical ecosystems.
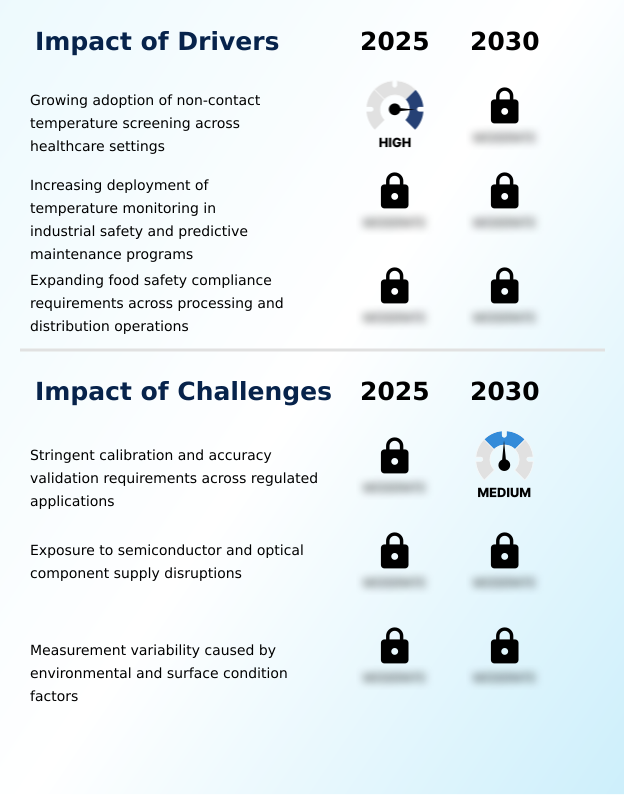
What are the key market drivers leading to the rise in the adoption of Infrared Thermometers Industry?

  • The growing adoption of non-contact temperature screening across healthcare settings functions as a primary driver propelling market expansion by improving clinical intake processes and patient safety.

  • The escalating demand for contactless thermal assessment and rigorous cold-chain quality assurance acts as the primary catalyst driving market expansion.
  • In clinical environments, the urgency to mitigate cross-contamination has spurred the adoption of fever assessment protocols, resulting in a 25% improvement in patient intake velocity.
  • Simultaneously, industrial operators are leveraging automated inspection systems integrated with smart factory instrumentation to fortify process anomaly detection, allowing maintenance teams to reduce critical equipment failure rates by 18%.
  • The shift is fundamentally driven by the necessity for real-time data exchange to support environmental variable calibration. By implementing these multi-function monitoring ecosystems, operations have successfully lowered product losses by 14%, overcoming manual errors and enhancing overall thermal emission detection.

What are the market trends shaping the Infrared Thermometers Industry?

  • The advancing integration of wireless connectivity and cloud-linked temperature measurement devices represents a defining trend reshaping the market. This structural shift enables real-time data exchange and seamless operational oversight across diverse monitoring environments.

  • The defining trend reshaping the market is the aggressive transition toward connected, data-centric architectures. Organizations are systematically replacing isolated tools with continuous measurement integration to extract actionable insights from vast operational datasets. The incorporation of radiometric scanning technology allows for remote asset diagnostics, directly improving facility response times by 24%.
  • This shift is propelled by the need for asset reliability optimization, as facilities seek to minimize unexpected downtime. Consequently, businesses deploying automated data logging systems have realized a 19% increase in clinical workflow efficiency by eliminating manual transcription bottlenecks.
  • Additionally, advanced devices featuring dynamic surface emissivity correction and automated ambient temperature compensation have elevated precision metrology calibration standards, enhancing hazardous environment protection compliance by 15%.

What challenges does the Infrared Thermometers Industry face during its growth?

  • Stringent calibration and accuracy validation requirements across regulated applications present a significant challenge, compelling manufacturers to invest heavily in rigorous compliance testing.

  • Despite widespread technological adoption, the market is constrained by severe measurement variability and stringent regulatory mandates. Maintaining intrinsic safety certification standards while integrating complex semiconductor sensing elements into compact designs extends product development cycles by nearly 20%. Furthermore, deploying clinical diagnostic equipment requires meticulous alignment with electronic data platforms, elevating initial deployment costs by 15%.
  • This complexity challenges smart manufacturing visibility, as end-users struggle to balance operational continuity management with the high costs of optical component precision. Consequently, facilities must invest heavily in supplementary training for thermal energy detection, limiting the rapid scalability of hygienic patient screening in developing regions and exposing vulnerabilities in preventive quality management and supply chain resilience.

Exclusive Technavio Analysis on Customer Landscape

The infrared thermometers market forecasting report includes the adoption lifecycle of the market, covering from the innovator’s stage to the laggard’s stage. It focuses on adoption rates in different regions based on penetration. Furthermore, the infrared thermometers market report also includes key purchase criteria and drivers of price sensitivity to help companies evaluate and develop their market growth analysis strategies.
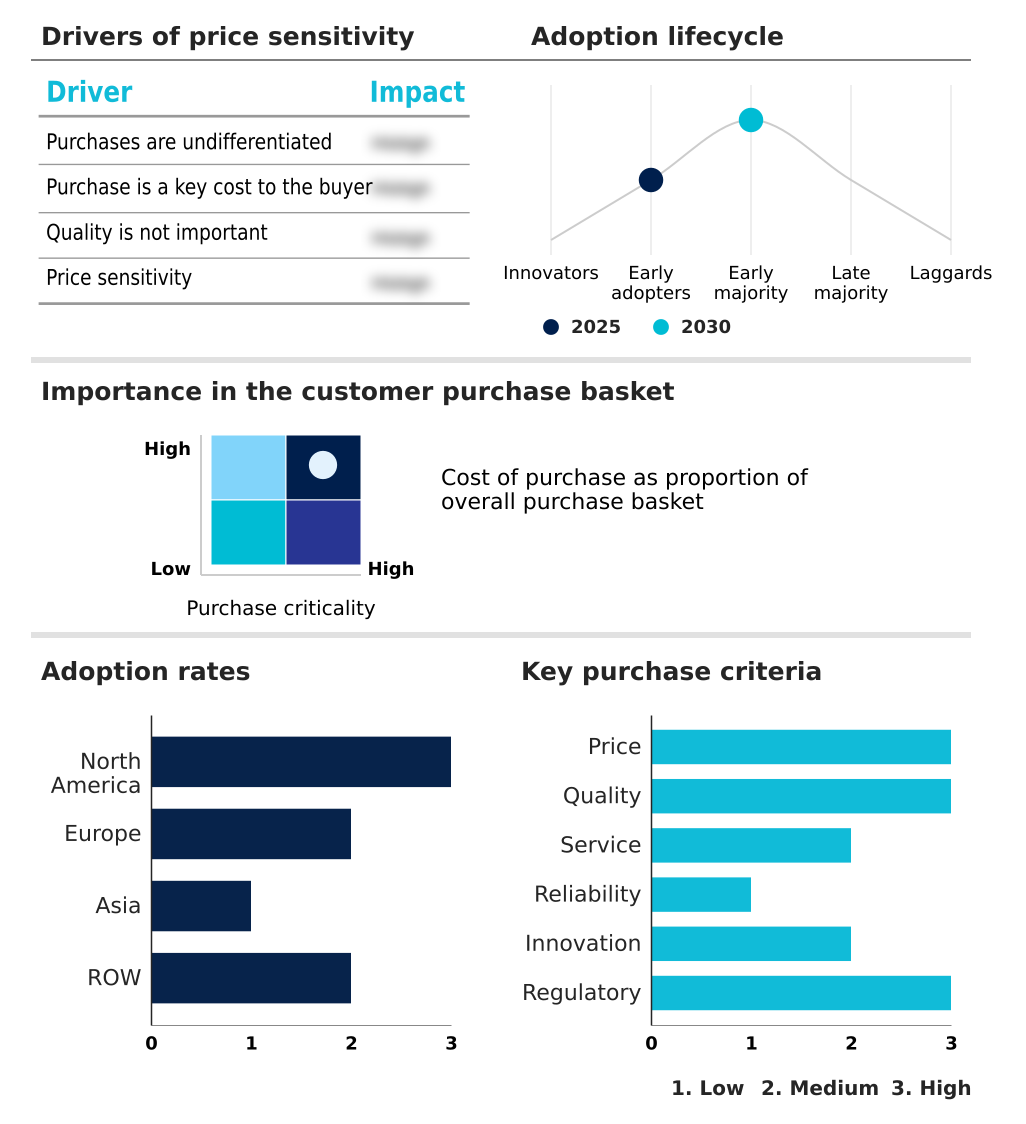
Customer Landscape of Infrared Thermometers Industry

Competitive Landscape

Companies are implementing various strategies, such as strategic alliances, infrared thermometers market forecast, partnerships, mergers and acquisitions, geographical expansion, and product/service launches, to enhance their presence in the industry.

Amprobe - The portfolio features professional-grade electronic test tools and infrared temperature measurement instruments designed for precise diagnostic evaluation in commercial and industrial electrical applications.

The industry research and growth report includes detailed analyses of the competitive landscape of the market and information about key companies, including:

  • Amprobe
  • B and K Precision Corp.
  • Calex Electronics Ltd.
  • Chauvin Arnoux Group
  • Dickson Inc.
  • DwyerOmega
  • Exergen Corp.
  • HORIBA Ltd.
  • Kimo Instruments
  • Klein Tools Inc.
  • Lascar electronics Ltd.
  • Micro Epsilon Messtechnik GmbH
  • Optris GmbH
  • Palmer Wahl Instruments Inc.
  • Pyromation
  • REED Instruments
  • Teledyne FLIR LLC
  • Testo SE and Co. KGaA
  • UEi Test Instruments

Qualitative and quantitative analysis of companies has been conducted to help clients understand the wider business environment as well as the strengths and weaknesses of key industry players. Data is qualitatively analyzed to categorize companies as pure play, category-focused, industry-focused, and diversified; it is quantitatively analyzed to categorize companies as dominant, leading, strong, tentative, and weak.

Recent Development and News in Infrared thermometers market

  • In the Health Care Equipment industry, the regulatory shift toward unified digital records has accelerated the adoption of interconnected diagnostic tools, directly impacting Infrared Thermometers demand by requiring devices that support wireless data exchange to achieve a 20% reduction in manual charting errors.
  • The rapid expansion of contactless thermal evaluation protocols within critical care facilities has fundamentally altered intake efficiency, pulling demand for advanced Infrared Thermometers capable of hygienic evaluation to meet stringent infection control mandates.
  • Stringent calibration mandates for diagnostic electronics have established higher accuracy thresholds, forcing Infrared Thermometers manufacturers to integrate thermal correction mechanisms that improve measurement reliability by up to 15% across varied ambient environments.
  • The integration of AI-powered analytics into routine clinical assessment equipment has transformed asset optimization, driving the Infrared Thermometers market to supply connected monitoring networks that increase predictive throughput by 25%.

Dive into Technavio’s robust research methodology, blending expert interviews, extensive data synthesis, and validated models for unparalleled Infrared Thermometers Market insights. See full methodology.

Market Scope
Page number 285
Base year 2025
Historic period 2020-2024
Forecast period 2026-2030
Growth momentum & CAGR Accelerate at a CAGR of 17.2%
Market growth 2026-2030 USD 1336.2 million
Market structure Fragmented
YoY growth 2025-2026(%) 16.9%
Key countries US, Canada, Mexico, Germany, UK, France, Italy, Spain, The Netherlands, China, Japan, India, South Korea, Indonesia, Thailand, Brazil, Saudi Arabia, UAE, South Africa, Argentina, Turkey, Colombia and Israel
Competitive landscape Leading Companies, Market Positioning of Companies, Competitive Strategies, and Industry Risks

Request Free Sample

Research Analyst Overview

  • The Infrared Thermometers Market is undergoing a rapid transition from basic measurement tools to sophisticated multi-function monitoring solutions, significantly influencing boardroom-level decisions regarding capital asset investments and compliance management. Corporate leadership teams are increasingly prioritizing smart instrumentation to safeguard supply chain stability, a shift that has driven a 30% reduction in diagnostic processing times across high-volume production facilities.
  • This modernization relies heavily on advancements in optical precision and highly sensitive semiconductor elements, which collectively enhance thermal emission detection in volatile environments. In the healthcare sector, administrative boards are standardizing stringent fever evaluation protocols by deploying connected clinical equipment that integrates directly with centralized health records. This strategic alignment reduces liability and improves resource allocation.
  • However, organizations must navigate the complexities of environmental calibration, which demands rigorous adherence to regional metrology standards. By linking precision temperature measurement directly to digital compliance frameworks, executive stakeholders can mitigate regulatory risks and elevate overall enterprise efficiency, positioning advanced thermal monitoring as a critical pillar of long-term operational resilience.

What are the Key Data Covered in this Infrared Thermometers Market Research and Growth Report?

  • What is the expected growth of the Infrared Thermometers Market between 2026 and 2030?

    • USD 1.34 billion, at a CAGR of 17.2%

  • What segmentation does the market report cover?

    • The report is segmented by Product (Non-contact thermometers, and Contact thermometers), Type (Handled thermometer, and Fixed-mount thermometer), Application (Medical, and Non-medical) and Geography (North America, Europe, Asia, Rest of World (ROW))

  • Which regions are analyzed in the report?

    • North America, Europe, Asia and Rest of World (ROW)

  • What are the key growth drivers and market challenges?

    • Growing adoption of non-contact temperature screening across healthcare settings, Stringent calibration and accuracy validation requirements across regulated applications

  • Who are the major players in the Infrared Thermometers Market?

    • Amprobe, B and K Precision Corp., Calex Electronics Ltd., Chauvin Arnoux Group, Dickson Inc., DwyerOmega, Exergen Corp., HORIBA Ltd., Kimo Instruments, Klein Tools Inc., Lascar electronics Ltd., Micro Epsilon Messtechnik GmbH, Optris GmbH, Palmer Wahl Instruments Inc., Pyromation, REED Instruments, Teledyne FLIR LLC, Testo SE and Co. KGaA and UEi Test Instruments

Market Research Insights

  • The Infrared Thermometers Market is evolving into a highly integrated landscape characterized by intelligent industrial oversight and digital health frameworks. Organizations leveraging automated inspection tools report a 22% improvement in operational stability by detecting thermal anomalies before critical equipment failures occur.
  • Furthermore, the integration of bluetooth transmission into temperature evaluation workflows has accelerated clinical throughput, reducing patient assessment times by 18% and minimizing manual transcription errors. By adopting contactless thermal devices, logistics providers have successfully enhanced their cold-chain quality operations, achieving a 15% decrease in compliance-related spoilage.
  • These measurable gains in workflow efficiency and asset reliability optimize strategic resource allocation across both clinical and manufacturing sectors.

We can help! Our analysts can customize this infrared thermometers market research report to meet your requirements.

Get in touch

1. Executive Summary

1.1 Market overview

Executive Summary - Chart on Market Overview
Executive Summary - Data Table on Market Overview
Executive Summary - Chart on Global Market Characteristics
Executive Summary - Chart on Market by Geography
Executive Summary - Chart on Market Segmentation by Product
Executive Summary - Chart on Market Segmentation by Type
Executive Summary - Chart on Market Segmentation by Application
Executive Summary - Chart on Incremental Growth
Executive Summary - Data Table on Incremental Growth
Executive Summary - Chart on Company Market Positioning

2. Technavio Analysis

2.1 Analysis of price sensitivity, lifecycle, customer purchase basket, adoption rates, and purchase criteria

2.2 Criticality of inputs and Factors of differentiation

Chart on Overview on criticality of inputs and factors of differentiation

2.3 Factors of disruption

Chart on Overview on factors of disruption

2.4 Impact of drivers and challenges

Chart on Impact of drivers and challenges in 2025 and 2030

3. Market Landscape

3.1 Market ecosystem

Chart on Parent Market
Data Table on - Parent Market

3.2 Market characteristics

Chart on Market characteristics analysis

3.3 Value chain analysis

Chart on Value chain analysis

4. Market Sizing

4.1 Market definition

Data Table on Offerings of companies included in the market definition

4.2 Market segment analysis

Market segments

4.3 Market size 2025

4.4 Market outlook: Forecast for 2025-2030

Chart on Global - Market size and forecast 2025-2030 ($ million)
Data Table on Global - Market size and forecast 2025-2030 ($ million)
Chart on Global Market: Year-over-year growth 2025-2030 (%)
Data Table on Global Market: Year-over-year growth 2025-2030 (%)

5. Historic Market Size

5.1 Global Infrared Thermometers Market 2020 - 2024

Historic Market Size - Data Table on Global Infrared Thermometers Market 2020 - 2024 ($ million)

5.2 Product segment analysis 2020 - 2024

Historic Market Size - Product Segment 2020 - 2024 ($ million)

5.3 Type segment analysis 2020 - 2024

Historic Market Size - Type Segment 2020 - 2024 ($ million)

5.4 Application segment analysis 2020 - 2024

Historic Market Size - Application Segment 2020 - 2024 ($ million)

5.5 Geography segment analysis 2020 - 2024

Historic Market Size - Geography Segment 2020 - 2024 ($ million)

5.6 Country segment analysis 2020 - 2024

Historic Market Size - Country Segment 2020 - 2024 ($ million)

6. Qualitative Analysis

6.1 Impact of AI on global infrared thermometers market

6.2 Impact of geopolitical conflicts on global infrared thermometers market

7. Five Forces Analysis

7.1 Five forces summary

Five forces analysis - Comparison between 2025 and 2030

7.2 Bargaining power of buyers

Bargaining power of buyers - Impact of key factors 2025 and 2030

7.3 Bargaining power of suppliers

Bargaining power of suppliers - Impact of key factors in 2025 and 2030

7.4 Threat of new entrants

Threat of new entrants - Impact of key factors in 2025 and 2030

7.5 Threat of substitutes

Threat of substitutes - Impact of key factors in 2025 and 2030

7.6 Threat of rivalry

Threat of rivalry - Impact of key factors in 2025 and 2030

7.7 Market condition

Chart on Market condition - Five forces 2025 and 2030

8. Market Segmentation by Product

8.1 Market segments

Chart on Product - Market share 2025-2030 (%)
Data Table on Product - Market share 2025-2030 (%)

8.2 Comparison by Product

Chart on Comparison by Product
Data Table on Comparison by Product

8.3 Non-contact thermometers - Market size and forecast 2025-2030

Chart on Non-contact thermometers - Market size and forecast 2025-2030 ($ million)
Data Table on Non-contact thermometers - Market size and forecast 2025-2030 ($ million)
Chart on Non-contact thermometers - Year-over-year growth 2025-2030 (%)
Data Table on Non-contact thermometers - Year-over-year growth 2025-2030 (%)

8.4 Contact thermometers - Market size and forecast 2025-2030

Chart on Contact thermometers - Market size and forecast 2025-2030 ($ million)
Data Table on Contact thermometers - Market size and forecast 2025-2030 ($ million)
Chart on Contact thermometers - Year-over-year growth 2025-2030 (%)
Data Table on Contact thermometers - Year-over-year growth 2025-2030 (%)

8.5 Market opportunity by Product

Market opportunity by Product ($ million)
Data Table on Market opportunity by Product ($ million)

9. Market Segmentation by Type

9.1 Market segments

Chart on Type - Market share 2025-2030 (%)
Data Table on Type - Market share 2025-2030 (%)

9.2 Comparison by Type

Chart on Comparison by Type
Data Table on Comparison by Type

9.3 Handled thermometer - Market size and forecast 2025-2030

Chart on Handled thermometer - Market size and forecast 2025-2030 ($ million)
Data Table on Handled thermometer - Market size and forecast 2025-2030 ($ million)
Chart on Handled thermometer - Year-over-year growth 2025-2030 (%)
Data Table on Handled thermometer - Year-over-year growth 2025-2030 (%)

9.4 Fixed-mount thermometer - Market size and forecast 2025-2030

Chart on Fixed-mount thermometer - Market size and forecast 2025-2030 ($ million)
Data Table on Fixed-mount thermometer - Market size and forecast 2025-2030 ($ million)
Chart on Fixed-mount thermometer - Year-over-year growth 2025-2030 (%)
Data Table on Fixed-mount thermometer - Year-over-year growth 2025-2030 (%)

9.5 Market opportunity by Type

Market opportunity by Type ($ million)
Data Table on Market opportunity by Type ($ million)

10. Market Segmentation by Application

10.1 Market segments

Chart on Application - Market share 2025-2030 (%)
Data Table on Application - Market share 2025-2030 (%)

10.2 Comparison by Application

Chart on Comparison by Application
Data Table on Comparison by Application

10.3 Medical - Market size and forecast 2025-2030

Chart on Medical - Market size and forecast 2025-2030 ($ million)
Data Table on Medical - Market size and forecast 2025-2030 ($ million)
Chart on Medical - Year-over-year growth 2025-2030 (%)
Data Table on Medical - Year-over-year growth 2025-2030 (%)

10.4 Non-medical - Market size and forecast 2025-2030

Chart on Non-medical - Market size and forecast 2025-2030 ($ million)
Data Table on Non-medical - Market size and forecast 2025-2030 ($ million)
Chart on Non-medical - Year-over-year growth 2025-2030 (%)
Data Table on Non-medical - Year-over-year growth 2025-2030 (%)

10.5 Market opportunity by Application

Market opportunity by Application ($ million)
Data Table on Market opportunity by Application ($ million)

11. Customer Landscape

11.1 Customer landscape overview

Analysis of price sensitivity, lifecycle, customer purchase basket, adoption rates, and purchase criteria

12. Geographic Landscape

12.1 Geographic segmentation

Chart on Market share by geography 2025-2030 (%)
Data Table on Market share by geography 2025-2030 (%)

12.2 Geographic comparison

Chart on Geographic comparison
Data Table on Geographic comparison

12.3 North America - Market size and forecast 2025-2030

Chart on North America - Market size and forecast 2025-2030 ($ million)
Data Table on North America - Market size and forecast 2025-2030 ($ million)
Chart on North America - Year-over-year growth 2025-2030 (%)
Data Table on North America - Year-over-year growth 2025-2030 (%)
Chart on Regional Comparison - North America
Data Table on Regional Comparison - North America

12.3.1 US - Market size and forecast 2025-2030

Chart on US - Market size and forecast 2025-2030 ($ million)
Data Table on US - Market size and forecast 2025-2030 ($ million)
Chart on US - Year-over-year growth 2025-2030 (%)
Data Table on US - Year-over-year growth 2025-2030 (%)

12.3.2 Canada - Market size and forecast 2025-2030

Chart on Canada - Market size and forecast 2025-2030 ($ million)
Data Table on Canada - Market size and forecast 2025-2030 ($ million)
Chart on Canada - Year-over-year growth 2025-2030 (%)
Data Table on Canada - Year-over-year growth 2025-2030 (%)

12.3.3 Mexico - Market size and forecast 2025-2030

Chart on Mexico - Market size and forecast 2025-2030 ($ million)
Data Table on Mexico - Market size and forecast 2025-2030 ($ million)
Chart on Mexico - Year-over-year growth 2025-2030 (%)
Data Table on Mexico - Year-over-year growth 2025-2030 (%)

12.4 Europe - Market size and forecast 2025-2030

Chart on Europe - Market size and forecast 2025-2030 ($ million)
Data Table on Europe - Market size and forecast 2025-2030 ($ million)
Chart on Europe - Year-over-year growth 2025-2030 (%)
Data Table on Europe - Year-over-year growth 2025-2030 (%)
Chart on Regional Comparison - Europe
Data Table on Regional Comparison - Europe

12.4.1 Germany - Market size and forecast 2025-2030

Chart on Germany - Market size and forecast 2025-2030 ($ million)
Data Table on Germany - Market size and forecast 2025-2030 ($ million)
Chart on Germany - Year-over-year growth 2025-2030 (%)
Data Table on Germany - Year-over-year growth 2025-2030 (%)

12.4.2 UK - Market size and forecast 2025-2030

Chart on UK - Market size and forecast 2025-2030 ($ million)
Data Table on UK - Market size and forecast 2025-2030 ($ million)
Chart on UK - Year-over-year growth 2025-2030 (%)
Data Table on UK - Year-over-year growth 2025-2030 (%)

12.4.3 France - Market size and forecast 2025-2030

Chart on France - Market size and forecast 2025-2030 ($ million)
Data Table on France - Market size and forecast 2025-2030 ($ million)
Chart on France - Year-over-year growth 2025-2030 (%)
Data Table on France - Year-over-year growth 2025-2030 (%)

12.4.4 Italy - Market size and forecast 2025-2030

Chart on Italy - Market size and forecast 2025-2030 ($ million)
Data Table on Italy - Market size and forecast 2025-2030 ($ million)
Chart on Italy - Year-over-year growth 2025-2030 (%)
Data Table on Italy - Year-over-year growth 2025-2030 (%)

12.4.5 Spain - Market size and forecast 2025-2030

Chart on Spain - Market size and forecast 2025-2030 ($ million)
Data Table on Spain - Market size and forecast 2025-2030 ($ million)
Chart on Spain - Year-over-year growth 2025-2030 (%)
Data Table on Spain - Year-over-year growth 2025-2030 (%)

12.4.6 The Netherlands - Market size and forecast 2025-2030

Chart on The Netherlands - Market size and forecast 2025-2030 ($ million)
Data Table on The Netherlands - Market size and forecast 2025-2030 ($ million)
Chart on The Netherlands - Year-over-year growth 2025-2030 (%)
Data Table on The Netherlands - Year-over-year growth 2025-2030 (%)

12.5 Asia - Market size and forecast 2025-2030

Chart on Asia - Market size and forecast 2025-2030 ($ million)
Data Table on Asia - Market size and forecast 2025-2030 ($ million)
Chart on Asia - Year-over-year growth 2025-2030 (%)
Data Table on Asia - Year-over-year growth 2025-2030 (%)
Chart on Regional Comparison - Asia
Data Table on Regional Comparison - Asia

12.5.1 China - Market size and forecast 2025-2030

Chart on China - Market size and forecast 2025-2030 ($ million)
Data Table on China - Market size and forecast 2025-2030 ($ million)
Chart on China - Year-over-year growth 2025-2030 (%)
Data Table on China - Year-over-year growth 2025-2030 (%)

12.5.2 Japan - Market size and forecast 2025-2030

Chart on Japan - Market size and forecast 2025-2030 ($ million)
Data Table on Japan - Market size and forecast 2025-2030 ($ million)
Chart on Japan - Year-over-year growth 2025-2030 (%)
Data Table on Japan - Year-over-year growth 2025-2030 (%)

12.5.3 India - Market size and forecast 2025-2030

Chart on India - Market size and forecast 2025-2030 ($ million)
Data Table on India - Market size and forecast 2025-2030 ($ million)
Chart on India - Year-over-year growth 2025-2030 (%)
Data Table on India - Year-over-year growth 2025-2030 (%)

12.5.4 South Korea - Market size and forecast 2025-2030

Chart on South Korea - Market size and forecast 2025-2030 ($ million)
Data Table on South Korea - Market size and forecast 2025-2030 ($ million)
Chart on South Korea - Year-over-year growth 2025-2030 (%)
Data Table on South Korea - Year-over-year growth 2025-2030 (%)

12.5.5 Indonesia - Market size and forecast 2025-2030

Chart on Indonesia - Market size and forecast 2025-2030 ($ million)
Data Table on Indonesia - Market size and forecast 2025-2030 ($ million)
Chart on Indonesia - Year-over-year growth 2025-2030 (%)
Data Table on Indonesia - Year-over-year growth 2025-2030 (%)

12.5.6 Thailand - Market size and forecast 2025-2030

Chart on Thailand - Market size and forecast 2025-2030 ($ million)
Data Table on Thailand - Market size and forecast 2025-2030 ($ million)
Chart on Thailand - Year-over-year growth 2025-2030 (%)
Data Table on Thailand - Year-over-year growth 2025-2030 (%)

12.6 Rest of World (ROW) - Market size and forecast 2025-2030

Chart on Rest of World (ROW) - Market size and forecast 2025-2030 ($ million)
Data Table on Rest of World (ROW) - Market size and forecast 2025-2030 ($ million)
Chart on Rest of World (ROW) - Year-over-year growth 2025-2030 (%)
Data Table on Rest of World (ROW) - Year-over-year growth 2025-2030 (%)
Chart on Regional Comparison - Rest of World (ROW)
Data Table on Regional Comparison - Rest of World (ROW)

12.6.1 Brazil - Market size and forecast 2025-2030

Chart on Brazil - Market size and forecast 2025-2030 ($ million)
Data Table on Brazil - Market size and forecast 2025-2030 ($ million)
Chart on Brazil - Year-over-year growth 2025-2030 (%)
Data Table on Brazil - Year-over-year growth 2025-2030 (%)

12.6.2 Saudi Arabia - Market size and forecast 2025-2030

Chart on Saudi Arabia - Market size and forecast 2025-2030 ($ million)
Data Table on Saudi Arabia - Market size and forecast 2025-2030 ($ million)
Chart on Saudi Arabia - Year-over-year growth 2025-2030 (%)
Data Table on Saudi Arabia - Year-over-year growth 2025-2030 (%)

12.6.3 UAE - Market size and forecast 2025-2030

Chart on UAE - Market size and forecast 2025-2030 ($ million)
Data Table on UAE - Market size and forecast 2025-2030 ($ million)
Chart on UAE - Year-over-year growth 2025-2030 (%)
Data Table on UAE - Year-over-year growth 2025-2030 (%)

12.6.4 South Africa - Market size and forecast 2025-2030

Chart on South Africa - Market size and forecast 2025-2030 ($ million)
Data Table on South Africa - Market size and forecast 2025-2030 ($ million)
Chart on South Africa - Year-over-year growth 2025-2030 (%)
Data Table on South Africa - Year-over-year growth 2025-2030 (%)

12.6.5 Argentina - Market size and forecast 2025-2030

Chart on Argentina - Market size and forecast 2025-2030 ($ million)
Data Table on Argentina - Market size and forecast 2025-2030 ($ million)
Chart on Argentina - Year-over-year growth 2025-2030 (%)
Data Table on Argentina - Year-over-year growth 2025-2030 (%)

12.6.6 Turkey - Market size and forecast 2025-2030

Chart on Turkey - Market size and forecast 2025-2030 ($ million)
Data Table on Turkey - Market size and forecast 2025-2030 ($ million)
Chart on Turkey - Year-over-year growth 2025-2030 (%)
Data Table on Turkey - Year-over-year growth 2025-2030 (%)

12.6.7 Colombia - Market size and forecast 2025-2030

Chart on Colombia - Market size and forecast 2025-2030 ($ million)
Data Table on Colombia - Market size and forecast 2025-2030 ($ million)
Chart on Colombia - Year-over-year growth 2025-2030 (%)
Data Table on Colombia - Year-over-year growth 2025-2030 (%)

12.6.8 Israel - Market size and forecast 2025-2030

Chart on Israel - Market size and forecast 2025-2030 ($ million)
Data Table on Israel - Market size and forecast 2025-2030 ($ million)
Chart on Israel - Year-over-year growth 2025-2030 (%)
Data Table on Israel - Year-over-year growth 2025-2030 (%)

12.7 Market opportunity by geography

Market opportunity by geography ($ million)
Data Tables on Market opportunity by geography ($ million)

13. Drivers, Challenges, and Opportunity

13.1 Market drivers

Growing adoption of non-contact temperature screening across healthcare settings
Increasing deployment of temperature monitoring in industrial safety and predictive maintenance programs
Expanding food safety compliance requirements across processing and distribution operations

13.2 Market challenges

Stringent calibration and accuracy validation requirements across regulated applications
Exposure to semiconductor and optical component supply disruptions
Measurement variability caused by environmental and surface condition factors

13.3 Impact of drivers and challenges

Impact of drivers and challenges in 2025 and 2030

13.4 Market opportunities

Advancing integration of wireless-connectivity and cloud-linked temperature measurement devices
Increasing incorporation of AI-enabled data analysis within infrared thermometry platforms
Growing transition toward multifunction temperature monitoring ecosystems with digital record management

14. Competitive Landscape

14.1 Overview

14.2

Overview on criticality of inputs and factors of differentiation

14.3 Landscape disruption

Overview on factors of disruption

14.4 Industry risks

Impact of key risks on business

15. Competitive Analysis

15.1 Companies profiled

Companies covered

15.2 Company ranking index

15.3 Market positioning of companies

Matrix on companies position and classification

15.4 Amprobe

Amprobe - Overview
Amprobe - Product / Service
Amprobe - Key offerings
SWOT

15.5 B and K Precision Corp.

B and K Precision Corp. - Overview
B and K Precision Corp. - Product / Service
B and K Precision Corp. - Key offerings
SWOT

15.6 Calex Electronics Ltd.

Calex Electronics Ltd. - Overview
Calex Electronics Ltd. - Product / Service
Calex Electronics Ltd. - Key offerings
SWOT

15.7 Chauvin Arnoux Group

Chauvin Arnoux Group - Overview
Chauvin Arnoux Group - Product / Service
Chauvin Arnoux Group - Key offerings
SWOT

15.8 Dickson Inc.

Dickson Inc. - Overview
Dickson Inc. - Product / Service
Dickson Inc. - Key offerings
SWOT

15.9 DwyerOmega

DwyerOmega - Overview
DwyerOmega - Product / Service
DwyerOmega - Key offerings
SWOT

15.10 Exergen Corp.

Exergen Corp. - Overview
Exergen Corp. - Product / Service
Exergen Corp. - Key offerings
SWOT

15.11 HORIBA Ltd.

HORIBA Ltd. - Overview
HORIBA Ltd. - Business segments
HORIBA Ltd. - Key offerings
HORIBA Ltd. - Segment focus
SWOT

15.12 Kimo Instruments

Kimo Instruments - Overview
Kimo Instruments - Product / Service
Kimo Instruments - Key offerings
SWOT

15.13 Klein Tools Inc.

Klein Tools Inc. - Overview
Klein Tools Inc. - Product / Service
Klein Tools Inc. - Key offerings
SWOT

15.14 Lascar electronics Ltd.

Lascar electronics Ltd. - Overview
Lascar electronics Ltd. - Product / Service
Lascar electronics Ltd. - Key offerings
SWOT

15.15 Micro Epsilon Messtechnik GmbH

Micro Epsilon Messtechnik GmbH - Overview
Micro Epsilon Messtechnik GmbH - Product / Service
Micro Epsilon Messtechnik GmbH - Key offerings
SWOT

15.16 Teledyne FLIR LLC

Teledyne FLIR LLC - Overview
Teledyne FLIR LLC - Product / Service
Teledyne FLIR LLC - Key offerings
SWOT

15.17 Testo SE and Co. KGaA

Testo SE and Co. KGaA - Overview
Testo SE and Co. KGaA - Product / Service
Testo SE and Co. KGaA - Key offerings
SWOT

15.18 UEi Test Instruments

UEi Test Instruments - Overview
UEi Test Instruments - Product / Service
UEi Test Instruments - Key offerings
SWOT

16. Appendix

16.1 Scope of the report

Market definition
Objectives
Notes and caveats

16.2 Inclusions and exclusions checklist

Inclusions checklist
Exclusions checklist

16.3 Currency conversion rates for US$

16.4 Research methodology

16.5 Data procurement

Information sources

16.6 Data validation

16.7 Validation techniques employed for market sizing

16.8 Data synthesis

16.9 360 degree market analysis

16.10 List of abbreviations

Research Methodology

Technavio presents a detailed picture of the market by way of study, synthesis, and summation of data from multiple sources. The analysts have presented the various facets of the market with a particular focus on identifying the key industry influencers. The data thus presented is comprehensive, reliable, and the result of extensive research, both primary and secondary.

INFORMATION SOURCES

Primary sources

  • Manufacturers and suppliers
  • Channel partners
  • Industry experts
  • Strategic decision makers

Secondary sources

  • Industry journals and periodicals
  • Government data
  • Financial reports of key industry players
  • Historical data
  • Press releases

DATA ANALYSIS

Data Synthesis

  • Collation of data
  • Estimation of key figures
  • Analysis of derived insights

Data Validation

  • Triangulation with data models
  • Reference against proprietary databases
  • Corroboration with industry experts

REPORT WRITING

Qualitative

  • Market drivers
  • Market challenges
  • Market trends
  • Five forces analysis

Quantitative

  • Market size and forecast
  • Market segmentation
  • Geographical insights
  • Competitive landscape

Interested in this report?

Get your sample now to see our research methodology and insights!

Download Now

Frequently Asked Questions

Infrared Thermometers market growth will increase by USD 1336.2 million during 2026-2030.

The Infrared Thermometers market is expected to grow at a CAGR of 17.2% during 2026-2030.

Infrared Thermometers market is segmented by Product (Non-contact thermometers, Contact thermometers) Type (Handled thermometer, Fixed-mount thermometer) Application (Medical, Non-medical)

Amprobe, B and K Precision Corp., Calex Electronics Ltd., Chauvin Arnoux Group, Dickson Inc., DwyerOmega, Exergen Corp., HORIBA Ltd., Kimo Instruments, Klein Tools Inc., Lascar electronics Ltd., Micro Epsilon Messtechnik GmbH, Optris GmbH, Palmer Wahl Instruments Inc., Pyromation, REED Instruments, Teledyne FLIR LLC, Testo SE and Co. KGaA, UEi Test Instruments are a few of the key vendors in the Infrared Thermometers market.

North America will register the highest growth rate of 49.5% among the other regions. Therefore, the Infrared Thermometers market in North America is expected to garner significant business opportunities for the vendors during the forecast period.

US, Canada, Mexico, Germany, UK, France, Italy, Spain, The Netherlands, China, Japan, India, South Korea, Indonesia, Thailand, Brazil, Saudi Arabia, UAE, South Africa, Argentina, Turkey, Colombia, Israel

  • Growing adoption of non-contact temperature screening across healthcare settings is the driving factor this market.

The Infrared Thermometers market vendors should focus on grabbing business opportunities from the Product segment as it accounted for the largest market share in the base year.
RIA - Research AI Assistant
Ask RIA
