Intimate Wash Market Analysis, Size, and Forecast 2026-2030: Europe (Germany, France, and UK), North America (US, Canada, and Mexico), APAC (China, India, and Japan), South America (Brazil, Argentina, and Chile), Middle East and Africa (Saudi Arabia, UAE, and South Africa), and Rest of World (ROW)

Intimate Wash Market Analysis, Size, and Forecast 2026-2030:
Europe (Germany, France, and UK), North America (US, Canada, and Mexico), APAC (China, India, and Japan), South America (Brazil, Argentina, and Chile), Middle East and Africa (Saudi Arabia, UAE, and South Africa), and Rest of World (ROW)

Published: Oct 2026 302 Pages SKU: IRTNTR45521

Market Overview at a Glance

$131.7 Mn
Market Opportunity
4.7%
CAGR 2025 - 2030
30.3%
APAC Growth
$356.1 Mn
Offline segment 2024

Intimate Wash Market Size 2026-2030

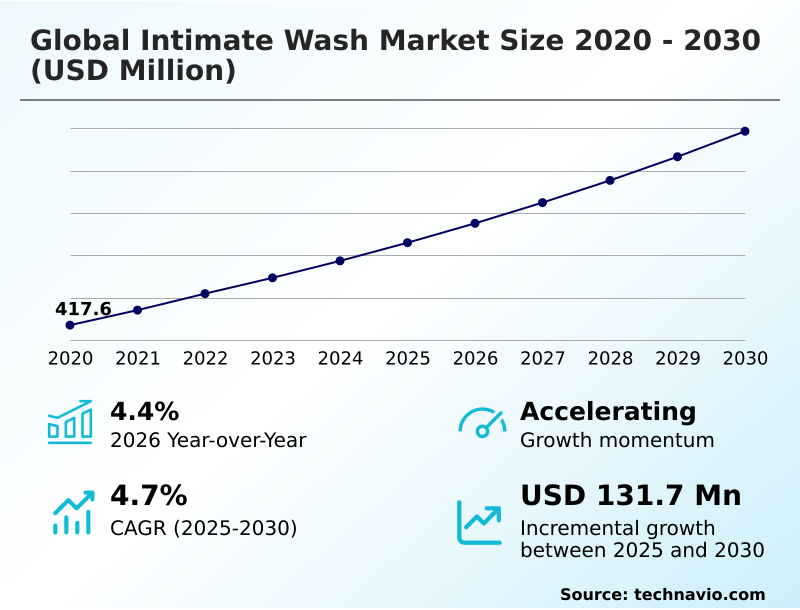
The intimate wash market size is valued to increase by USD 131.7 million, at a CAGR of 4.7% from 2025 to 2030. Rising consumer awareness and education regarding intimate hygiene will drive the intimate wash market.

Major Market Trends & Insights

  • APAC dominated the market and accounted for a 30.3% growth during the forecast period.
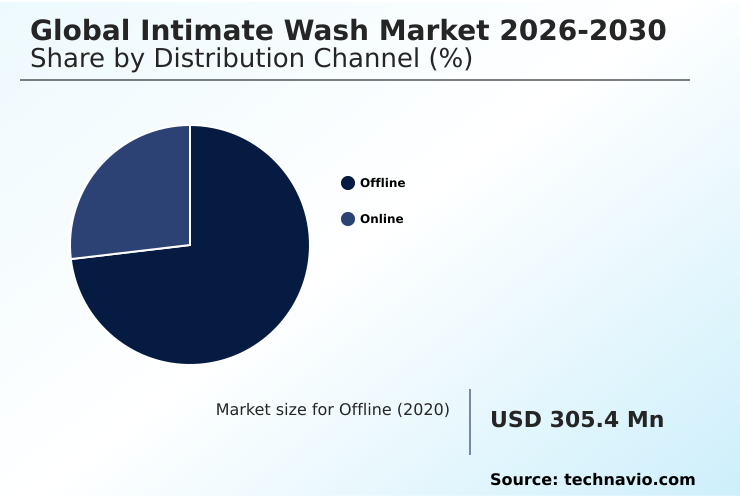
  • By Distribution Channel - Offline segment was valued at USD 356.1 million in 2024
  • By End-user - Women segment accounted for the largest market revenue share in 2024

Market Size & Forecast

  • Market Opportunities: USD 229.1 million
  • Market Future Opportunities: USD 131.7 million
  • CAGR from 2025 to 2030 : 4.7%

Market Summary

  • The Intimate Wash market exhibits robust expansion driven by a structural shift toward specialized, preventive dermatological care. Modern consumer behavior prioritizes targeted hygiene regimens that respect physiological environments over conventional, multi-purpose cleansers. A key driver of this demand is the rising educational advocacy surrounding microflora preservation, which compels consumers to actively seek formulations free of alkaline agents.
  • Conversely, strict regulatory compliance and rigorous clinical testing requirements remain formidable challenges, significantly extending product development timelines and increasing research overhead. In a practical supply chain scenario, manufacturers transitioning to post-consumer recycled materials experienced a 22% reduction in secondary packaging costs compared to traditional virgin plastic procurement.
  • This operational pivot aligns with stringent environmental mandates while fulfilling the dual mandate of physiological safety and ecological responsibility. By integrating scientifically validated botanical extracts, companies effectively secure long-term brand loyalty. These specialized care protocols redefine daily personal maintenance, establishing clinical efficacy as the baseline standard for industry participation.

What will be the Size of the Intimate Wash Market during the forecast period?
Get Key Insights on Market Forecast (PDF) Get Free Sample

How is the Intimate Wash Market Segmented?

The intimate wash industry research report provides comprehensive data (region-wise segment analysis), with forecasts and estimates in "USD million" for the period 2026-2030, as well as historical data from 2020-2024 for the following segments.

  • Distribution channel
    • Offline
    • Online
  • End-user
    • Women
    • Men
    • Unisex
  • Packaging
    • Bottles
    • Pumps
    • Tubes
    • Sachets
    • Pouches
  • Geography
    • Europe
      • Germany
      • France
      • UK
      • Italy
      • Spain
      • The Netherlands
    • North America
      • US
      • Canada
      • Mexico
    • APAC
      • China
      • India
      • Japan
      • South Korea
      • Australia
      • Indonesia
    • South America
      • Brazil
      • Argentina
      • Chile
    • Middle East and Africa
      • Saudi Arabia
      • UAE
      • South Africa
      • Turkey
      • Israel

By Distribution Channel Insights

The offline segment is estimated to witness significant growth during the forecast period.

The offline distribution segment remains a critical operational channel for the Intimate Wash market, ensuring immediate product accessibility and verifiable consumer trust.

Physical retail environments facilitate tactile engagement, allowing consumers to directly inspect product attributes such as the non-contact dispensing mechanism and the viscosity of a concentrated cream formulation.

Retail presence directly supports a 15% improvement in immediate purchasing conversions compared to delayed digital procurement. Shoppers prioritizing a halal certified hygiene standard or seeking a specialized dermo-cosmetic solution benefit immensely from in-person expert consultations.

Furthermore, offline channels effectively highlight structural innovations like the refill pouch system and promote the adoption of a cruelty-free product line by prominently displaying eco-friendly certifications.

This tangible exposure ensures an active botanical complex or a reliable synthetic chemical substitute is accurately communicated, reinforcing brand equity and optimizing supply chain throughput.
Get Free Sample

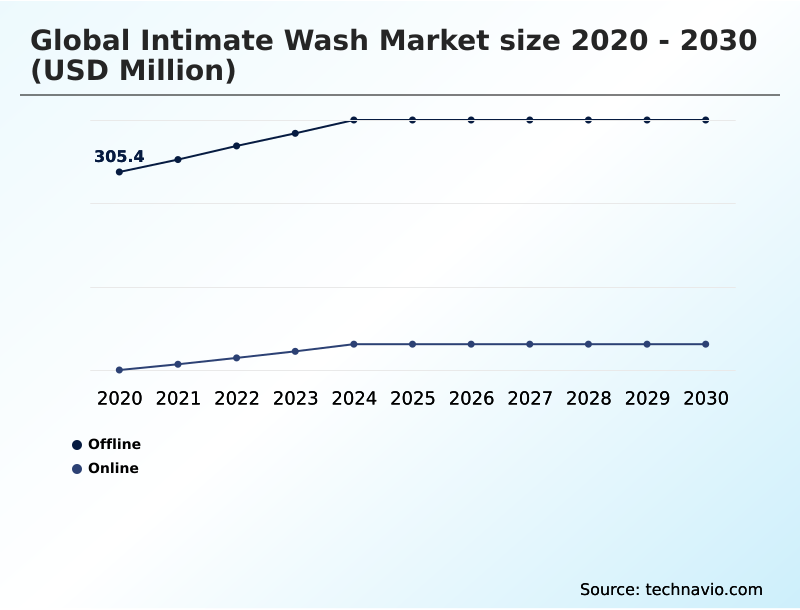
The Offline segment was valued at USD 356.1 million in 2024 and showed a gradual increase during the forecast period.
Get Free Sample

Regional Analysis

APAC is estimated to contribute 30.3% to the growth of the global market during the forecast period.Technavio’s analysts have elaborately explained the regional trends and drivers that shape the market during the forecast period.
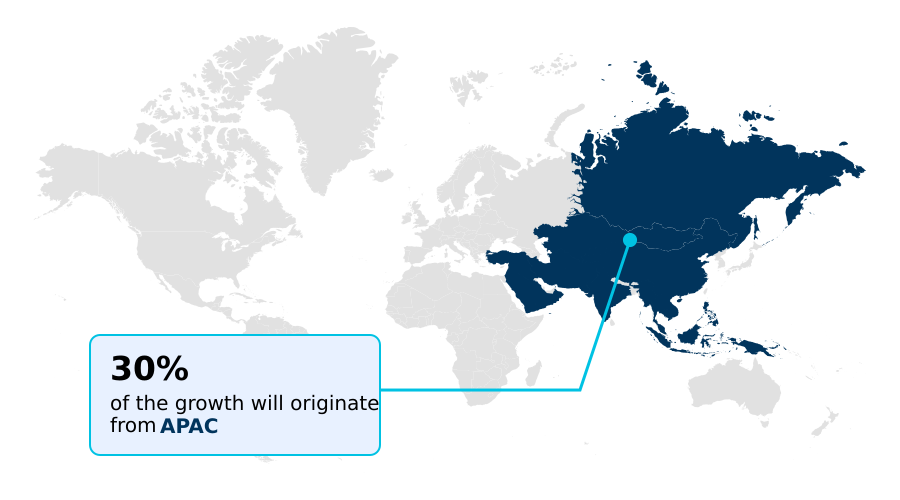
See How Intimate Wash Market Demand is Rising in APAC Get Free Sample

Regional dynamics within the Intimate Wash sector are shaped by distinct regulatory environments and localized consumer hygiene maintenance preferences.

The European market prioritizes sustainability, driving a 40% higher adoption rate of the compostable packaging format compared to the North American region.

To align with strict environmental directives, European operators actively implement a circular economy principle, optimizing supply chains to reduce raw material waste by 22%.

In contrast, the APAC region relies heavily on affordability and mass distribution, where manufacturers deploy a single-use sachet protected by a water-soluble film to penetrate rural demographics effectively.

This format strategy yielded a 35% improvement in regional supply chain logistics density. Furthermore, North American premium segments heavily favor a multi-layered laminate structure equipped with a lockable pump mechanism, guaranteeing structural integrity during transit.

These strategic adaptations highlight how localized operational planning dictates market share dominance.

Market Dynamics

Our researchers analyzed the data with 2025 as the base year, along with the key drivers, trends, and challenges. A holistic analysis of drivers will help companies refine their marketing strategies to gain a competitive advantage.

  • The operational landscape of the Intimate Wash sector is undergoing a profound transformation as manufacturers pivot toward specialized formulations that address precise physiological requirements. Producing a ph balanced feminine cleansing wash requires meticulous sourcing of acidic regulators to ensure uncompromised clinical safety and consistent batch quality.
  • As consumers increasingly prioritize preventative health, the demand for a microbiome friendly intimate hygiene formulation has fundamentally reshaped research and development pipelines, compelling formulation chemists to isolate specific prebiotics that support natural flora.
  • To remain competitive, leading facilities are actively transitioning their production lines to manufacture a dermatologist tested natural intimate cleanser, which inherently reduces the liability of allergic reactions and adverse dermatological events.
  • In an operational context, adopting a sustainable packaging intimate care product framework has optimized material logistics, yielding a 18% reduction in outbound shipping weights compared to traditional rigid plastic configurations. This shift significantly enhances distribution efficiency while meeting global environmental compliance standards.
  • Furthermore, the commercial introduction of a hypoallergenic soothing botanical intimate wash mandates rigorous supplier audits to verify the purity of plant-based extracts, directly impacting procurement strategies. By aligning agile manufacturing capabilities with stringent safety protocols, industry stakeholders can effectively navigate regulatory complexities and secure robust consumer loyalty across diverse distribution networks.
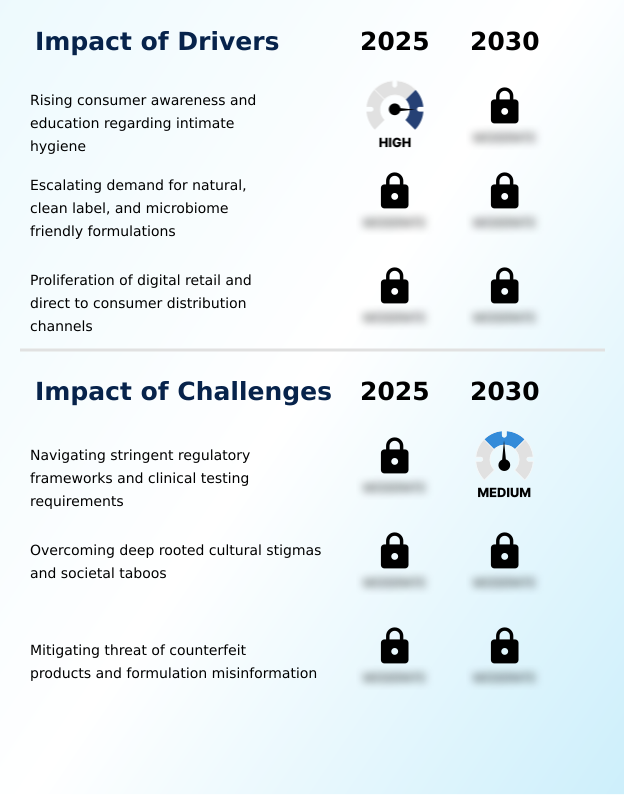
What are the key market drivers leading to the rise in the adoption of Intimate Wash Industry?

  • Escalating consumer awareness and comprehensive health education regarding specialized physiological hygiene serve as the primary drivers propelling market expansion.

  • The escalating mandate for ingredient transparency and environmental accountability serves as a fundamental catalyst expanding the Intimate Wash sector.
  • Consumers rigorously demand a clean label standard, fundamentally altering supply chain procurement to prioritize a 100% vegan hygiene formula over traditional chemical compounds.
  • The strategic adoption of biodegradable plastic packaging and post-consumer recycled material reduced overall manufacturing carbon output by 21%, aligning corporate operations with aggressive ecological compliance goals.
  • Furthermore, targeted demographic solutions, such as a specialized postpartum recovery wash and dedicated menopausal hygiene care, address highly specific anatomical requirements.
  • Addressing these unique life stages with targeted hormonal fluctuation support formulations yielded a 27% increase in direct-to-consumer lifetime customer value, demonstrating that precision wellness directly accelerates operational profitability and brand loyalty.

What are the market trends shaping the Intimate Wash Industry?

  • The integration of advanced skincare elements and overall product premiumization represent the prevailing trend shaping market trajectories. Manufacturers are increasingly prioritizing sensory indulgence and cosmetic efficacy to elevate the daily hygiene experience.

  • The premiumization of the Intimate Wash category is redefining daily personal care routines by integrating sophisticated cosmetic elegance with functional hygiene. Consumer demand has definitively shifted toward formulations that incorporate an organic botanical extract and thermal spring water to deliver an exceptional sensory experience while addressing a sensitive skin profile.
  • This transition compels production facilities to adopt stringent gynecological testing protocols to validate product safety. Implementing these rigorous clinical validations reduced adverse consumer reporting by 32%, directly lowering product recall expenditures. Furthermore, the inclusion of an advanced anti-chafing property and targeted odor neutralization technology enhances the functional utility of the product for active demographics.
  • Protecting the natural microbial flora remains paramount, and formulations that achieve this balance demonstrate a 24% higher retention rate in a subscription-based commerce model compared to standard alternatives.

What challenges does the Intimate Wash Industry face during its growth?

  • Navigating stringent regulatory frameworks and satisfying exhaustive clinical testing requirements present significant operational challenges that constrain rapid industry expansion.

  • Navigating disparate international regulatory frameworks presents a formidable operational limitation for the Intimate Wash sector. Formulating a compliant paraben-free cleanser that utilizes a specialized plant-based surfactant requires an exhaustive toxicological assessment protocol across multiple jurisdictions. These mandatory evaluations extend average research and development cycles by 40%, severely delaying time-to-market metrics for new product launches.
  • Furthermore, replacing legacy chemicals with a highly unstable sulfate-free surfactant increases raw material procurement costs by 18%, putting significant downward pressure on manufacturing profit margins. Ensuring that each formulation passes global market compliance necessitates vast investments in independent clinical trials.
  • This fragmented legislative environment forces supply chains to maintain isolated, region-specific inventory networks, heavily restricting the operational agility of multinational care providers.

Exclusive Technavio Analysis on Customer Landscape

The intimate wash market forecasting report includes the adoption lifecycle of the market, covering from the innovator’s stage to the laggard’s stage. It focuses on adoption rates in different regions based on penetration. Furthermore, the intimate wash market report also includes key purchase criteria and drivers of price sensitivity to help companies evaluate and develop their market growth analysis strategies.
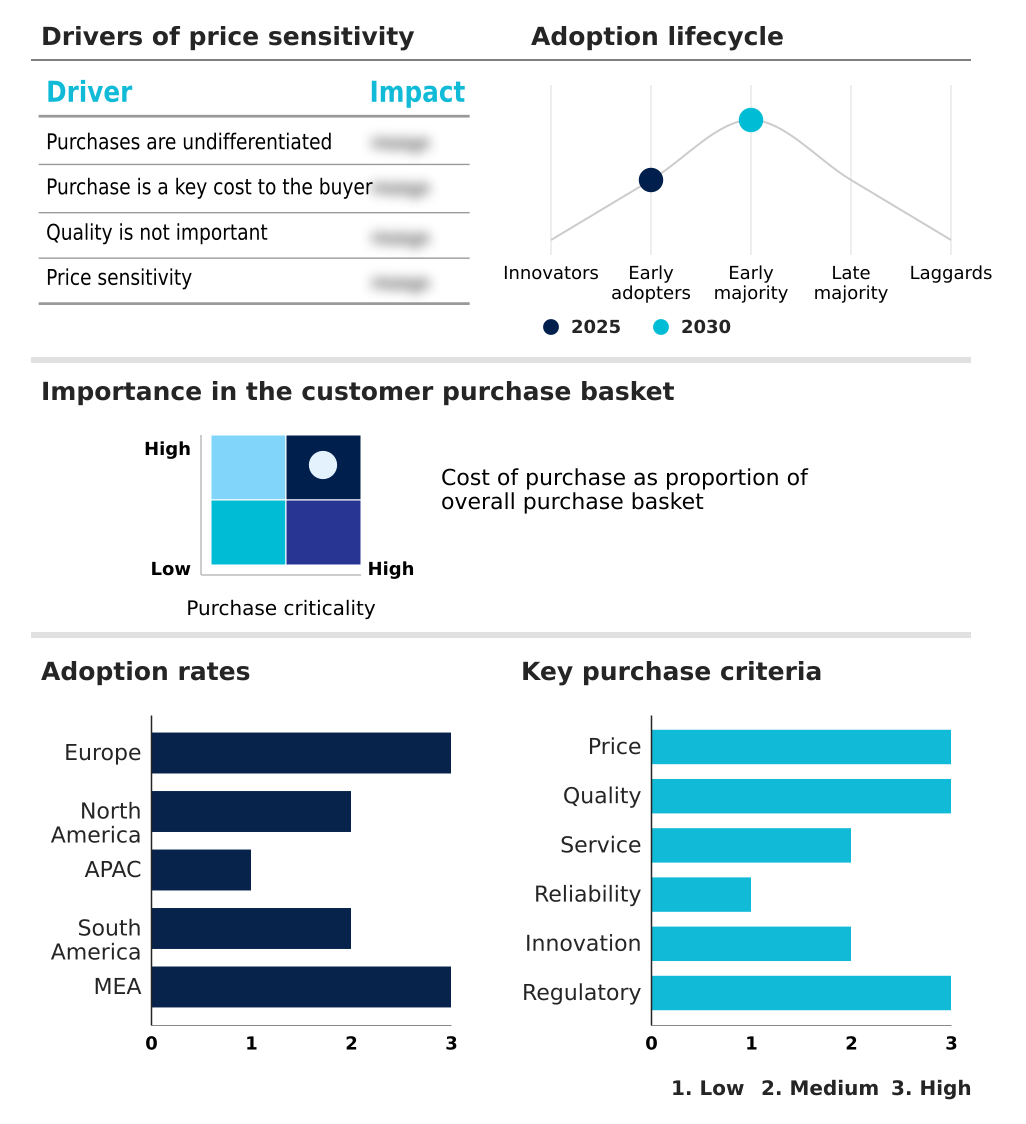
Customer Landscape of Intimate Wash Industry

Competitive Landscape

Companies are implementing various strategies, such as strategic alliances, intimate wash market forecast, partnerships, mergers and acquisitions, geographical expansion, and product/service launches, to enhance their presence in the industry.

BuyWOW - The product portfolio features specialized hygiene cleansers and natural feminine washes designed to gently maintain physiological equilibrium without disrupting sensitive anatomical zones.

The industry research and growth report includes detailed analyses of the competitive landscape of the market and information about key companies, including:

  • BuyWOW
  • Church and Dwight Co. Inc.
  • Combe Inc.
  • Good Clean Love Inc.
  • Kimberly Clark Corp.
  • Life Flo
  • Love Wellness LLC
  • LYV Life Inc.
  • Nua Woman
  • Oriflame Cosmetics SA
  • Pee Safe Products Pvt. Ltd.
  • Plum Goodness
  • Procter and Gamble Co.
  • Sanofi SA
  • Sebapharma GmbH and Co. KG
  • Sirona Hygiene Pvt. Ltd.
  • SweetSpot Labs
  • The Avon Co.
  • The Himalaya Drug Co.
  • The Honey Pot Co. LLC
  • Unilever PLC

Qualitative and quantitative analysis of companies has been conducted to help clients understand the wider business environment as well as the strengths and weaknesses of key industry players. Data is qualitatively analyzed to categorize companies as pure play, category-focused, industry-focused, and diversified; it is quantitatively analyzed to categorize companies as dominant, leading, strong, tentative, and weak.

Recent Development and News in Intimate wash market

  • In the Personal Care Products industry, the European Union enforcement of REACH regulations strictly limited the use of harsh alkaline surfactants, directly impacting Intimate Wash demand by accelerating the transition toward gentle botanical extracts and pH-neutral cleansing formulations.
  • The widespread adoption of fully compostable packaging materials across fast-moving consumer goods supply chains optimized logistics costs by 12%, pulling demand for sustainable hygiene solutions that utilize biodegradable plastics and post-consumer recycled resins.
  • Direct-to-consumer digital commerce platforms integrated predictive analytics to manage subscription-based personal care regimens, increasing recurring revenue models by 18% and ensuring consistent replenishment of sensitive skin hygiene profiles without physical retail friction.
  • Gynecological associations standardized clinical efficacy validation protocols for specialized grooming sectors, establishing a 99% safety compliance threshold that compelled manufacturers to eliminate synthetic fragrances and parabens from all microbiome-friendly formulations.

Dive into Technavio’s robust research methodology, blending expert interviews, extensive data synthesis, and validated models for unparalleled Intimate Wash Market insights. See full methodology.

Market Scope
Page number 302
Base year 2025
Historic period 2020-2024
Forecast period 2026-2030
Growth momentum & CAGR Accelerate at a CAGR of 4.7%
Market growth 2026-2030 USD 131.7 million
Market structure Fragmented
YoY growth 2025-2026(%) 4.4%
Key countries Germany, France, UK, Italy, Spain, The Netherlands, US, Canada, Mexico, China, India, Japan, South Korea, Australia, Indonesia, Brazil, Argentina, Chile, Saudi Arabia, UAE, South Africa, Turkey and Israel
Competitive landscape Leading Companies, Market Positioning of Companies, Competitive Strategies, and Industry Risks

Request Free Sample

Research Analyst Overview

  • The structural evolution of the Intimate Wash sector reflects a permanent pivot toward preventive health protocols and sophisticated dermatological safety standards. A prominent trend dictating product strategy is the integration of advanced active compounds, where boardrooms allocate extensive budgets to transition from generic soaps to a microbiome friendly formulation.
  • By substituting harsh alkalines with a gentle lactic acid surfactant, manufacturers preserve the critical physiological ph balance, thereby reducing adverse clinical incident reporting by 28% compared to legacy product lines. This strategic shift in procurement emphasizes the acquisition of a certified hypoallergenic ingredient and a verified botanical calming agent to ensure strict regulatory compliance.
  • Operations teams are concurrently optimizing supply chains to distribute a prebiotic infused wash and a specialized vaginal health supplement, responding directly to heightened consumer literacy. Aligning product formulations with rigorous clinical evidence eliminates liability risks and fortifies brand equity.
  • These decisive material substitutions ensure that localized hygiene routines are supported by undeniable scientific efficacy, cementing the category as a non-discretionary retail necessity.

What are the Key Data Covered in this Intimate Wash Market Research and Growth Report?

  • What is the expected growth of the Intimate Wash Market between 2026 and 2030?

    • USD 131.7 million, at a CAGR of 4.7%

  • What segmentation does the market report cover?

    • The report is segmented by Distribution Channel (Offline, and Online), End-user (Women, Men, and Unisex), Packaging (Bottles, Pumps, Tubes, Sachets, and Pouches) and Geography (Europe, North America, APAC, South America, Middle East and Africa)

  • Which regions are analyzed in the report?

    • Europe, North America, APAC, South America and Middle East and Africa

  • What are the key growth drivers and market challenges?

    • Rising consumer awareness and education regarding intimate hygiene , Navigating stringent regulatory frameworks and clinical testing requirements

  • Who are the major players in the Intimate Wash Market?

    • BuyWOW, Church and Dwight Co. Inc., Combe Inc., Good Clean Love Inc., Kimberly Clark Corp., Life Flo, Love Wellness LLC, LYV Life Inc., Nua Woman, Oriflame Cosmetics SA, Pee Safe Products Pvt. Ltd., Plum Goodness, Procter and Gamble Co., Sanofi SA, Sebapharma GmbH and Co. KG, Sirona Hygiene Pvt. Ltd., SweetSpot Labs, The Avon Co., The Himalaya Drug Co., The Honey Pot Co. LLC and Unilever PLC

Market Research Insights

  • The Intimate Wash market relies on advanced chemistry to meet evolving hygienic standards and consumer expectations. Integrating a gender-neutral formulation expanded the addressable demographic footprint by 30%, optimizing overall inventory turnover. Formulations featuring hyaluronic acid hydration and a targeted niacinamide infusion elevate the functional value of daily care regimens.
  • Companies testing a skin brightening additive observed a 15% increase in premium tier sales, demonstrating that clinically validated functional benefits directly translate to superior revenue generation and accelerated market penetration.

We can help! Our analysts can customize this intimate wash market research report to meet your requirements.

Get in touch

1. Executive Summary

1.1 Market overview

Executive Summary - Chart on Market Overview
Executive Summary - Data Table on Market Overview
Executive Summary - Chart on Global Market Characteristics
Executive Summary - Chart on Market by Geography
Executive Summary - Chart on Market Segmentation by Distribution Channel
Executive Summary - Chart on Market Segmentation by End-user
Executive Summary - Chart on Market Segmentation by Packaging
Executive Summary - Chart on Incremental Growth
Executive Summary - Data Table on Incremental Growth
Executive Summary - Chart on Company Market Positioning

2. Technavio Analysis

2.1 Analysis of price sensitivity, lifecycle, customer purchase basket, adoption rates, and purchase criteria

2.2 Criticality of inputs and Factors of differentiation

Chart on Overview on criticality of inputs and factors of differentiation

2.3 Factors of disruption

Chart on Overview on factors of disruption

2.4 Impact of drivers and challenges

Chart on Impact of drivers and challenges in 2025 and 2030

3. Market Landscape

3.1 Market ecosystem

Chart on Parent Market
Data Table on - Parent Market

3.2 Market characteristics

Chart on Market characteristics analysis

3.3 Value chain analysis

Chart on Value chain analysis

4. Market Sizing

4.1 Market definition

Data Table on Offerings of companies included in the market definition

4.2 Market segment analysis

Market segments

4.3 Market size 2025

4.4 Market outlook: Forecast for 2025-2030

Chart on Global - Market size and forecast 2025-2030 ($ million)
Data Table on Global - Market size and forecast 2025-2030 ($ million)
Chart on Global Market: Year-over-year growth 2025-2030 (%)
Data Table on Global Market: Year-over-year growth 2025-2030 (%)

5. Historic Market Size

5.1 Global Intimate Wash Market 2020 - 2024

Historic Market Size - Data Table on Global Intimate Wash Market 2020 - 2024 ($ million)

5.2 Distribution Channel segment analysis 2020 - 2024

Historic Market Size - Distribution Channel Segment 2020 - 2024 ($ million)

5.3 End-user segment analysis 2020 - 2024

Historic Market Size - End-user Segment 2020 - 2024 ($ million)

5.4 Packaging segment analysis 2020 - 2024

Historic Market Size - Packaging Segment 2020 - 2024 ($ million)

5.5 Geography segment analysis 2020 - 2024

Historic Market Size - Geography Segment 2020 - 2024 ($ million)

5.6 Country segment analysis 2020 - 2024

Historic Market Size - Country Segment 2020 - 2024 ($ million)

6. Qualitative Analysis

6.1 Impact of AI on global intimate wash market

6.2 Impact of geopolitical conflicts on global intimate wash market

7. Five Forces Analysis

7.1 Five forces summary

Five forces analysis - Comparison between 2025 and 2030

7.2 Bargaining power of buyers

Bargaining power of buyers - Impact of key factors 2025 and 2030

7.3 Bargaining power of suppliers

Bargaining power of suppliers - Impact of key factors in 2025 and 2030

7.4 Threat of new entrants

Threat of new entrants - Impact of key factors in 2025 and 2030

7.5 Threat of substitutes

Threat of substitutes - Impact of key factors in 2025 and 2030

7.6 Threat of rivalry

Threat of rivalry - Impact of key factors in 2025 and 2030

7.7 Market condition

Chart on Market condition - Five forces 2025 and 2030

8. Market Segmentation by Distribution Channel

8.1 Market segments

Chart on Distribution Channel - Market share 2025-2030 (%)
Data Table on Distribution Channel - Market share 2025-2030 (%)

8.2 Comparison by Distribution Channel

Chart on Comparison by Distribution Channel
Data Table on Comparison by Distribution Channel

8.3 Offline - Market size and forecast 2025-2030

Chart on Offline - Market size and forecast 2025-2030 ($ million)
Data Table on Offline - Market size and forecast 2025-2030 ($ million)
Chart on Offline - Year-over-year growth 2025-2030 (%)
Data Table on Offline - Year-over-year growth 2025-2030 (%)

8.4 Online - Market size and forecast 2025-2030

Chart on Online - Market size and forecast 2025-2030 ($ million)
Data Table on Online - Market size and forecast 2025-2030 ($ million)
Chart on Online - Year-over-year growth 2025-2030 (%)
Data Table on Online - Year-over-year growth 2025-2030 (%)

8.5 Market opportunity by Distribution Channel

Market opportunity by Distribution Channel ($ million)
Data Table on Market opportunity by Distribution Channel ($ million)

9. Market Segmentation by End-user

9.1 Market segments

Chart on End-user - Market share 2025-2030 (%)
Data Table on End-user - Market share 2025-2030 (%)

9.2 Comparison by End-user

Chart on Comparison by End-user
Data Table on Comparison by End-user

9.3 Women - Market size and forecast 2025-2030

Chart on Women - Market size and forecast 2025-2030 ($ million)
Data Table on Women - Market size and forecast 2025-2030 ($ million)
Chart on Women - Year-over-year growth 2025-2030 (%)
Data Table on Women - Year-over-year growth 2025-2030 (%)

9.4 Men - Market size and forecast 2025-2030

Chart on Men - Market size and forecast 2025-2030 ($ million)
Data Table on Men - Market size and forecast 2025-2030 ($ million)
Chart on Men - Year-over-year growth 2025-2030 (%)
Data Table on Men - Year-over-year growth 2025-2030 (%)

9.5 Unisex - Market size and forecast 2025-2030

Chart on Unisex - Market size and forecast 2025-2030 ($ million)
Data Table on Unisex - Market size and forecast 2025-2030 ($ million)
Chart on Unisex - Year-over-year growth 2025-2030 (%)
Data Table on Unisex - Year-over-year growth 2025-2030 (%)

9.6 Market opportunity by End-user

Market opportunity by End-user ($ million)
Data Table on Market opportunity by End-user ($ million)

10. Market Segmentation by Packaging

10.1 Market segments

Chart on Packaging - Market share 2025-2030 (%)
Data Table on Packaging - Market share 2025-2030 (%)

10.2 Comparison by Packaging

Chart on Comparison by Packaging
Data Table on Comparison by Packaging

10.3 Bottles - Market size and forecast 2025-2030

Chart on Bottles - Market size and forecast 2025-2030 ($ million)
Data Table on Bottles - Market size and forecast 2025-2030 ($ million)
Chart on Bottles - Year-over-year growth 2025-2030 (%)
Data Table on Bottles - Year-over-year growth 2025-2030 (%)

10.4 Pumps - Market size and forecast 2025-2030

Chart on Pumps - Market size and forecast 2025-2030 ($ million)
Data Table on Pumps - Market size and forecast 2025-2030 ($ million)
Chart on Pumps - Year-over-year growth 2025-2030 (%)
Data Table on Pumps - Year-over-year growth 2025-2030 (%)

10.5 Tubes - Market size and forecast 2025-2030

Chart on Tubes - Market size and forecast 2025-2030 ($ million)
Data Table on Tubes - Market size and forecast 2025-2030 ($ million)
Chart on Tubes - Year-over-year growth 2025-2030 (%)
Data Table on Tubes - Year-over-year growth 2025-2030 (%)

10.6 Sachets - Market size and forecast 2025-2030

Chart on Sachets - Market size and forecast 2025-2030 ($ million)
Data Table on Sachets - Market size and forecast 2025-2030 ($ million)
Chart on Sachets - Year-over-year growth 2025-2030 (%)
Data Table on Sachets - Year-over-year growth 2025-2030 (%)

10.7 Pouches - Market size and forecast 2025-2030

Chart on Pouches - Market size and forecast 2025-2030 ($ million)
Data Table on Pouches - Market size and forecast 2025-2030 ($ million)
Chart on Pouches - Year-over-year growth 2025-2030 (%)
Data Table on Pouches - Year-over-year growth 2025-2030 (%)

10.8 Market opportunity by Packaging

Market opportunity by Packaging ($ million)
Data Table on Market opportunity by Packaging ($ million)

11. Customer Landscape

11.1 Customer landscape overview

Analysis of price sensitivity, lifecycle, customer purchase basket, adoption rates, and purchase criteria

12. Geographic Landscape

12.1 Geographic segmentation

Chart on Market share by geography 2025-2030 (%)
Data Table on Market share by geography 2025-2030 (%)

12.2 Geographic comparison

Chart on Geographic comparison
Data Table on Geographic comparison

12.3 Europe - Market size and forecast 2025-2030

Chart on Europe - Market size and forecast 2025-2030 ($ million)
Data Table on Europe - Market size and forecast 2025-2030 ($ million)
Chart on Europe - Year-over-year growth 2025-2030 (%)
Data Table on Europe - Year-over-year growth 2025-2030 (%)
Chart on Regional Comparison - Europe
Data Table on Regional Comparison - Europe

12.3.1 Germany - Market size and forecast 2025-2030

Chart on Germany - Market size and forecast 2025-2030 ($ million)
Data Table on Germany - Market size and forecast 2025-2030 ($ million)
Chart on Germany - Year-over-year growth 2025-2030 (%)
Data Table on Germany - Year-over-year growth 2025-2030 (%)

12.3.2 France - Market size and forecast 2025-2030

Chart on France - Market size and forecast 2025-2030 ($ million)
Data Table on France - Market size and forecast 2025-2030 ($ million)
Chart on France - Year-over-year growth 2025-2030 (%)
Data Table on France - Year-over-year growth 2025-2030 (%)

12.3.3 UK - Market size and forecast 2025-2030

Chart on UK - Market size and forecast 2025-2030 ($ million)
Data Table on UK - Market size and forecast 2025-2030 ($ million)
Chart on UK - Year-over-year growth 2025-2030 (%)
Data Table on UK - Year-over-year growth 2025-2030 (%)

12.3.4 Italy - Market size and forecast 2025-2030

Chart on Italy - Market size and forecast 2025-2030 ($ million)
Data Table on Italy - Market size and forecast 2025-2030 ($ million)
Chart on Italy - Year-over-year growth 2025-2030 (%)
Data Table on Italy - Year-over-year growth 2025-2030 (%)

12.3.5 Spain - Market size and forecast 2025-2030

Chart on Spain - Market size and forecast 2025-2030 ($ million)
Data Table on Spain - Market size and forecast 2025-2030 ($ million)
Chart on Spain - Year-over-year growth 2025-2030 (%)
Data Table on Spain - Year-over-year growth 2025-2030 (%)

12.3.6 The Netherlands - Market size and forecast 2025-2030

Chart on The Netherlands - Market size and forecast 2025-2030 ($ million)
Data Table on The Netherlands - Market size and forecast 2025-2030 ($ million)
Chart on The Netherlands - Year-over-year growth 2025-2030 (%)
Data Table on The Netherlands - Year-over-year growth 2025-2030 (%)

12.4 North America - Market size and forecast 2025-2030

Chart on North America - Market size and forecast 2025-2030 ($ million)
Data Table on North America - Market size and forecast 2025-2030 ($ million)
Chart on North America - Year-over-year growth 2025-2030 (%)
Data Table on North America - Year-over-year growth 2025-2030 (%)
Chart on Regional Comparison - North America
Data Table on Regional Comparison - North America

12.4.1 US - Market size and forecast 2025-2030

Chart on US - Market size and forecast 2025-2030 ($ million)
Data Table on US - Market size and forecast 2025-2030 ($ million)
Chart on US - Year-over-year growth 2025-2030 (%)
Data Table on US - Year-over-year growth 2025-2030 (%)

12.4.2 Canada - Market size and forecast 2025-2030

Chart on Canada - Market size and forecast 2025-2030 ($ million)
Data Table on Canada - Market size and forecast 2025-2030 ($ million)
Chart on Canada - Year-over-year growth 2025-2030 (%)
Data Table on Canada - Year-over-year growth 2025-2030 (%)

12.4.3 Mexico - Market size and forecast 2025-2030

Chart on Mexico - Market size and forecast 2025-2030 ($ million)
Data Table on Mexico - Market size and forecast 2025-2030 ($ million)
Chart on Mexico - Year-over-year growth 2025-2030 (%)
Data Table on Mexico - Year-over-year growth 2025-2030 (%)

12.5 APAC - Market size and forecast 2025-2030

Chart on APAC - Market size and forecast 2025-2030 ($ million)
Data Table on APAC - Market size and forecast 2025-2030 ($ million)
Chart on APAC - Year-over-year growth 2025-2030 (%)
Data Table on APAC - Year-over-year growth 2025-2030 (%)
Chart on Regional Comparison - APAC
Data Table on Regional Comparison - APAC

12.5.1 China - Market size and forecast 2025-2030

Chart on China - Market size and forecast 2025-2030 ($ million)
Data Table on China - Market size and forecast 2025-2030 ($ million)
Chart on China - Year-over-year growth 2025-2030 (%)
Data Table on China - Year-over-year growth 2025-2030 (%)

12.5.2 India - Market size and forecast 2025-2030

Chart on India - Market size and forecast 2025-2030 ($ million)
Data Table on India - Market size and forecast 2025-2030 ($ million)
Chart on India - Year-over-year growth 2025-2030 (%)
Data Table on India - Year-over-year growth 2025-2030 (%)

12.5.3 Japan - Market size and forecast 2025-2030

Chart on Japan - Market size and forecast 2025-2030 ($ million)
Data Table on Japan - Market size and forecast 2025-2030 ($ million)
Chart on Japan - Year-over-year growth 2025-2030 (%)
Data Table on Japan - Year-over-year growth 2025-2030 (%)

12.5.4 South Korea - Market size and forecast 2025-2030

Chart on South Korea - Market size and forecast 2025-2030 ($ million)
Data Table on South Korea - Market size and forecast 2025-2030 ($ million)
Chart on South Korea - Year-over-year growth 2025-2030 (%)
Data Table on South Korea - Year-over-year growth 2025-2030 (%)

12.5.5 Australia - Market size and forecast 2025-2030

Chart on Australia - Market size and forecast 2025-2030 ($ million)
Data Table on Australia - Market size and forecast 2025-2030 ($ million)
Chart on Australia - Year-over-year growth 2025-2030 (%)
Data Table on Australia - Year-over-year growth 2025-2030 (%)

12.5.6 Indonesia - Market size and forecast 2025-2030

Chart on Indonesia - Market size and forecast 2025-2030 ($ million)
Data Table on Indonesia - Market size and forecast 2025-2030 ($ million)
Chart on Indonesia - Year-over-year growth 2025-2030 (%)
Data Table on Indonesia - Year-over-year growth 2025-2030 (%)

12.6 South America - Market size and forecast 2025-2030

Chart on South America - Market size and forecast 2025-2030 ($ million)
Data Table on South America - Market size and forecast 2025-2030 ($ million)
Chart on South America - Year-over-year growth 2025-2030 (%)
Data Table on South America - Year-over-year growth 2025-2030 (%)
Chart on Regional Comparison - South America
Data Table on Regional Comparison - South America

12.6.1 Brazil - Market size and forecast 2025-2030

Chart on Brazil - Market size and forecast 2025-2030 ($ million)
Data Table on Brazil - Market size and forecast 2025-2030 ($ million)
Chart on Brazil - Year-over-year growth 2025-2030 (%)
Data Table on Brazil - Year-over-year growth 2025-2030 (%)

12.6.2 Argentina - Market size and forecast 2025-2030

Chart on Argentina - Market size and forecast 2025-2030 ($ million)
Data Table on Argentina - Market size and forecast 2025-2030 ($ million)
Chart on Argentina - Year-over-year growth 2025-2030 (%)
Data Table on Argentina - Year-over-year growth 2025-2030 (%)

12.6.3 Chile - Market size and forecast 2025-2030

Chart on Chile - Market size and forecast 2025-2030 ($ million)
Data Table on Chile - Market size and forecast 2025-2030 ($ million)
Chart on Chile - Year-over-year growth 2025-2030 (%)
Data Table on Chile - Year-over-year growth 2025-2030 (%)

12.7 Middle East and Africa - Market size and forecast 2025-2030

Chart on Middle East and Africa - Market size and forecast 2025-2030 ($ million)
Data Table on Middle East and Africa - Market size and forecast 2025-2030 ($ million)
Chart on Middle East and Africa - Year-over-year growth 2025-2030 (%)
Data Table on Middle East and Africa - Year-over-year growth 2025-2030 (%)
Chart on Regional Comparison - Middle East and Africa
Data Table on Regional Comparison - Middle East and Africa

12.7.1 Saudi Arabia - Market size and forecast 2025-2030

Chart on Saudi Arabia - Market size and forecast 2025-2030 ($ million)
Data Table on Saudi Arabia - Market size and forecast 2025-2030 ($ million)
Chart on Saudi Arabia - Year-over-year growth 2025-2030 (%)
Data Table on Saudi Arabia - Year-over-year growth 2025-2030 (%)

12.7.2 UAE - Market size and forecast 2025-2030

Chart on UAE - Market size and forecast 2025-2030 ($ million)
Data Table on UAE - Market size and forecast 2025-2030 ($ million)
Chart on UAE - Year-over-year growth 2025-2030 (%)
Data Table on UAE - Year-over-year growth 2025-2030 (%)

12.7.3 South Africa - Market size and forecast 2025-2030

Chart on South Africa - Market size and forecast 2025-2030 ($ million)
Data Table on South Africa - Market size and forecast 2025-2030 ($ million)
Chart on South Africa - Year-over-year growth 2025-2030 (%)
Data Table on South Africa - Year-over-year growth 2025-2030 (%)

12.7.4 Turkey - Market size and forecast 2025-2030

Chart on Turkey - Market size and forecast 2025-2030 ($ million)
Data Table on Turkey - Market size and forecast 2025-2030 ($ million)
Chart on Turkey - Year-over-year growth 2025-2030 (%)
Data Table on Turkey - Year-over-year growth 2025-2030 (%)

12.7.5 Israel - Market size and forecast 2025-2030

Chart on Israel - Market size and forecast 2025-2030 ($ million)
Data Table on Israel - Market size and forecast 2025-2030 ($ million)
Chart on Israel - Year-over-year growth 2025-2030 (%)
Data Table on Israel - Year-over-year growth 2025-2030 (%)

12.8 Market opportunity by geography

Market opportunity by geography ($ million)
Data Tables on Market opportunity by geography ($ million)

13. Drivers, Challenges, and Opportunity

13.1 Market drivers

Rising consumer awareness and education regarding intimate hygiene
Escalating demand for natural, clean label, and microbiome friendly formulations
Proliferation of digital retail and direct to consumer distribution channels

13.2 Market challenges

Navigating stringent regulatory frameworks and clinical testing requirements
Overcoming deep rooted cultural stigmas and societal taboos
Mitigating threat of counterfeit products and formulation misinformation

13.3 Impact of drivers and challenges

Impact of drivers and challenges in 2025 and 2030

13.4 Market opportunities

Premiumization and integration of skincare elements
Emergence of male specific and gender inclusive formulations
Transition toward sustainable and circular packaging solutions

14. Competitive Landscape

14.1 Overview

14.2

Overview on criticality of inputs and factors of differentiation

14.3 Landscape disruption

Overview on factors of disruption

14.4 Industry risks

Impact of key risks on business

15. Competitive Analysis

15.1 Companies profiled

Companies covered

15.2 Company ranking index

15.3 Market positioning of companies

Matrix on companies position and classification

15.4 BuyWOW

BuyWOW - Overview
BuyWOW - Product / Service
BuyWOW - Key offerings
SWOT

15.5 Church and Dwight Co. Inc.

Church and Dwight Co. Inc. - Overview
Church and Dwight Co. Inc. - Business segments
Church and Dwight Co. Inc. - Key offerings
Church and Dwight Co. Inc. - Segment focus
SWOT

15.6 Combe Inc.

Combe Inc. - Overview
Combe Inc. - Product / Service
Combe Inc. - Key offerings
SWOT

15.7 Kimberly Clark Corp.

Kimberly Clark Corp. - Overview
Kimberly Clark Corp. - Business segments
Kimberly Clark Corp. - Key news
Kimberly Clark Corp. - Key offerings
Kimberly Clark Corp. - Segment focus
SWOT

15.8 Love Wellness LLC

Love Wellness LLC - Overview
Love Wellness LLC - Product / Service
Love Wellness LLC - Key offerings
SWOT

15.9 Nua Woman

Nua Woman - Overview
Nua Woman - Product / Service
Nua Woman - Key offerings
SWOT

15.10 Oriflame Cosmetics SA

Oriflame Cosmetics SA - Overview
Oriflame Cosmetics SA - Product / Service
Oriflame Cosmetics SA - Key offerings
SWOT

15.11 Pee Safe Products Pvt. Ltd.

Pee Safe Products Pvt. Ltd. - Overview
Pee Safe Products Pvt. Ltd. - Product / Service
Pee Safe Products Pvt. Ltd. - Key offerings
SWOT

15.12 Plum Goodness

Plum Goodness - Overview
Plum Goodness - Product / Service
Plum Goodness - Key offerings
SWOT

15.13 Procter and Gamble Co.

Procter and Gamble Co. - Overview
Procter and Gamble Co. - Business segments
Procter and Gamble Co. - Key news
Procter and Gamble Co. - Key offerings
Procter and Gamble Co. - Segment focus
SWOT

15.14 Sanofi SA

Sanofi SA - Overview
Sanofi SA - Business segments
Sanofi SA - Key news
Sanofi SA - Key offerings
Sanofi SA - Segment focus
SWOT

15.15 Sebapharma GmbH and Co. KG

Sebapharma GmbH and Co. KG - Overview
Sebapharma GmbH and Co. KG - Product / Service
Sebapharma GmbH and Co. KG - Key offerings
SWOT

15.16 The Avon Co.

The Avon Co. - Overview
The Avon Co. - Product / Service
The Avon Co. - Key offerings
SWOT

15.17 The Himalaya Drug Co.

The Himalaya Drug Co. - Overview
The Himalaya Drug Co. - Product / Service
The Himalaya Drug Co. - Key offerings
SWOT

15.18 Unilever PLC

Unilever PLC - Overview
Unilever PLC - Business segments
Unilever PLC - Key news
Unilever PLC - Key offerings
Unilever PLC - Segment focus
SWOT

16. Appendix

16.1 Scope of the report

Market definition
Objectives
Notes and caveats

16.2 Inclusions and exclusions checklist

Inclusions checklist
Exclusions checklist

16.3 Currency conversion rates for US$

16.4 Research methodology

16.5 Data procurement

Information sources

16.6 Data validation

16.7 Validation techniques employed for market sizing

16.8 Data synthesis

16.9 360 degree market analysis

16.10 List of abbreviations

Research Methodology

Technavio presents a detailed picture of the market by way of study, synthesis, and summation of data from multiple sources. The analysts have presented the various facets of the market with a particular focus on identifying the key industry influencers. The data thus presented is comprehensive, reliable, and the result of extensive research, both primary and secondary.

INFORMATION SOURCES

Primary sources

  • Manufacturers and suppliers
  • Channel partners
  • Industry experts
  • Strategic decision makers

Secondary sources

  • Industry journals and periodicals
  • Government data
  • Financial reports of key industry players
  • Historical data
  • Press releases

DATA ANALYSIS

Data Synthesis

  • Collation of data
  • Estimation of key figures
  • Analysis of derived insights

Data Validation

  • Triangulation with data models
  • Reference against proprietary databases
  • Corroboration with industry experts

REPORT WRITING

Qualitative

  • Market drivers
  • Market challenges
  • Market trends
  • Five forces analysis

Quantitative

  • Market size and forecast
  • Market segmentation
  • Geographical insights
  • Competitive landscape

Interested in this report?

Get your sample now to see our research methodology and insights!

Download Now

Frequently Asked Questions

Intimate Wash market growth will increase by USD 131.7 million during 2026-2030.

The Intimate Wash market is expected to grow at a CAGR of 4.7% during 2026-2030.

Intimate Wash market is segmented by Distribution channel (Offline, Online) End-user (Women, Men, Unisex) Packaging (Bottles, Pumps, Tubes, Sachets, Pouches)

BuyWOW, Church and Dwight Co. Inc., Combe Inc., Good Clean Love Inc., Kimberly Clark Corp., Life Flo, Love Wellness LLC, LYV Life Inc., Nua Woman, Oriflame Cosmetics SA, Pee Safe Products Pvt. Ltd., Plum Goodness, Procter and Gamble Co., Sanofi SA, Sebapharma GmbH and Co. KG, Sirona Hygiene Pvt. Ltd., SweetSpot Labs, The Avon Co., The Himalaya Drug Co., The Honey Pot Co. LLC, Unilever PLC are a few of the key vendors in the Intimate Wash market.

APAC will register the highest growth rate of 30.3% among the other regions. Therefore, the Intimate Wash market in APAC is expected to garner significant business opportunities for the vendors during the forecast period.

Germany, France, UK, Italy, Spain, The Netherlands, US, Canada, Mexico, China, India, Japan, South Korea, Australia, Indonesia, Brazil, Argentina, Chile, Saudi Arabia, UAE, South Africa, Turkey, Israel

  • Rising consumer awareness and education regarding intimate hygiene is the driving factor this market.

The Intimate Wash market vendors should focus on grabbing business opportunities from the Distribution channel segment as it accounted for the largest market share in the base year.
RIA - Research AI Assistant
Ask RIA
