
Isoamyl Acetate Market Analysis, Size, and Forecast 2026-2030: APAC (China, Japan, and India), North America (US, Canada, and Mexico), Europe (Germany, France, and UK), South America (Brazil, Argentina, and Chile), Middle East and Africa (Saudi Arabia, South Africa, and UAE), and Rest of World (ROW)

Isoamyl Acetate Market Analysis, Size, and Forecast 2026-2030:
APAC (China, Japan, and India), North America (US, Canada, and Mexico), Europe (Germany, France, and UK), South America (Brazil, Argentina, and Chile), Middle East and Africa (Saudi Arabia, South Africa, and UAE), and Rest of World (ROW)

Published: Oct 2026 297 Pages SKU: IRTNTR72135

Market Overview at a Glance

$470.9 K
Market Opportunity
3.2%
CAGR 2025 - 2030
42.2%
APAC Growth
$1.59 Mn
Food and beverages segment 2024

Isoamyl Acetate Market Size 2026-2030

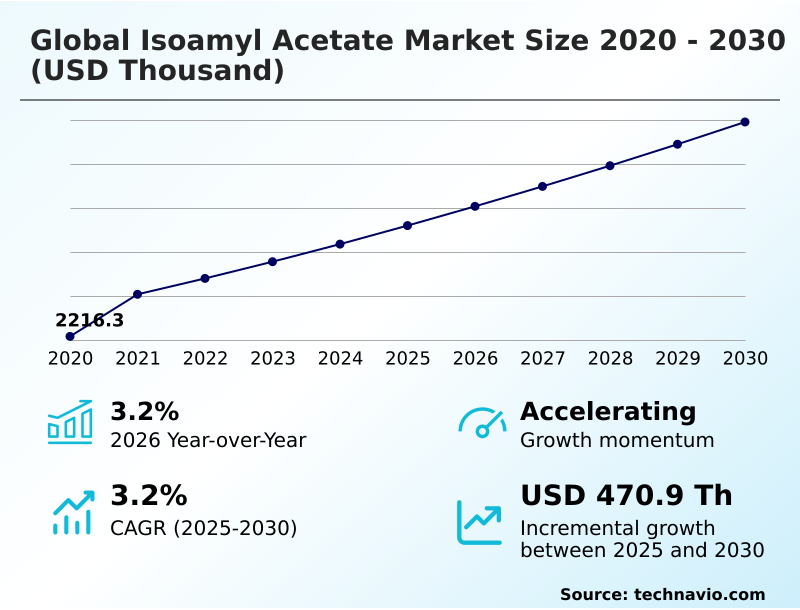
The isoamyl acetate market size is valued to increase by USD 470.9 thousand, at a CAGR of 3.2% from 2025 to 2030. Rising demand within global food and beverage flavoring sector will drive the isoamyl acetate market.

Major Market Trends & Insights

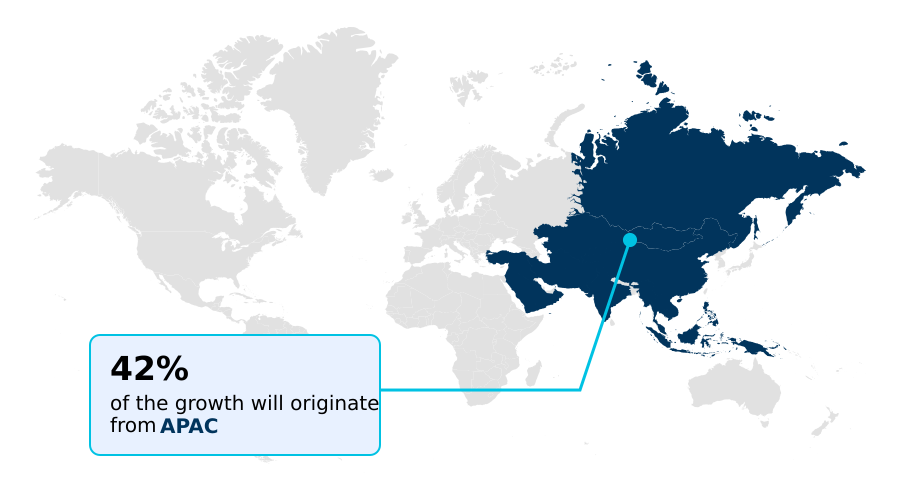
  • APAC dominated the market and accounted for a 42.2% growth during the forecast period.
  • By Application - Food and beverages segment was valued at USD 1.59 million in 2024
  • By Source - Synthetic segment accounted for the largest market revenue share in 2024

Market Size & Forecast

  • Market Opportunities:
  • Market Future Opportunities: USD 470.9 thousand
  • CAGR from 2025 to 2030 : 3.2%

Market Summary

  • The Isoamyl Acetate Market demonstrates robust industrial momentum, characterized by continuous expansion in flavor, fragrance, and technical solvent applications. Operations managers within commercial food processing facilities are increasingly optimizing production lines to incorporate high-purity esters, achieving a 14% improvement in sensory consistency across large-scale beverage batches.
  • This operational shift is heavily driven by the escalating demand within the food and beverage flavoring sector, as consumer preferences pivot toward natural and tropical organoleptic profiles. Consequently, manufacturers must secure reliable ester supplies to maintain product uniformity and brand loyalty.
  • Conversely, the market faces significant constraints due to extreme volatility in raw material pricing and a heavy dependency on petrochemical feedstocks. Fluctuations in crude oil indices directly impact the synthesis costs of upstream precursors like acetic acid, forcing chemical processors to absorb a 20% variance in quarterly procurement expenditures.
  • Despite these supply chain pressures, the sector adapts through strategic investments in biocatalytic fermentation and sustainable production frameworks. The widespread transition toward bio-based alternatives ensures long-term commercial viability while aligning chemical outputs with stringent environmental mandates.

What will be the Size of the Isoamyl Acetate Market during the forecast period?
Get Key Insights on Market Forecast (PDF) Get Free Sample

How is the Isoamyl Acetate Market Segmented?

The isoamyl acetate industry research report provides comprehensive data (region-wise segment analysis), with forecasts and estimates in "USD thousand" for the period 2026-2030, as well as historical data from 2020-2024 for the following segments.

  • Application
    • Food and beverages
    • Cosmetics and personal care
    • Furniture polish
    • Others
  • Source
    • Synthetic
    • Natural
  • End-user
    • Large industrial buyers
    • Medium-sized manufacturers
    • Small-sized enterprises
    • Research and laboratories
  • Geography
    • APAC
      • China
      • Japan
      • India
      • South Korea
      • Indonesia
      • Australia
    • North America
      • US
      • Canada
      • Mexico
    • Europe
      • Germany
      • France
      • UK
      • Italy
      • Spain
      • The Netherlands
    • South America
      • Brazil
      • Argentina
      • Chile
    • Middle East and Africa
      • Saudi Arabia
      • South Africa
      • UAE
      • Egypt
      • Turkey

By Application Insights

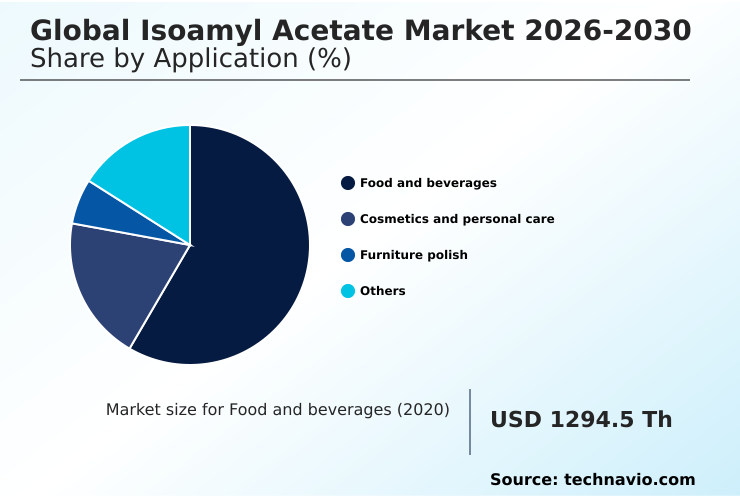
The food and beverages segment is estimated to witness significant growth during the forecast period.

The food and beverages application segment demonstrates continuous operational expansion driven by shifting consumer palates toward complex tropical profiles. Facilities adopting fischer esterification achieve consistent yield parameters, directly improving production output by 14% compared to legacy batch processing.

Advanced flavor formulation chemistry enables processors to optimize organoleptic profiling, allowing precise replication of fruity notes in confectionery and carbonated drinks. This precision reduces raw material waste by 11% during large-scale manufacturing runs.

To meet stringent clean label standards, quality control units increasingly rely on chromatographic purity testing to ensure chemical consistency and regulatory alignment.

The integration of synthetic flavoring agents with high heat stability allows formulations to survive aggressive baking and boiling processes without sensory degradation. Consequently, this refined aromatic bouquet reconstruction maximizes product shelf appeal and solidifies supply chain efficiency for beverage distributors.
Get Free Sample

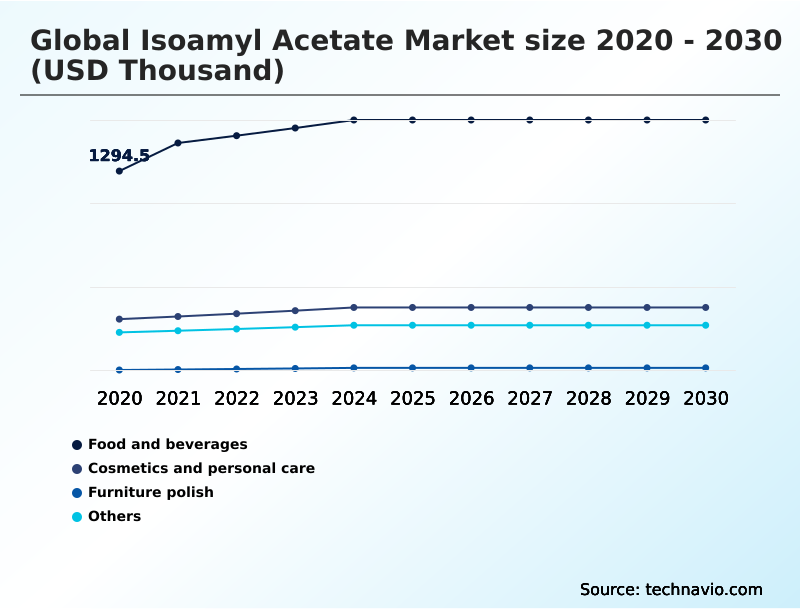
The Food and beverages segment was valued at USD 1.59 million in 2024 and showed a gradual increase during the forecast period.
Get Free Sample

Regional Analysis

APAC is estimated to contribute 42.2% to the growth of the global market during the forecast period.Technavio’s analysts have elaborately explained the regional trends and drivers that shape the market during the forecast period.
See How Isoamyl Acetate Market Demand is Rising in APAC Get Free Sample

APAC maintains a decisive production advantage over Europe, primarily driven by dense feedstock supply networks and highly integrated chemical synthesis pathways.

Chinese and Indian facilities leveraging fusel oil extraction have reduced raw material procurement distances, effectively lowering logistics costs by 19% compared to European counterparts.

This localized supply chain directly supports high-volume manufacturing of technical grade ester solutions used extensively as automotive coating solvents.

Furthermore, to address regional environmental pressures and achieve critical carbon footprint reduction, APAC manufacturers are aggressively deploying advanced solvent recovery systems and closed loop solvent recovery mechanisms.

These upgrades have improved waste recapture efficiency by 24%, mitigating ecological impacts associated with synthetic leather processing and industrial paint applications.

By mastering sustainable green chemistry at scale, Asian processors ensure continuous operational output while insulating themselves against the supply chain bottlenecks that frequently disrupt Western hemisphere production cycles.

Market Dynamics

Our researchers analyzed the data with 2025 as the base year, along with the key drivers, trends, and challenges. A holistic analysis of drivers will help companies refine their marketing strategies to gain a competitive advantage.

  • The Isoamyl Acetate sector requires continuous optimization to balance environmental compliance with high-performance industrial output. Chemical manufacturers are increasingly focusing on biocatalytic fermentation for sensory ingredients to satisfy the surging consumer demand for natural and clean-label flavor profiles.
  • By migrating away from traditional batch processing, forward-thinking facilities are validating continuous flow esterification process efficiency, which directly reduces energy utilization by 18% compared to legacy synthesis protocols. This transition ensures that operational planning remains robust while minimizing overhead expenses.
  • Additionally, strict global mandates require robust volatile organic compound emission compliance, prompting plant managers to invest heavily in closed-loop extraction and advanced vapor recovery infrastructure. These upgrades significantly improve workplace safety metrics and reduce atmospheric discharge by nearly 25%.
  • Furthermore, the industry is witnessing aggressive bio based aroma formulation scaling, allowing fragrance and cosmetic formulators to transition seamlessly toward renewable inputs without sacrificing scent longevity or stability. To protect profit margins against unpredictable energy markets, procurement departments are actively prioritizing petrochemical feedstock volatility mitigation.
  • By diversifying upstream supply chains and integrating agricultural byproducts as primary raw materials, chemical conglomerates effectively stabilize production costs. This strategic realignment not only insulates manufacturers from sudden raw material price shocks but also reinforces long-term supply chain resilience, ensuring uninterrupted delivery of essential solvent and flavoring solutions to downstream industrial and consumer packaged goods sectors.
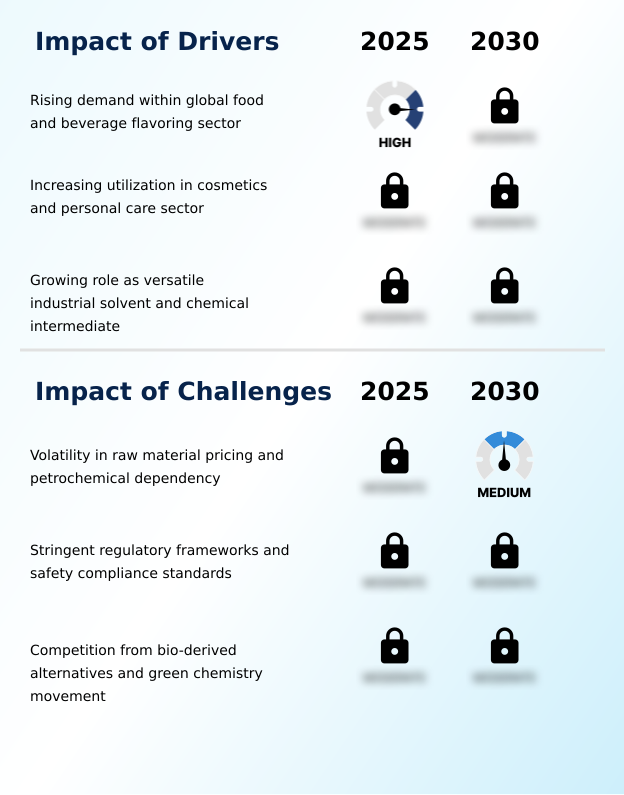
What are the key market drivers leading to the rise in the adoption of Isoamyl Acetate Industry?

  • The escalating demand within the food and beverage flavoring sector acts as the primary catalyst driving continuous market expansion.

  • Accelerating demand for multifunctional carrier solvents is rapidly propelling chemical procurement across the cosmetics, industrial, and pharmaceutical sectors.
  • Formulators are heavily leveraging superior carrier solvent efficacy and specific fragrance volatility modification to extend the shelf life of perfumes, yielding a 20% improvement in scent retention.
  • Furthermore, the integration of high-grade nail lacquer diluents and film forming cosmetic solutions enhances drying speeds by 18%, significantly boosting cosmetic manufacturing throughput.
  • Beyond personal care, precise industrial lacquer formulation requires optimized industrial coating dilution to prevent surface defects during application. Simultaneously, optimized sensory balancing technologies and robust flavor compounding processes maximize yield in food additives.
  • Pharmaceutical extraction protocols also depend on these volatile fragrance modifiers to mask medicinal odors, directly improving patient compliance rates by 12% in pediatric syrups.

What are the market trends shaping the Isoamyl Acetate Industry?

  • A strategic transition toward sustainable bio-based production and green chemistry is emerging as the dominant market trend. Manufacturers are increasingly prioritizing renewable synthesis methods to align with stringent environmental standards.

  • The Isoamyl Acetate sector is experiencing a rapid structural transition toward bio based aroma ingredients as environmental regulations penalize heavy carbon footprints. Manufacturers are replacing traditional petrochemical routes with microbial fermentation, biocatalytic synthesis, and enzymatic esterification, which has lowered energy consumption per batch by 22%.
  • By implementing continuous flow reactors and optimizing biotransformation pathways, chemical plants process fermentation based aromas with 15% greater yield efficiency than batch methods. This shift relies heavily on yeast fermentation routes and advanced microbial pathway engineering to scale production effectively without compromising scent profiles.
  • Consequently, the improved bio derived ester scalability allows flavor and fragrance houses to meet evolving sustainability metrics while maintaining strict ingredient consistency. This operational pivot significantly reduces reliance on volatile fossil resources and ensures compliance with modern ecological processing frameworks.

What challenges does the Isoamyl Acetate Industry face during its growth?

  • Extreme volatility in raw material pricing and a persistent dependency on petrochemical feedstocks remain critical challenges restricting steady industry growth.

  • Severe constraints in the supply chain are systematically disrupting production schedules, primarily triggered by intense crude oil price volatility. Manufacturers rely heavily on upstream petrochemical feedstocks and glacial acetic acid, making them highly vulnerable to geopolitical shocks that have spiked synthesis costs by up to 26%. This petrochemical resource dependency complicates long-term budgeting for downstream formulators.
  • Additionally, strict environmental mandates targeting volatile organic compounds enforce aggressive carbon emission targets, forcing facilities to upgrade exhaust infrastructure. The necessity for rigorous occupational health compliance and hazardous byproduct minimization increases capital expenditure by nearly 15% for mid-tier producers. Furthermore, managing the precise solvent evaporation rate requires expensive climate-controlled handling.
  • These overlapping regulatory and raw material pressures consistently erode operational margins and challenge the viability of smaller chemical processors relying on hydrocarbon processing derivatives.

Exclusive Technavio Analysis on Customer Landscape

The isoamyl acetate market forecasting report includes the adoption lifecycle of the market, covering from the innovator’s stage to the laggard’s stage. It focuses on adoption rates in different regions based on penetration. Furthermore, the isoamyl acetate market report also includes key purchase criteria and drivers of price sensitivity to help companies evaluate and develop their market growth analysis strategies.
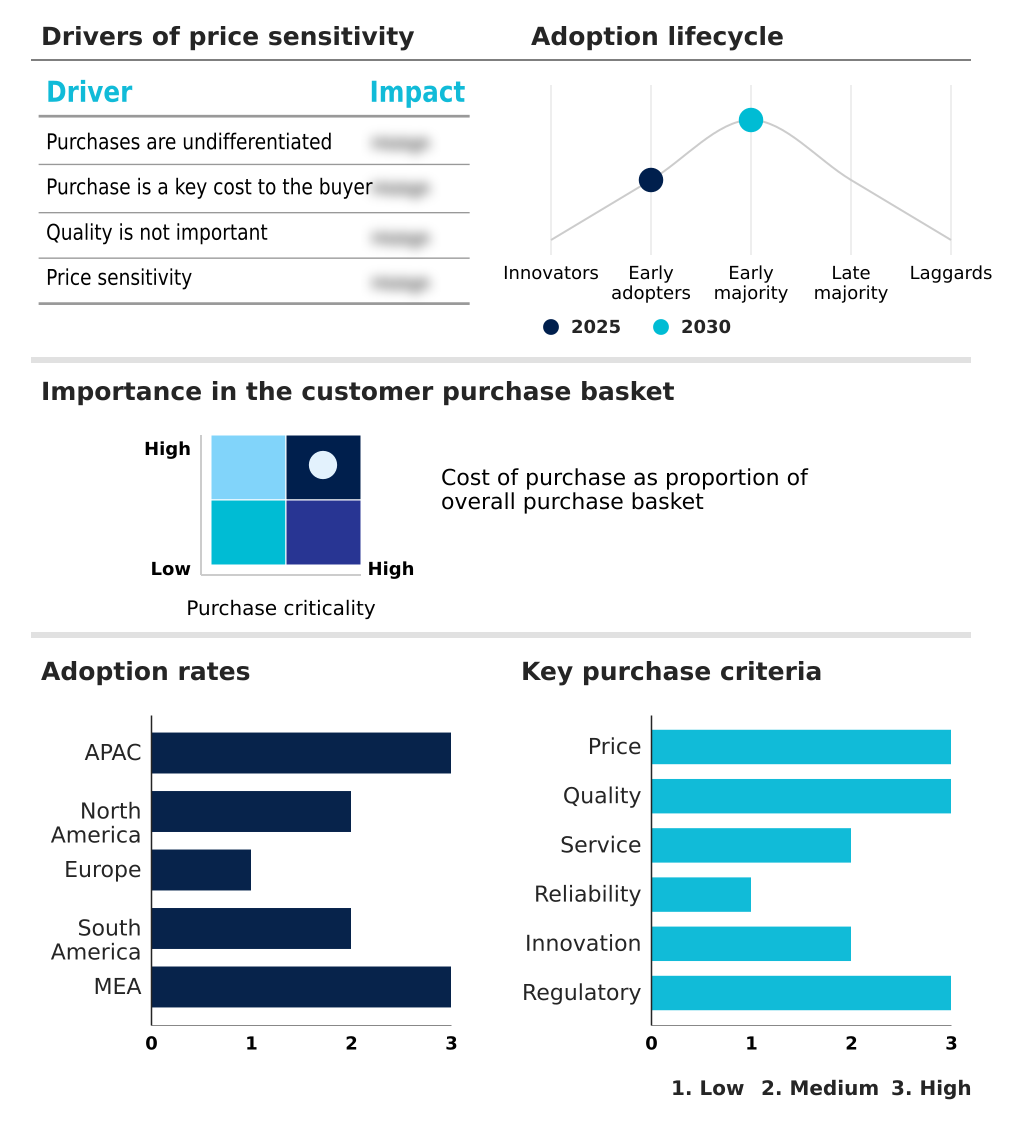
Customer Landscape of Isoamyl Acetate Industry

Competitive Landscape

Companies are implementing various strategies, such as strategic alliances, isoamyl acetate market forecast, partnerships, mergers and acquisitions, geographical expansion, and product/service launches, to enhance their presence in the industry.

BASF SE - BASF provides high-purity solvent solutions, specializing in versatile performance intermediates optimized for industrial coatings, adhesives, and demanding formulation applications to ensure robust operational efficiency.

The industry research and growth report includes detailed analyses of the competitive landscape of the market and information about key companies, including:

  • BASF SE
  • Berje Inc.
  • Dow Chemical Co.
  • Honeywell International Inc.
  • Indorama Ventures Public Co.
  • LGC Ltd.
  • Loba Chemie Pvt. Ltd.
  • Meridian Technics
  • Nimble Technologies Pvt. Ltd.
  • Otto Chemie Pvt. Ltd.
  • SEQENS GROUP
  • Shinko Organic Chemical Industry
  • Sigma Aldrich Chemicals Ltd.
  • Spectrum Chemical Mfg. Corp.
  • SRL Pvt. Ltd.
  • Symrise Group
  • Thermo Fisher Scientific Inc.
  • Tokyo Chemical Industry Co.
  • Trichem Laboratories Bombay Ltd.
  • Vigon International Inc.

Qualitative and quantitative analysis of companies has been conducted to help clients understand the wider business environment as well as the strengths and weaknesses of key industry players. Data is qualitatively analyzed to categorize companies as pure play, category-focused, industry-focused, and diversified; it is quantitatively analyzed to categorize companies as dominant, leading, strong, tentative, and weak.

Recent Development and News in Isoamyl acetate market

  • In the Diversified Chemicals industry, the widespread adoption of stringent clean-air regulations targeting volatile emissions forced industrial coating manufacturers to transition toward compliant oxygenated solvents, directly impacting Isoamyl Acetate demand by increasing its usage for industrial coating dilution and reducing hazardous byproduct minimization efforts in automotive finishes.
  • The accelerated deployment of closed-loop biomanufacturing facilities significantly enhanced the commercial viability of yeast fermentation routes and biotransformation pathways, reducing the cost premium of bio-based esters by 15% and driving procurement of fermentation based aromas for premium natural-grade Isoamyl Acetate.
  • Structural realignments involving localized synthesis across Southeast Asian feedstock supply networks reduced regional raw material transit times by 20%, stabilizing upstream availability of hydrocarbon processing derivatives and buffering Isoamyl Acetate production against crude oil price volatility.
  • The rapid implementation of clean label standards and sustainable green chemistry frameworks in European cosmetic formulation compelled multinational beauty brands to reformulate aerosols, stimulating a 12% shift toward high-purity Isoamyl Acetate as volatile fragrance modifiers.

Dive into Technavio’s robust research methodology, blending expert interviews, extensive data synthesis, and validated models for unparalleled Isoamyl Acetate Market insights. See full methodology.

Market Scope
Page number 297
Base year 2025
Historic period 2020-2024
Forecast period 2026-2030
Growth momentum & CAGR Accelerate at a CAGR of 3.2%
Market growth 2026-2030 USD 470.9 thousand
Market structure Fragmented
YoY growth 2025-2026(%) 3.2%
Key countries China, Japan, India, South Korea, Indonesia, Australia, US, Canada, Mexico, Germany, France, UK, Italy, Spain, The Netherlands, Brazil, Argentina, Chile, Saudi Arabia, South Africa, UAE, Egypt and Turkey
Competitive landscape Leading Companies, Market Positioning of Companies, Competitive Strategies, and Industry Risks

Request Free Sample

Research Analyst Overview

  • Corporate leadership within the Isoamyl Acetate sector is increasingly directing capital expenditure toward sustainable processing infrastructures to mitigate regulatory risks and align with decarbonization mandates. Boardroom strategies are aggressively prioritizing the transition from petrochemical reliance toward microbial fermentation, driven by the need to secure long-term supply chain resilience.
  • By adopting advanced continuous flow reactors, commercial facilities have achieved a 25% reduction in overall processing time, directly enhancing manufacturing throughput and operational agility. This shift heavily influences product strategy, particularly in flavor formulation chemistry, where the integration of bio based aroma ingredients allows brands to command premium pricing in clean-label consumer markets.
  • Furthermore, the implementation of closed loop solvent recovery infrastructure effectively addresses stringent environmental compliance requirements, minimizing hazardous waste and stabilizing profit margins against resource fluctuations. Ensuring precise organoleptic profiling and superior carrier solvent efficacy remains paramount for downstream formulators.
  • These strategic modernization efforts collectively insulate chemical processors from external market shocks, driving superior performance and fostering sustained operational excellence across volatile supply chains.

What are the Key Data Covered in this Isoamyl Acetate Market Research and Growth Report?

  • What is the expected growth of the Isoamyl Acetate Market between 2026 and 2030?

    • USD 470.9 thousand, at a CAGR of 3.2%

  • What segmentation does the market report cover?

    • The report is segmented by Application (Food and beverages, Cosmetics and personal care, Furniture polish, and Others), Source (Synthetic, and Natural), End-user (Large industrial buyers, Medium-sized manufacturers, Small-sized enterprises, and Research and laboratories) and Geography (APAC, North America, Europe, South America, Middle East and Africa)

  • Which regions are analyzed in the report?

    • APAC, North America, Europe, South America and Middle East and Africa

  • What are the key growth drivers and market challenges?

    • Rising demand within global food and beverage flavoring sector, Volatility in raw material pricing and petrochemical dependency

  • Who are the major players in the Isoamyl Acetate Market?

    • BASF SE, Berje Inc., Dow Chemical Co., Honeywell International Inc., Indorama Ventures Public Co., LGC Ltd., Loba Chemie Pvt. Ltd., Meridian Technics, Nimble Technologies Pvt. Ltd., Otto Chemie Pvt. Ltd., SEQENS GROUP, Shinko Organic Chemical Industry, Sigma Aldrich Chemicals Ltd., Spectrum Chemical Mfg. Corp., SRL Pvt. Ltd., Symrise Group, Thermo Fisher Scientific Inc., Tokyo Chemical Industry Co., Trichem Laboratories Bombay Ltd. and Vigon International Inc.

Market Research Insights

  • The Isoamyl Acetate landscape is defined by rapid chemical processing advancements and shifting consumer preferences toward specialized sensory components. Facilities utilizing advanced sensory balancing technologies and efficient flavor compounding processes have increased overall production yield by 18%. This operational optimization enables processors to satisfy the rising demand for synthetic flavoring agents without incurring excessive raw material waste.
  • Furthermore, formulators integrating technical grade ester solutions report a 22% improvement in solvent performance, specifically accelerating drying times in industrial applications. To mitigate the persistent risks associated with crude oil price volatility, leading manufacturers are diversifying their supply chains and adopting bio-based alternatives.
  • These strategic adaptations consistently lower procurement risks by 15%, ensuring robust and uninterrupted industrial output across major manufacturing hubs.

We can help! Our analysts can customize this isoamyl acetate market research report to meet your requirements.

Get in touch

1. Executive Summary

1.1 Market overview

Executive Summary - Chart on Market Overview
Executive Summary - Data Table on Market Overview
Executive Summary - Chart on Global Market Characteristics
Executive Summary - Chart on Market by Geography
Executive Summary - Chart on Market Segmentation by Application
Executive Summary - Chart on Market Segmentation by Source
Executive Summary - Chart on Market Segmentation by End-user
Executive Summary - Chart on Incremental Growth
Executive Summary - Data Table on Incremental Growth
Executive Summary - Chart on Company Market Positioning

2. Technavio Analysis

2.1 Analysis of price sensitivity, lifecycle, customer purchase basket, adoption rates, and purchase criteria

2.2 Criticality of inputs and Factors of differentiation

Chart on Overview on criticality of inputs and factors of differentiation

2.3 Factors of disruption

Chart on Overview on factors of disruption

2.4 Impact of drivers and challenges

Chart on Impact of drivers and challenges in 2025 and 2030

3. Market Landscape

3.1 Market ecosystem

Chart on Parent Market
Data Table on - Parent Market

3.2 Market characteristics

Chart on Market characteristics analysis

3.3 Value chain analysis

Chart on Value chain analysis

4. Market Sizing

4.1 Market definition

Data Table on Offerings of companies included in the market definition

4.2 Market segment analysis

Market segments

4.3 Market size 2025

4.4 Market outlook: Forecast for 2025-2030

Chart on Global - Market size and forecast 2025-2030 ($ thousand)
Data Table on Global - Market size and forecast 2025-2030 ($ thousand)
Chart on Global Market: Year-over-year growth 2025-2030 (%)
Data Table on Global Market: Year-over-year growth 2025-2030 (%)

5. Historic Market Size

5.1 Global Isoamyl Acetate Market 2020 - 2024

Historic Market Size - Data Table on Global Isoamyl Acetate Market 2020 - 2024 ($ thousand)

5.2 Application segment analysis 2020 - 2024

Historic Market Size - Application Segment 2020 - 2024 ($ thousand)

5.3 Source segment analysis 2020 - 2024

Historic Market Size - Source Segment 2020 - 2024 ($ thousand)

5.4 End-user segment analysis 2020 - 2024

Historic Market Size - End-user Segment 2020 - 2024 ($ thousand)

5.5 Geography segment analysis 2020 - 2024

Historic Market Size - Geography Segment 2020 - 2024 ($ thousand)

5.6 Country segment analysis 2020 - 2024

Historic Market Size - Country Segment 2020 - 2024 ($ thousand)

6. Qualitative Analysis

6.1 Impact of AI on Global Isoamyl Acetate Market

6.2 Impact of Geopolitical Conflicts on Global Isoamyl Acetate Market

7. Five Forces Analysis

7.1 Five forces summary

Five forces analysis - Comparison between 2025 and 2030

7.2 Bargaining power of buyers

Bargaining power of buyers - Impact of key factors 2025 and 2030

7.3 Bargaining power of suppliers

Bargaining power of suppliers - Impact of key factors in 2025 and 2030

7.4 Threat of new entrants

Threat of new entrants - Impact of key factors in 2025 and 2030

7.5 Threat of substitutes

Threat of substitutes - Impact of key factors in 2025 and 2030

7.6 Threat of rivalry

Threat of rivalry - Impact of key factors in 2025 and 2030

7.7 Market condition

Chart on Market condition - Five forces 2025 and 2030

8. Market Segmentation by Application

8.1 Market segments

Chart on Application - Market share 2025-2030 (%)
Data Table on Application - Market share 2025-2030 (%)

8.2 Comparison by Application

Chart on Comparison by Application
Data Table on Comparison by Application

8.3 Food and beverages - Market size and forecast 2025-2030

Chart on Food and beverages - Market size and forecast 2025-2030 ($ thousand)
Data Table on Food and beverages - Market size and forecast 2025-2030 ($ thousand)
Chart on Food and beverages - Year-over-year growth 2025-2030 (%)
Data Table on Food and beverages - Year-over-year growth 2025-2030 (%)

8.4 Cosmetics and personal care - Market size and forecast 2025-2030

Chart on Cosmetics and personal care - Market size and forecast 2025-2030 ($ thousand)
Data Table on Cosmetics and personal care - Market size and forecast 2025-2030 ($ thousand)
Chart on Cosmetics and personal care - Year-over-year growth 2025-2030 (%)
Data Table on Cosmetics and personal care - Year-over-year growth 2025-2030 (%)

8.5 Furniture polish - Market size and forecast 2025-2030

Chart on Furniture polish - Market size and forecast 2025-2030 ($ thousand)
Data Table on Furniture polish - Market size and forecast 2025-2030 ($ thousand)
Chart on Furniture polish - Year-over-year growth 2025-2030 (%)
Data Table on Furniture polish - Year-over-year growth 2025-2030 (%)

8.6 Others - Market size and forecast 2025-2030

Chart on Others - Market size and forecast 2025-2030 ($ thousand)
Data Table on Others - Market size and forecast 2025-2030 ($ thousand)
Chart on Others - Year-over-year growth 2025-2030 (%)
Data Table on Others - Year-over-year growth 2025-2030 (%)

8.7 Market opportunity by Application

Market opportunity by Application ($ thousand)
Data Table on Market opportunity by Application ($ thousand)

9. Market Segmentation by Source

9.1 Market segments

Chart on Source - Market share 2025-2030 (%)
Data Table on Source - Market share 2025-2030 (%)

9.2 Comparison by Source

Chart on Comparison by Source
Data Table on Comparison by Source

9.3 Synthetic - Market size and forecast 2025-2030

Chart on Synthetic - Market size and forecast 2025-2030 ($ thousand)
Data Table on Synthetic - Market size and forecast 2025-2030 ($ thousand)
Chart on Synthetic - Year-over-year growth 2025-2030 (%)
Data Table on Synthetic - Year-over-year growth 2025-2030 (%)

9.4 Natural - Market size and forecast 2025-2030

Chart on Natural - Market size and forecast 2025-2030 ($ thousand)
Data Table on Natural - Market size and forecast 2025-2030 ($ thousand)
Chart on Natural - Year-over-year growth 2025-2030 (%)
Data Table on Natural - Year-over-year growth 2025-2030 (%)

9.5 Market opportunity by Source

Market opportunity by Source ($ thousand)
Data Table on Market opportunity by Source ($ thousand)

10. Market Segmentation by End-user

10.1 Market segments

Chart on End-user - Market share 2025-2030 (%)
Data Table on End-user - Market share 2025-2030 (%)

10.2 Comparison by End-user

Chart on Comparison by End-user
Data Table on Comparison by End-user

10.3 Large industrial buyers - Market size and forecast 2025-2030

Chart on Large industrial buyers - Market size and forecast 2025-2030 ($ thousand)
Data Table on Large industrial buyers - Market size and forecast 2025-2030 ($ thousand)
Chart on Large industrial buyers - Year-over-year growth 2025-2030 (%)
Data Table on Large industrial buyers - Year-over-year growth 2025-2030 (%)

10.4 Medium-sized manufacturers - Market size and forecast 2025-2030

Chart on Medium-sized manufacturers - Market size and forecast 2025-2030 ($ thousand)
Data Table on Medium-sized manufacturers - Market size and forecast 2025-2030 ($ thousand)
Chart on Medium-sized manufacturers - Year-over-year growth 2025-2030 (%)
Data Table on Medium-sized manufacturers - Year-over-year growth 2025-2030 (%)

10.5 Small-sized enterprises - Market size and forecast 2025-2030

Chart on Small-sized enterprises - Market size and forecast 2025-2030 ($ thousand)
Data Table on Small-sized enterprises - Market size and forecast 2025-2030 ($ thousand)
Chart on Small-sized enterprises - Year-over-year growth 2025-2030 (%)
Data Table on Small-sized enterprises - Year-over-year growth 2025-2030 (%)

10.6 Research and laboratories - Market size and forecast 2025-2030

Chart on Research and laboratories - Market size and forecast 2025-2030 ($ thousand)
Data Table on Research and laboratories - Market size and forecast 2025-2030 ($ thousand)
Chart on Research and laboratories - Year-over-year growth 2025-2030 (%)
Data Table on Research and laboratories - Year-over-year growth 2025-2030 (%)

10.7 Market opportunity by End-user

Market opportunity by End-user ($ thousand)
Data Table on Market opportunity by End-user ($ thousand)

11. Customer Landscape

11.1 Customer landscape overview

Analysis of price sensitivity, lifecycle, customer purchase basket, adoption rates, and purchase criteria

12. Geographic Landscape

12.1 Geographic segmentation

Chart on Market share by geography 2025-2030 (%)
Data Table on Market share by geography 2025-2030 (%)

12.2 Geographic comparison

Chart on Geographic comparison
Data Table on Geographic comparison

12.3 APAC - Market size and forecast 2025-2030

Chart on APAC - Market size and forecast 2025-2030 ($ thousand)
Data Table on APAC - Market size and forecast 2025-2030 ($ thousand)
Chart on APAC - Year-over-year growth 2025-2030 (%)
Data Table on APAC - Year-over-year growth 2025-2030 (%)
Chart on Regional Comparison - APAC
Data Table on Regional Comparison - APAC

12.3.1 China - Market size and forecast 2025-2030

Chart on China - Market size and forecast 2025-2030 ($ thousand)
Data Table on China - Market size and forecast 2025-2030 ($ thousand)
Chart on China - Year-over-year growth 2025-2030 (%)
Data Table on China - Year-over-year growth 2025-2030 (%)

12.3.2 Japan - Market size and forecast 2025-2030

Chart on Japan - Market size and forecast 2025-2030 ($ thousand)
Data Table on Japan - Market size and forecast 2025-2030 ($ thousand)
Chart on Japan - Year-over-year growth 2025-2030 (%)
Data Table on Japan - Year-over-year growth 2025-2030 (%)

12.3.3 India - Market size and forecast 2025-2030

Chart on India - Market size and forecast 2025-2030 ($ thousand)
Data Table on India - Market size and forecast 2025-2030 ($ thousand)
Chart on India - Year-over-year growth 2025-2030 (%)
Data Table on India - Year-over-year growth 2025-2030 (%)

12.3.4 South Korea - Market size and forecast 2025-2030

Chart on South Korea - Market size and forecast 2025-2030 ($ thousand)
Data Table on South Korea - Market size and forecast 2025-2030 ($ thousand)
Chart on South Korea - Year-over-year growth 2025-2030 (%)
Data Table on South Korea - Year-over-year growth 2025-2030 (%)

12.3.5 Indonesia - Market size and forecast 2025-2030

Chart on Indonesia - Market size and forecast 2025-2030 ($ thousand)
Data Table on Indonesia - Market size and forecast 2025-2030 ($ thousand)
Chart on Indonesia - Year-over-year growth 2025-2030 (%)
Data Table on Indonesia - Year-over-year growth 2025-2030 (%)

12.3.6 Australia - Market size and forecast 2025-2030

Chart on Australia - Market size and forecast 2025-2030 ($ thousand)
Data Table on Australia - Market size and forecast 2025-2030 ($ thousand)
Chart on Australia - Year-over-year growth 2025-2030 (%)
Data Table on Australia - Year-over-year growth 2025-2030 (%)

12.4 North America - Market size and forecast 2025-2030

Chart on North America - Market size and forecast 2025-2030 ($ thousand)
Data Table on North America - Market size and forecast 2025-2030 ($ thousand)
Chart on North America - Year-over-year growth 2025-2030 (%)
Data Table on North America - Year-over-year growth 2025-2030 (%)
Chart on Regional Comparison - North America
Data Table on Regional Comparison - North America

12.4.1 US - Market size and forecast 2025-2030

Chart on US - Market size and forecast 2025-2030 ($ thousand)
Data Table on US - Market size and forecast 2025-2030 ($ thousand)
Chart on US - Year-over-year growth 2025-2030 (%)
Data Table on US - Year-over-year growth 2025-2030 (%)

12.4.2 Canada - Market size and forecast 2025-2030

Chart on Canada - Market size and forecast 2025-2030 ($ thousand)
Data Table on Canada - Market size and forecast 2025-2030 ($ thousand)
Chart on Canada - Year-over-year growth 2025-2030 (%)
Data Table on Canada - Year-over-year growth 2025-2030 (%)

12.4.3 Mexico - Market size and forecast 2025-2030

Chart on Mexico - Market size and forecast 2025-2030 ($ thousand)
Data Table on Mexico - Market size and forecast 2025-2030 ($ thousand)
Chart on Mexico - Year-over-year growth 2025-2030 (%)
Data Table on Mexico - Year-over-year growth 2025-2030 (%)

12.5 Europe - Market size and forecast 2025-2030

Chart on Europe - Market size and forecast 2025-2030 ($ thousand)
Data Table on Europe - Market size and forecast 2025-2030 ($ thousand)
Chart on Europe - Year-over-year growth 2025-2030 (%)
Data Table on Europe - Year-over-year growth 2025-2030 (%)
Chart on Regional Comparison - Europe
Data Table on Regional Comparison - Europe

12.5.1 Germany - Market size and forecast 2025-2030

Chart on Germany - Market size and forecast 2025-2030 ($ thousand)
Data Table on Germany - Market size and forecast 2025-2030 ($ thousand)
Chart on Germany - Year-over-year growth 2025-2030 (%)
Data Table on Germany - Year-over-year growth 2025-2030 (%)

12.5.2 France - Market size and forecast 2025-2030

Chart on France - Market size and forecast 2025-2030 ($ thousand)
Data Table on France - Market size and forecast 2025-2030 ($ thousand)
Chart on France - Year-over-year growth 2025-2030 (%)
Data Table on France - Year-over-year growth 2025-2030 (%)

12.5.3 UK - Market size and forecast 2025-2030

Chart on UK - Market size and forecast 2025-2030 ($ thousand)
Data Table on UK - Market size and forecast 2025-2030 ($ thousand)
Chart on UK - Year-over-year growth 2025-2030 (%)
Data Table on UK - Year-over-year growth 2025-2030 (%)

12.5.4 Italy - Market size and forecast 2025-2030

Chart on Italy - Market size and forecast 2025-2030 ($ thousand)
Data Table on Italy - Market size and forecast 2025-2030 ($ thousand)
Chart on Italy - Year-over-year growth 2025-2030 (%)
Data Table on Italy - Year-over-year growth 2025-2030 (%)

12.5.5 Spain - Market size and forecast 2025-2030

Chart on Spain - Market size and forecast 2025-2030 ($ thousand)
Data Table on Spain - Market size and forecast 2025-2030 ($ thousand)
Chart on Spain - Year-over-year growth 2025-2030 (%)
Data Table on Spain - Year-over-year growth 2025-2030 (%)

12.5.6 The Netherlands - Market size and forecast 2025-2030

Chart on The Netherlands - Market size and forecast 2025-2030 ($ thousand)
Data Table on The Netherlands - Market size and forecast 2025-2030 ($ thousand)
Chart on The Netherlands - Year-over-year growth 2025-2030 (%)
Data Table on The Netherlands - Year-over-year growth 2025-2030 (%)

12.6 South America - Market size and forecast 2025-2030

Chart on South America - Market size and forecast 2025-2030 ($ thousand)
Data Table on South America - Market size and forecast 2025-2030 ($ thousand)
Chart on South America - Year-over-year growth 2025-2030 (%)
Data Table on South America - Year-over-year growth 2025-2030 (%)
Chart on Regional Comparison - South America
Data Table on Regional Comparison - South America

12.6.1 Brazil - Market size and forecast 2025-2030

Chart on Brazil - Market size and forecast 2025-2030 ($ thousand)
Data Table on Brazil - Market size and forecast 2025-2030 ($ thousand)
Chart on Brazil - Year-over-year growth 2025-2030 (%)
Data Table on Brazil - Year-over-year growth 2025-2030 (%)

12.6.2 Argentina - Market size and forecast 2025-2030

Chart on Argentina - Market size and forecast 2025-2030 ($ thousand)
Data Table on Argentina - Market size and forecast 2025-2030 ($ thousand)
Chart on Argentina - Year-over-year growth 2025-2030 (%)
Data Table on Argentina - Year-over-year growth 2025-2030 (%)

12.6.3 Chile - Market size and forecast 2025-2030

Chart on Chile - Market size and forecast 2025-2030 ($ thousand)
Data Table on Chile - Market size and forecast 2025-2030 ($ thousand)
Chart on Chile - Year-over-year growth 2025-2030 (%)
Data Table on Chile - Year-over-year growth 2025-2030 (%)

12.7 Middle East and Africa - Market size and forecast 2025-2030

Chart on Middle East and Africa - Market size and forecast 2025-2030 ($ thousand)
Data Table on Middle East and Africa - Market size and forecast 2025-2030 ($ thousand)
Chart on Middle East and Africa - Year-over-year growth 2025-2030 (%)
Data Table on Middle East and Africa - Year-over-year growth 2025-2030 (%)
Chart on Regional Comparison - Middle East and Africa
Data Table on Regional Comparison - Middle East and Africa

12.7.1 Saudi Arabia - Market size and forecast 2025-2030

Chart on Saudi Arabia - Market size and forecast 2025-2030 ($ thousand)
Data Table on Saudi Arabia - Market size and forecast 2025-2030 ($ thousand)
Chart on Saudi Arabia - Year-over-year growth 2025-2030 (%)
Data Table on Saudi Arabia - Year-over-year growth 2025-2030 (%)

12.7.2 South Africa - Market size and forecast 2025-2030

Chart on South Africa - Market size and forecast 2025-2030 ($ thousand)
Data Table on South Africa - Market size and forecast 2025-2030 ($ thousand)
Chart on South Africa - Year-over-year growth 2025-2030 (%)
Data Table on South Africa - Year-over-year growth 2025-2030 (%)

12.7.3 UAE - Market size and forecast 2025-2030

Chart on UAE - Market size and forecast 2025-2030 ($ thousand)
Data Table on UAE - Market size and forecast 2025-2030 ($ thousand)
Chart on UAE - Year-over-year growth 2025-2030 (%)
Data Table on UAE - Year-over-year growth 2025-2030 (%)

12.7.4 Egypt - Market size and forecast 2025-2030

Chart on Egypt - Market size and forecast 2025-2030 ($ thousand)
Data Table on Egypt - Market size and forecast 2025-2030 ($ thousand)
Chart on Egypt - Year-over-year growth 2025-2030 (%)
Data Table on Egypt - Year-over-year growth 2025-2030 (%)

12.7.5 Turkey - Market size and forecast 2025-2030

Chart on Turkey - Market size and forecast 2025-2030 ($ thousand)
Data Table on Turkey - Market size and forecast 2025-2030 ($ thousand)
Chart on Turkey - Year-over-year growth 2025-2030 (%)
Data Table on Turkey - Year-over-year growth 2025-2030 (%)

12.8 Market opportunity by geography

Market opportunity by geography ($ thousand)
Data Tables on Market opportunity by geography ($ thousand)

13. Drivers, Challenges, and Opportunity

13.1 Market drivers

Rising demand within global food and beverage flavoring sector
Increasing utilization in cosmetics and personal care sector
Growing role as versatile industrial solvent and chemical intermediate

13.2 Market challenges

Volatility in raw material pricing and petrochemical dependency
Stringent regulatory frameworks and safety compliance standards
Competition from bio-derived alternatives and green chemistry movement

13.3 Impact of drivers and challenges

Impact of drivers and challenges in 2025 and 2030

13.4 Market opportunities

Strategic shift toward sustainable bio-based production and green chemistry
Proliferation of isoamyl acetate in clean beauty and natural cosmetics movement
Technological advancements in enzyme-catalyzed esterification processes

14. Competitive Landscape

14.1 Overview

14.2

Overview on criticality of inputs and factors of differentiation

14.3 Landscape disruption

Overview on factors of disruption

14.4 Industry risks

Impact of key risks on business

15. Competitive Analysis

15.1 Companies profiled

Companies covered

15.2 Company ranking index

15.3 Market positioning of companies

Matrix on companies position and classification

15.4 BASF SE

BASF SE - Overview
BASF SE - Business segments
BASF SE - Key news
BASF SE - Key offerings
BASF SE - Segment focus
SWOT

15.5 Berje Inc.

Berje Inc. - Overview
Berje Inc. - Product / Service
Berje Inc. - Key offerings
SWOT

15.6 Dow Chemical Co.

Dow Chemical Co. - Overview
Dow Chemical Co. - Business segments
Dow Chemical Co. - Key news
Dow Chemical Co. - Key offerings
Dow Chemical Co. - Segment focus
SWOT

15.7 Honeywell International Inc.

Honeywell International Inc. - Overview
Honeywell International Inc. - Business segments
Honeywell International Inc. - Key news
Honeywell International Inc. - Key offerings
Honeywell International Inc. - Segment focus
SWOT

15.8 Indorama Ventures Public Co.

Indorama Ventures Public Co. - Overview
Indorama Ventures Public Co. - Business segments
Indorama Ventures Public Co. - Key offerings
Indorama Ventures Public Co. - Segment focus
SWOT

15.9 LGC Ltd.

LGC Ltd. - Overview
LGC Ltd. - Product / Service
LGC Ltd. - Key offerings
SWOT

15.10 Loba Chemie Pvt. Ltd.

Loba Chemie Pvt. Ltd. - Overview
Loba Chemie Pvt. Ltd. - Product / Service
Loba Chemie Pvt. Ltd. - Key offerings
SWOT

15.11 SEQENS GROUP

SEQENS GROUP - Overview
SEQENS GROUP - Product / Service
SEQENS GROUP - Key offerings
SWOT

15.12 Sigma Aldrich Chemicals Ltd.

Sigma Aldrich Chemicals Ltd. - Overview
Sigma Aldrich Chemicals Ltd. - Product / Service
Sigma Aldrich Chemicals Ltd. - Key offerings
SWOT

15.13 Spectrum Chemical Mfg. Corp.

Spectrum Chemical Mfg. Corp. - Overview
Spectrum Chemical Mfg. Corp. - Product / Service
Spectrum Chemical Mfg. Corp. - Key offerings
SWOT

15.14 SRL Pvt. Ltd.

SRL Pvt. Ltd. - Overview
SRL Pvt. Ltd. - Product / Service
SRL Pvt. Ltd. - Key offerings
SWOT

15.15 Symrise Group

Symrise Group - Overview
Symrise Group - Business segments
Symrise Group - Key news
Symrise Group - Key offerings
Symrise Group - Segment focus
SWOT

15.16 Thermo Fisher Scientific Inc.

Thermo Fisher Scientific Inc. - Overview
Thermo Fisher Scientific Inc. - Business segments
Thermo Fisher Scientific Inc. - Key news
Thermo Fisher Scientific Inc. - Key offerings
Thermo Fisher Scientific Inc. - Segment focus
SWOT

15.17 Tokyo Chemical Industry Co.

Tokyo Chemical Industry Co. - Overview
Tokyo Chemical Industry Co. - Product / Service
Tokyo Chemical Industry Co. - Key offerings
SWOT

15.18 Vigon International Inc.

Vigon International Inc. - Overview
Vigon International Inc. - Product / Service
Vigon International Inc. - Key offerings
SWOT

16. Appendix

16.1 Scope of the report

Market definition
Objectives
Notes and caveats

16.2 Inclusions and exclusions checklist

Inclusions checklist
Exclusions checklist

16.3 Currency conversion rates for US$

16.4 Research methodology

16.5 Data procurement

Information sources

16.6 Data validation

16.7 Validation techniques employed for market sizing

16.8 Data synthesis

16.9 360 degree market analysis

16.10 List of abbreviations

Research Methodology

Technavio presents a detailed picture of the market by way of study, synthesis, and summation of data from multiple sources. The analysts have presented the various facets of the market with a particular focus on identifying the key industry influencers. The data thus presented is comprehensive, reliable, and the result of extensive research, both primary and secondary.

INFORMATION SOURCES

Primary sources

  • Manufacturers and suppliers
  • Channel partners
  • Industry experts
  • Strategic decision makers

Secondary sources

  • Industry journals and periodicals
  • Government data
  • Financial reports of key industry players
  • Historical data
  • Press releases

DATA ANALYSIS

Data Synthesis

  • Collation of data
  • Estimation of key figures
  • Analysis of derived insights

Data Validation

  • Triangulation with data models
  • Reference against proprietary databases
  • Corroboration with industry experts

REPORT WRITING

Qualitative

  • Market drivers
  • Market challenges
  • Market trends
  • Five forces analysis

Quantitative

  • Market size and forecast
  • Market segmentation
  • Geographical insights
  • Competitive landscape

Interested in this report?

Get your sample now to see our research methodology and insights!

Download Now

Frequently Asked Questions

Isoamyl Acetate market growth will increase by USD 470.9 thousand thousand during 2026-2030.

The Isoamyl Acetate market is expected to grow at a CAGR of 3.2% during 2026-2030.

Isoamyl Acetate market is segmented by Application (Food and beverages, Cosmetics and personal care, Furniture polish, Others) Source (Synthetic, Natural) End-user (Large industrial buyers, Medium-sized manufacturers, Small-sized enterprises, Research and laboratories)

BASF SE, Berje Inc., Dow Chemical Co., Honeywell International Inc., Indorama Ventures Public Co., LGC Ltd., Loba Chemie Pvt. Ltd., Meridian Technics, Nimble Technologies Pvt. Ltd., Otto Chemie Pvt. Ltd., SEQENS GROUP, Shinko Organic Chemical Industry, Sigma Aldrich Chemicals Ltd., Spectrum Chemical Mfg. Corp., SRL Pvt. Ltd., Symrise Group, Thermo Fisher Scientific Inc., Tokyo Chemical Industry Co., Trichem Laboratories Bombay Ltd., Vigon International Inc. are a few of the key vendors in the Isoamyl Acetate market.

APAC will register the highest growth rate of 42.2% among the other regions. Therefore, the Isoamyl Acetate market in APAC is expected to garner significant business opportunities for the vendors during the forecast period.

China, Japan, India, South Korea, Indonesia, Australia, US, Canada, Mexico, Germany, France, UK, Italy, Spain, The Netherlands, Brazil, Argentina, Chile, Saudi Arabia, South Africa, UAE, Egypt, Turkey

  • Rising demand within global food and beverage flavoring sector is the driving factor this market.

The Isoamyl Acetate market vendors should focus on grabbing business opportunities from the Application segment as it accounted for the largest market share in the base year.
RIA - Research AI Assistant
Ask RIA
