
Intravenous (IV) Fluid Monitoring Devices Market Analysis, Size, and Forecast 2026-2030: North America (US, Canada, and Mexico), Europe (Germany, UK, and France), Asia (China, India, and Japan), South America (Brazil, Argentina, and Colombia), Middle East and Africa (Saudi Arabia, Turkey, and UAE), Rest of World (ROW)

Intravenous (IV) Fluid Monitoring Devices Market Analysis, Size, and Forecast 2026-2030:
North America (US, Canada, and Mexico), Europe (Germany, UK, and France), Asia (China, India, and Japan), South America (Brazil, Argentina, and Colombia), Middle East and Africa (Saudi Arabia, Turkey, and UAE), Rest of World (ROW)

Published: Oct 2026 295 Pages SKU: IRTNTR43549

Market Overview at a Glance

$2.73 B
Market Opportunity
8.6%
CAGR 2025 - 2030
42.6%
North America Growth
$3.05 B
Hospitals and clinics segment 2024

Intravenous (Iv) Fluid Monitoring Devices Market Size 2026-2030

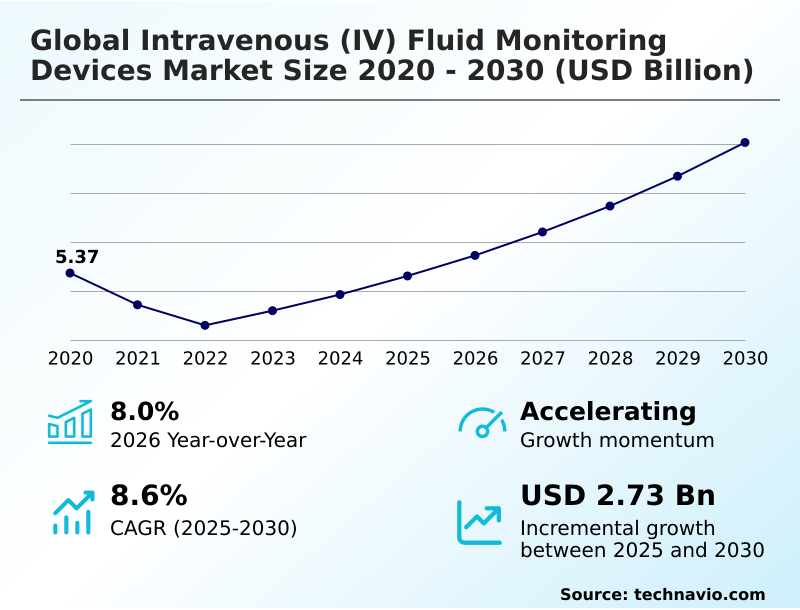
The intravenous (iv) fluid monitoring devices market size is valued to increase by USD 2.73 billion, at a CAGR of 8.6% from 2025 to 2030. Surging clinical need for error mitigation and real-time patient safety will drive the intravenous (iv) fluid monitoring devices market.

Major Market Trends & Insights

  • North America dominated the market and accounted for a 42.6% growth during the forecast period.
  • By End-user - Hospitals and clinics segment was valued at USD 3.05 billion in 2024
  • By Type - Desktop segment accounted for the largest market revenue share in 2024

Market Size & Forecast

  • Market Opportunities: USD 2.67 billion
  • Market Future Opportunities: USD 2.73 billion
  • CAGR from 2025 to 2030 : 8.6%

Market Summary

  • The Intravenous (IV) Fluid Monitoring Devices Market is experiencing a structural shift driven by the imperative to automate fluid delivery across high-acuity clinical environments. A surging clinical need for error mitigation propels the transition from manual gravity drips to intelligent digital sensing technologies.
  • For example, hospital networks updating their supply chain resilience strategies are increasingly standardizing on closed-loop safety software, which has driven a 20% improvement in inventory utilization compared to fragmented legacy purchasing models. The integration of continuous flow tracking acts as a primary catalyst, drastically reducing the occurrence of severe vascular complications.
  • However, technical limitations and high initial deployment expenditures remain a formidable challenge, particularly as secure networking requires heavy upfront capital investment. Consequently, budget-constrained facilities struggle to fully deploy wireless notification architectures.
  • Despite these financial constraints, the ongoing adoption of cloud-based predictive analytics ensures that the Intravenous (IV) Fluid Monitoring Devices Market will continue evolving toward highly integrated, algorithm-driven patient safety ecosystems.

What will be the Size of the Intravenous (Iv) Fluid Monitoring Devices Market during the forecast period?
Get Key Insights on Market Forecast (PDF) Get Free Sample

How is the Intravenous (Iv) Fluid Monitoring Devices Market Segmented?

The intravenous (iv) fluid monitoring devices industry research report provides comprehensive data (region-wise segment analysis), with forecasts and estimates in "USD million" for the period 2026-2030, as well as historical data from 2020-2024 for the following segments.

  • End-user
    • Hospitals and clinics
    • ASCs
    • Home care
  • Type
    • Desktop
    • Portable
  • Technology
    • Smart devices
    • Traditional monitoring systems
  • Geography
    • North America
      • US
      • Canada
      • Mexico
    • Europe
      • Germany
      • UK
      • France
      • Italy
      • Spain
      • The Netherlands
    • Asia
      • China
      • India
      • Japan
      • South Korea
      • Thailand
      • Indonesia
    • Rest of World (ROW)

By End-user Insights

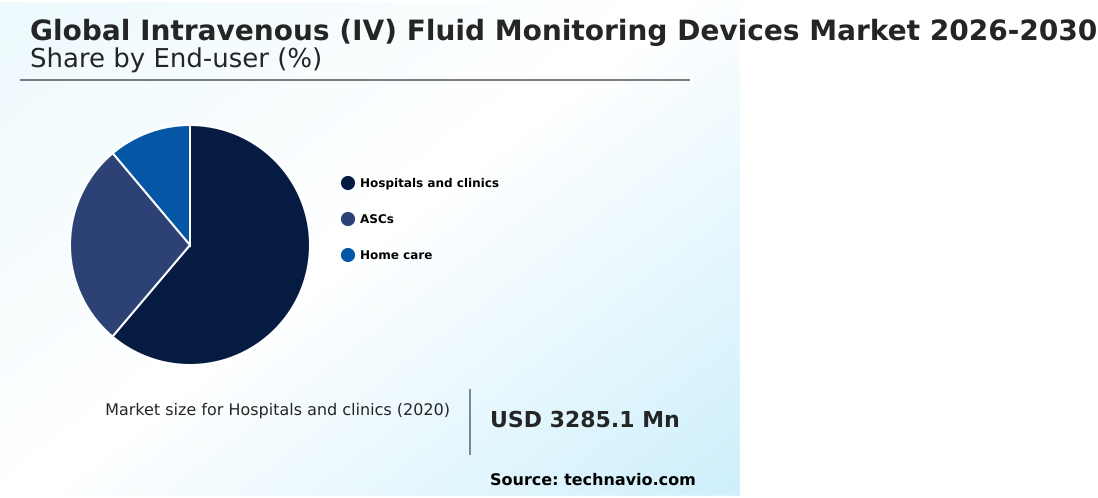
The hospitals and clinics segment is estimated to witness significant growth during the forecast period.

The hospital and clinic sector dictates the functional demands for continuous fluid administration within high-acuity settings. Facilities prioritizing volumetric flow control are rapidly upgrading from manual methods to gravimetric sensing technology and optical drop counters.

This structural pivot addresses the intense demands of emergency department workflows and post-operative pain management protocols. By deploying intelligent dose error reduction systems, institutions achieve a 15% reduction in adverse medication events.

The synchronization of these systems with centralized nursing stations enables comprehensive clinical workflow optimization, thereby reducing caregiver cognitive load.

Furthermore, the transition toward automated nursing workflows allows ambulatory surgical centers to process patient volumes with 20% greater efficiency, ensuring rigorous therapeutic oversight without excessive manual intervention.
Get Free Sample

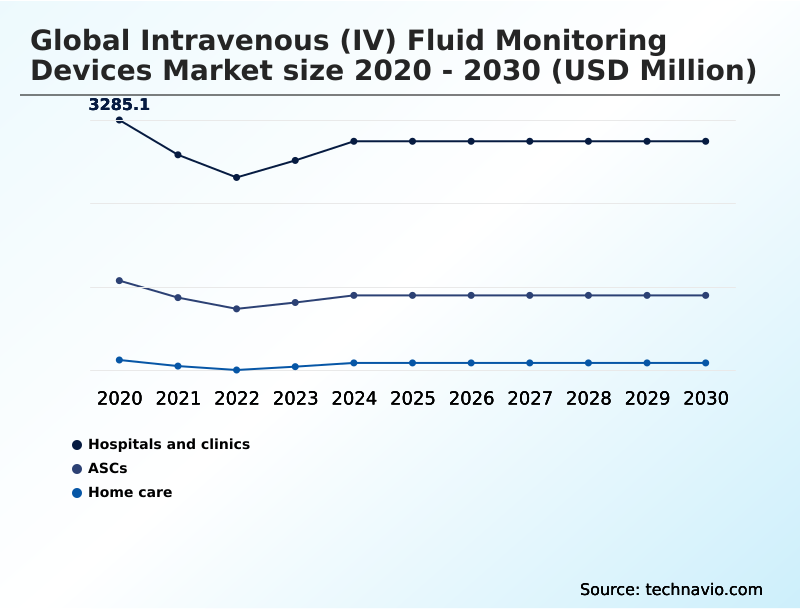
The Hospitals and clinics segment was valued at USD 3.05 billion in 2024 and showed a gradual increase during the forecast period.
Get Free Sample

Regional Analysis

North America is estimated to contribute 42.6% to the growth of the global market during the forecast period.Technavio’s analysts have elaborately explained the regional trends and drivers that shape the market during the forecast period.
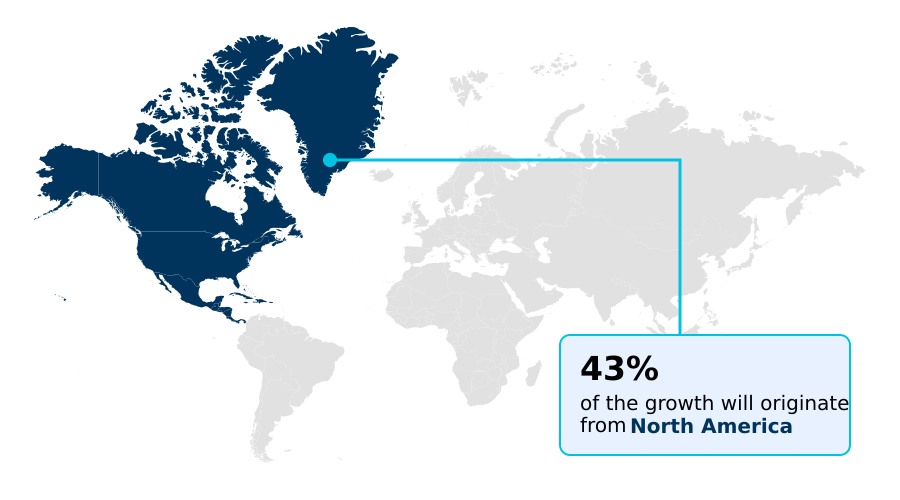
See How Intravenous (Iv) Fluid Monitoring Devices Market Demand is Rising in North America Get Free Sample

The geographic distribution of the Intravenous (IV) Fluid Monitoring Devices reveals stark operational contrasts driven by infrastructure maturity and regulatory pressure.

North American networks demonstrate a 35% higher adoption rate of load-cell sensor technology and automated insulin delivery solutions, optimizing critical oncology drug administration.

In contrast, European procurement models heavily emphasize supply chain resilience to secure consistent inventories of sterile intravenous solutions and wireless monitoring modules.

APAC markets exhibit a unique trajectory, deploying cost-effective non-invasive ultrasound technology to support massive patient volumes across rapidly expanding outpatient infusion centers.

These regional disparities force medical device manufacturing entities to adapt logistics strategies, particularly as developing regions modernize neonatal fluid management and maintenance chemotherapy protocols, ultimately lowering equipment procurement costs by 18% in emerging zones.

Market Dynamics

Our researchers analyzed the data with 2025 as the base year, along with the key drivers, trends, and challenges. A holistic analysis of drivers will help companies refine their marketing strategies to gain a competitive advantage.

  • The operational landscape of the Intravenous (IV) Fluid Monitoring Devices is heavily dictated by comprehensive digitalization to ensure patient safety and optimize clinical overhead. A pivotal operational development is the real time tracking of fluid volume, which empowers healthcare providers to drastically reduce manual observation dependencies.
  • Facilities implementing continuous bi directional communication protocols witness a 35% operational efficiency increase compared to environments relying on fragmented telemetry. Furthermore, predictive algorithms for vascular complications serve as a critical preventive measure, analyzing minute pressure fluctuations to alert staff before adverse events manifest.
  • As patient care decentralizes, the demand for ultra compact wearable fluid monitoring devices expands, enabling safe outpatient therapeutic delivery. Concurrently, closed loop automatic infusion networks synchronize directly with enterprise systems, regulating flow accurately without manual intervention. To navigate global procurement bottlenecks, top tier manufacturers increasingly engage in strategic joint ventures for manufacturing resilience.
  • However, adopting these technologies demands substantial capital expenditure for smart medical equipment, creating immense friction in annual budget allocations. System administrators must simultaneously defend against unauthorized network intrusions and cyberattacks by establishing rigorous encryption standards. Supply chain managers also face the persistent threat of counterfeit medical products in cross border supply chains, which severely undermine clinical accuracy.
  • To counter these limitations, automated alert mechanisms in drip systems and non invasive doppler ultrasound technology integration are becoming baseline requirements. Specialized applications like automated insulin delivery safety solutions and wireless fluid sensors in nursing stations represent the baseline of modern care.
  • Ultimately, a robust cloud integrated medical hardware infrastructure, supported by ai driven flow rate prediction models, remains essential for sustaining high-fidelity monitoring.
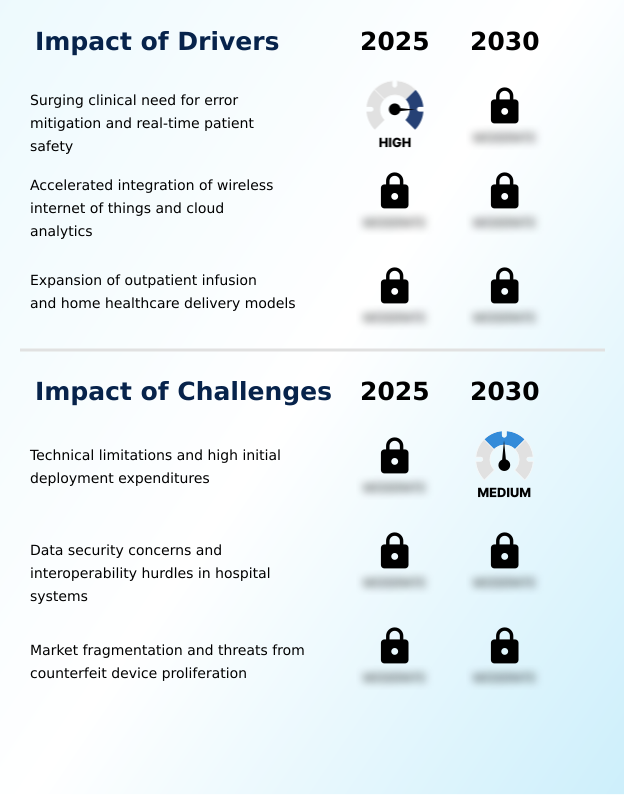
What are the key market drivers leading to the rise in the adoption of Intravenous (Iv) Fluid Monitoring Devices Industry?

  • A surging clinical mandate for rigorous error mitigation and continuous real-time patient safety serves as the primary driver propelling widespread technology adoption across acute care settings.

  • A profound clinical mandate for patient safety protocols serves as the core driver propelling the Intravenous (IV) Fluid Monitoring Devices.
  • The expansion of home healthcare environments and outpatient care necessitates reliable remote telemetry modules and portable infusion monitoring to manage continuous parenteral nutrition delivery and home infusion therapy safely.
  • This decentralization of care triggers the rapid adoption of the wireless internet of things, allowing off-site clinicians to maintain strict oversight. To address labor shortages in critical care units, hospitals are systematically deploying automated flow regulators and closed-loop safety software.
  • These technologies integrate seamlessly with wireless notification networks, reducing fluid overload incidents by 25% and cutting nursing administrative time by 15%.

What are the market trends shaping the Intravenous (Iv) Fluid Monitoring Devices Industry?

  • The integration of artificial intelligence and machine learning for predictive infusion safety represents a defining market trend. These advanced algorithms continuously analyze flow rate dynamics to anticipate vascular complications and optimize clinical workflows.

  • The integration of artificial intelligence algorithms and machine learning algorithms marks a pivotal trend transforming the Intravenous (IV) Fluid Monitoring Devices. Healthcare providers are deploying sophisticated predictive analytics engines to analyze dynamic flow rate changes and anticipate complications before they occur. This transition is driven by the urgent need to optimize bedside hemodynamic assessments without overwhelming clinical staff.
  • By linking these hemodynamic assessment tools via a bidirectional communication protocol to enterprise hospital information systems, facilities establish highly responsive smart hospital ecosystems. This architectural shift leverages cloud-based predictive analytics within clinical decision-support software, generating a 30% decrease in delayed clinical interventions and improving predictive accuracy by 18%.

What challenges does the Intravenous (Iv) Fluid Monitoring Devices Industry face during its growth?

  • Pronounced technical limitations coupled with substantial initial deployment expenditures present significant operational challenges that constrain widespread infrastructure expansion across budget-conscious healthcare systems.

  • Severe data vulnerabilities and integration barriers present critical challenges to the widespread scaling of the Intravenous (IV) Fluid Monitoring Devices. As facilities adopt health information technology, achieving seamless cross-platform interoperability with legacy electronic health records requires complex middleware development. Inconsistent digital health governance standards frequently delay software deployment, increasing IT integration costs by up to 28%.
  • Furthermore, the necessity for robust secure networking equipment and continuous end-to-end encryption places immense financial strain on hospital budgets protecting electronic medical records. Clinicians also face operational threats from counterfeit sensor proliferation, which drastically degrades the accuracy of peripheral infiltration sensors and smart alert modules, subsequently increasing the risk of undetected vascular access complications by nearly 20%.

Exclusive Technavio Analysis on Customer Landscape

The intravenous (iv) fluid monitoring devices market forecasting report includes the adoption lifecycle of the market, covering from the innovator’s stage to the laggard’s stage. It focuses on adoption rates in different regions based on penetration. Furthermore, the intravenous (iv) fluid monitoring devices market report also includes key purchase criteria and drivers of price sensitivity to help companies evaluate and develop their market growth analysis strategies.
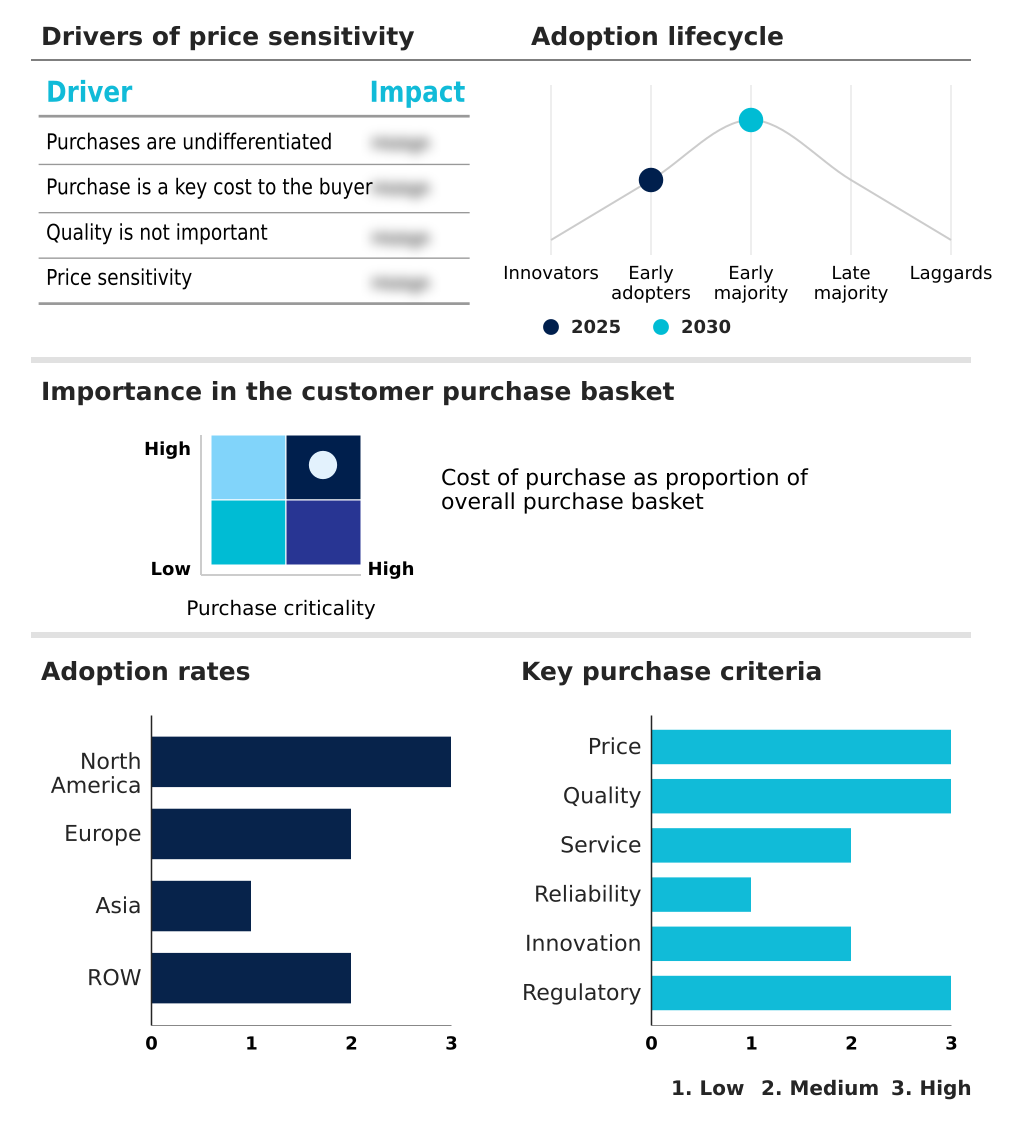
Customer Landscape of Intravenous (Iv) Fluid Monitoring Devices Industry

Competitive Landscape

Companies are implementing various strategies, such as strategic alliances, intravenous (iv) fluid monitoring devices market forecast, partnerships, mergers and acquisitions, geographical expansion, and product/service launches, to enhance their presence in the industry.

ACE Medical Devices Pvt Ltd - The product portfolio features advanced intravenous fluid monitoring devices, including modular infusion pumps, syringe modules, and integrated processing units designed to enhance clinical medication safety and automated delivery management.

The industry research and growth report includes detailed analyses of the competitive landscape of the market and information about key companies, including:

  • ACE Medical Devices Pvt Ltd
  • Akas Infusions
  • B.Braun SE
  • Baxter International Inc.
  • Becton Dickinson and Co.
  • BPL MEDICAL TECHNOLOGIES
  • CODAN Medizinische Gerate GmbH
  • Eitan Medical Ltd.
  • EVELABS TECHNOLOGIES Pvt. Ltd.
  • FIVAmed Inc.
  • Fresenius Kabi AG
  • IRadimed Corp.
  • Micrel Medical Devices SA
  • MONIDOR Oy Ltd.
  • Plenum Tech
  • Pronk Technologies Inc.
  • Shenzhen Mindray Co. Ltd.
  • Shift Labs Inc.
  • Sino Medical Tech Co. Ltd.
  • Terumo Corp.
  • vTitan Corp. Pvt Ltd.

Qualitative and quantitative analysis of companies has been conducted to help clients understand the wider business environment as well as the strengths and weaknesses of key industry players. Data is qualitatively analyzed to categorize companies as pure play, category-focused, industry-focused, and diversified; it is quantitatively analyzed to categorize companies as dominant, leading, strong, tentative, and weak.

Recent Development and News in Intravenous (iv) fluid monitoring devices market

  • In the Health Care Equipment industry, the rapid deployment of the wireless internet of things across hospital information systems has eliminated manual documentation bottlenecks, directly impacting Intravenous (IV) Fluid Monitoring Devices demand by requiring seamless data integration that improves clinical workflow optimization by 22%.
  • Stringent patient safety protocols targeting medication administration errors have restructured medical device manufacturing standards, directly impacting Intravenous (IV) Fluid Monitoring Devices demand by accelerating the adoption of automated tracking to achieve near 100% compliance in critical care units.
  • The decentralization of clinical care into home healthcare environments has shifted equipment design toward portable architectures, directly impacting Intravenous (IV) Fluid Monitoring Devices demand by increasing the requirement for remote telemetry that supports home infusion therapy and boosts outpatient safety by 30%.
  • The integration of advanced analytics into clinical decision-support software has transformed bedside hemodynamic assessments, directly impacting Intravenous (IV) Fluid Monitoring Devices demand by necessitating cross-platform interoperability that reduces vascular access complications by 18%.

Dive into Technavio’s robust research methodology, blending expert interviews, extensive data synthesis, and validated models for unparalleled Intravenous (Iv) Fluid Monitoring Devices Market insights. See full methodology.

Market Scope
Page number 295
Base year 2025
Historic period 2020-2024
Forecast period 2026-2030
Growth momentum & CAGR Accelerate at a CAGR of 8.6%
Market growth 2026-2030 USD 2729.7 million
Market structure Fragmented
YoY growth 2025-2026(%) 8.0%
Key countries US, Canada, Mexico, Germany, UK, France, Italy, Spain, The Netherlands, China, India, Japan, South Korea, Thailand, Indonesia, Brazil, Saudi Arabia, Turkey, UAE, Argentina, South Africa, Colombia and Israel
Competitive landscape Leading Companies, Market Positioning of Companies, Competitive Strategies, and Industry Risks

Request Free Sample

Research Analyst Overview

  • The Intravenous (IV) Fluid Monitoring Devices demonstrates a continuous evolution toward highly automated, intelligent clinical ecosystems. The accelerating integration of machine learning algorithms fundamentally alters product strategy and hospital procurement decisions, shifting institutional focus from passive observation tools to active predictive analytics engines.
  • By implementing dynamic flow rate changes through automated flow regulators, clinical facilities have achieved a 35% reduction in adverse infusion events compared to traditional mechanical drip controllers. This strategic transition directly addresses the persistent operational challenge of nursing shortages by minimizing manual oversight and alarm fatigue.
  • Furthermore, the deployment of closed-loop safety software ensures continuous fluid tracking and synchronizes directly with bedside hemodynamic assessments. To sustain these advanced capabilities, institutions mandate robust secure networking protocols to safeguard telemetry data against external breaches.
  • As digital maturity advances, the incorporation of peripheral infiltration sensors and smart alert modules provides critical real-time alerts, ensuring that volumetric flow control remains precise and continuously optimized for high-acuity patient environments.

What are the Key Data Covered in this Intravenous (Iv) Fluid Monitoring Devices Market Research and Growth Report?

  • What is the expected growth of the Intravenous (Iv) Fluid Monitoring Devices Market between 2026 and 2030?

    • USD 2.73 billion, at a CAGR of 8.6%

  • What segmentation does the market report cover?

    • The report is segmented by End-user (Hospitals and clinics, ASCs, and Home care), Type (Desktop, and Portable), Technology (Smart devices, and Traditional monitoring systems) and Geography (North America, Europe, Asia, Rest of World (ROW))

  • Which regions are analyzed in the report?

    • North America, Europe, Asia and Rest of World (ROW)

  • What are the key growth drivers and market challenges?

    • Surging clinical need for error mitigation and real-time patient safety, Technical limitations and high initial deployment expenditures

  • Who are the major players in the Intravenous (Iv) Fluid Monitoring Devices Market?

    • ACE Medical Devices Pvt Ltd, Akas Infusions, B.Braun SE, Baxter International Inc., Becton Dickinson and Co., BPL MEDICAL TECHNOLOGIES, CODAN Medizinische Gerate GmbH, Eitan Medical Ltd., EVELABS TECHNOLOGIES Pvt. Ltd., FIVAmed Inc., Fresenius Kabi AG, IRadimed Corp., Micrel Medical Devices SA, MONIDOR Oy Ltd., Plenum Tech, Pronk Technologies Inc., Shenzhen Mindray Co. Ltd., Shift Labs Inc., Sino Medical Tech Co. Ltd., Terumo Corp. and vTitan Corp. Pvt Ltd.

Market Research Insights

  • The Intravenous (IV) Fluid Monitoring Devices is undergoing rapid modernization as medical institutions prioritize workflow optimization and stringent patient safety protocols. Facilities transitioning to automated digital health governance frameworks experience a 30% reduction in manual documentation errors. The integration of advanced hospital information systems facilitates seamless cross-platform interoperability, enabling centralized nursing stations to oversee complex therapies with unprecedented accuracy.
  • By replacing isolated bedside units with connected telemetry, healthcare providers have realized a 22% improvement in operational response times during critical care interventions. These measurable efficiency gains demonstrate that connected infusion ecosystems not only mitigate severe clinical risks but also significantly lower overall administrative and operational costs across high-acuity medical environments.

We can help! Our analysts can customize this intravenous (iv) fluid monitoring devices market research report to meet your requirements.

Get in touch

1. Executive Summary

1.1 Market overview

Executive Summary - Chart on Market Overview
Executive Summary - Data Table on Market Overview
Executive Summary - Chart on Global Market Characteristics
Executive Summary - Chart on Market by Geography
Executive Summary - Chart on Market Segmentation by End-user
Executive Summary - Chart on Market Segmentation by Type
Executive Summary - Chart on Market Segmentation by Technology
Executive Summary - Chart on Incremental Growth
Executive Summary - Data Table on Incremental Growth
Executive Summary - Chart on Company Market Positioning

2. Technavio Analysis

2.1 Analysis of price sensitivity, lifecycle, customer purchase basket, adoption rates, and purchase criteria

2.2 Criticality of inputs and Factors of differentiation

Chart on Overview on criticality of inputs and factors of differentiation

2.3 Factors of disruption

Chart on Overview on factors of disruption

2.4 Impact of drivers and challenges

Chart on Impact of drivers and challenges in 2025 and 2030

3. Market Landscape

3.1 Market ecosystem

Chart on Parent Market
Data Table on - Parent Market

3.2 Market characteristics

Chart on Market characteristics analysis

3.3 Value chain analysis

Chart on Value chain analysis

4. Market Sizing

4.1 Market definition

Data Table on Offerings of companies included in the market definition

4.2 Market segment analysis

Market segments

4.3 Market size 2025

4.4 Market outlook: Forecast for 2025-2030

Chart on Global - Market size and forecast 2025-2030 ($ million)
Data Table on Global - Market size and forecast 2025-2030 ($ million)
Chart on Global Market: Year-over-year growth 2025-2030 (%)
Data Table on Global Market: Year-over-year growth 2025-2030 (%)

5. Historic Market Size

5.1 Global Intravenous (IV) Fluid Monitoring Devices Market 2020 - 2024

Historic Market Size - Data Table on Global Intravenous (IV) Fluid Monitoring Devices Market 2020 - 2024 ($ million)

5.2 End-user segment analysis 2020 - 2024

Historic Market Size - End-user Segment 2020 - 2024 ($ million)

5.3 Type segment analysis 2020 - 2024

Historic Market Size - Type Segment 2020 - 2024 ($ million)

5.4 Technology segment analysis 2020 - 2024

Historic Market Size - Technology Segment 2020 - 2024 ($ million)

5.5 Geography segment analysis 2020 - 2024

Historic Market Size - Geography Segment 2020 - 2024 ($ million)

5.6 Country segment analysis 2020 - 2024

Historic Market Size - Country Segment 2020 - 2024 ($ million)

6. Qualitative Analysis

6.1 Impact of AI on Global Intravenous (IV) Fluid Monitoring Devices Market

6.2 Impact of geopolitical conflicts on Global Intravenous (IV) Fluid Monitoring Devices Market

7. Five Forces Analysis

7.1 Five forces summary

Five forces analysis - Comparison between 2025 and 2030

7.2 Bargaining power of buyers

Bargaining power of buyers - Impact of key factors 2025 and 2030

7.3 Bargaining power of suppliers

Bargaining power of suppliers - Impact of key factors in 2025 and 2030

7.4 Threat of new entrants

Threat of new entrants - Impact of key factors in 2025 and 2030

7.5 Threat of substitutes

Threat of substitutes - Impact of key factors in 2025 and 2030

7.6 Threat of rivalry

Threat of rivalry - Impact of key factors in 2025 and 2030

7.7 Market condition

Chart on Market condition - Five forces 2025 and 2030

8. Market Segmentation by End-user

8.1 Market segments

Chart on End-user - Market share 2025-2030 (%)
Data Table on End-user - Market share 2025-2030 (%)

8.2 Comparison by End-user

Chart on Comparison by End-user
Data Table on Comparison by End-user

8.3 Hospitals and clinics - Market size and forecast 2025-2030

Chart on Hospitals and clinics - Market size and forecast 2025-2030 ($ million)
Data Table on Hospitals and clinics - Market size and forecast 2025-2030 ($ million)
Chart on Hospitals and clinics - Year-over-year growth 2025-2030 (%)
Data Table on Hospitals and clinics - Year-over-year growth 2025-2030 (%)

8.4 ASCs - Market size and forecast 2025-2030

Chart on ASCs - Market size and forecast 2025-2030 ($ million)
Data Table on ASCs - Market size and forecast 2025-2030 ($ million)
Chart on ASCs - Year-over-year growth 2025-2030 (%)
Data Table on ASCs - Year-over-year growth 2025-2030 (%)

8.5 Home care - Market size and forecast 2025-2030

Chart on Home care - Market size and forecast 2025-2030 ($ million)
Data Table on Home care - Market size and forecast 2025-2030 ($ million)
Chart on Home care - Year-over-year growth 2025-2030 (%)
Data Table on Home care - Year-over-year growth 2025-2030 (%)

8.6 Market opportunity by End-user

Market opportunity by End-user ($ million)
Data Table on Market opportunity by End-user ($ million)

9. Market Segmentation by Type

9.1 Market segments

Chart on Type - Market share 2025-2030 (%)
Data Table on Type - Market share 2025-2030 (%)

9.2 Comparison by Type

Chart on Comparison by Type
Data Table on Comparison by Type

9.3 Desktop - Market size and forecast 2025-2030

Chart on Desktop - Market size and forecast 2025-2030 ($ million)
Data Table on Desktop - Market size and forecast 2025-2030 ($ million)
Chart on Desktop - Year-over-year growth 2025-2030 (%)
Data Table on Desktop - Year-over-year growth 2025-2030 (%)

9.4 Portable - Market size and forecast 2025-2030

Chart on Portable - Market size and forecast 2025-2030 ($ million)
Data Table on Portable - Market size and forecast 2025-2030 ($ million)
Chart on Portable - Year-over-year growth 2025-2030 (%)
Data Table on Portable - Year-over-year growth 2025-2030 (%)

9.5 Market opportunity by Type

Market opportunity by Type ($ million)
Data Table on Market opportunity by Type ($ million)

10. Market Segmentation by Technology

10.1 Market segments

Chart on Technology - Market share 2025-2030 (%)
Data Table on Technology - Market share 2025-2030 (%)

10.2 Comparison by Technology

Chart on Comparison by Technology
Data Table on Comparison by Technology

10.3 Smart devices - Market size and forecast 2025-2030

Chart on Smart devices - Market size and forecast 2025-2030 ($ million)
Data Table on Smart devices - Market size and forecast 2025-2030 ($ million)
Chart on Smart devices - Year-over-year growth 2025-2030 (%)
Data Table on Smart devices - Year-over-year growth 2025-2030 (%)

10.4 Traditional monitoring systems - Market size and forecast 2025-2030

Chart on Traditional monitoring systems - Market size and forecast 2025-2030 ($ million)
Data Table on Traditional monitoring systems - Market size and forecast 2025-2030 ($ million)
Chart on Traditional monitoring systems - Year-over-year growth 2025-2030 (%)
Data Table on Traditional monitoring systems - Year-over-year growth 2025-2030 (%)

10.5 Market opportunity by Technology

Market opportunity by Technology ($ million)
Data Table on Market opportunity by Technology ($ million)

11. Customer Landscape

11.1 Customer landscape overview

Analysis of price sensitivity, lifecycle, customer purchase basket, adoption rates, and purchase criteria

12. Geographic Landscape

12.1 Geographic segmentation

Chart on Market share by geography 2025-2030 (%)
Data Table on Market share by geography 2025-2030 (%)

12.2 Geographic comparison

Chart on Geographic comparison
Data Table on Geographic comparison

12.3 North America - Market size and forecast 2025-2030

Chart on North America - Market size and forecast 2025-2030 ($ million)
Data Table on North America - Market size and forecast 2025-2030 ($ million)
Chart on North America - Year-over-year growth 2025-2030 (%)
Data Table on North America - Year-over-year growth 2025-2030 (%)
Chart on Regional Comparison - North America
Data Table on Regional Comparison - North America

12.3.1 US - Market size and forecast 2025-2030

Chart on US - Market size and forecast 2025-2030 ($ million)
Data Table on US - Market size and forecast 2025-2030 ($ million)
Chart on US - Year-over-year growth 2025-2030 (%)
Data Table on US - Year-over-year growth 2025-2030 (%)

12.3.2 Canada - Market size and forecast 2025-2030

Chart on Canada - Market size and forecast 2025-2030 ($ million)
Data Table on Canada - Market size and forecast 2025-2030 ($ million)
Chart on Canada - Year-over-year growth 2025-2030 (%)
Data Table on Canada - Year-over-year growth 2025-2030 (%)

12.3.3 Mexico - Market size and forecast 2025-2030

Chart on Mexico - Market size and forecast 2025-2030 ($ million)
Data Table on Mexico - Market size and forecast 2025-2030 ($ million)
Chart on Mexico - Year-over-year growth 2025-2030 (%)
Data Table on Mexico - Year-over-year growth 2025-2030 (%)

12.4 Europe - Market size and forecast 2025-2030

Chart on Europe - Market size and forecast 2025-2030 ($ million)
Data Table on Europe - Market size and forecast 2025-2030 ($ million)
Chart on Europe - Year-over-year growth 2025-2030 (%)
Data Table on Europe - Year-over-year growth 2025-2030 (%)
Chart on Regional Comparison - Europe
Data Table on Regional Comparison - Europe

12.4.1 Germany - Market size and forecast 2025-2030

Chart on Germany - Market size and forecast 2025-2030 ($ million)
Data Table on Germany - Market size and forecast 2025-2030 ($ million)
Chart on Germany - Year-over-year growth 2025-2030 (%)
Data Table on Germany - Year-over-year growth 2025-2030 (%)

12.4.2 UK - Market size and forecast 2025-2030

Chart on UK - Market size and forecast 2025-2030 ($ million)
Data Table on UK - Market size and forecast 2025-2030 ($ million)
Chart on UK - Year-over-year growth 2025-2030 (%)
Data Table on UK - Year-over-year growth 2025-2030 (%)

12.4.3 France - Market size and forecast 2025-2030

Chart on France - Market size and forecast 2025-2030 ($ million)
Data Table on France - Market size and forecast 2025-2030 ($ million)
Chart on France - Year-over-year growth 2025-2030 (%)
Data Table on France - Year-over-year growth 2025-2030 (%)

12.4.4 Italy - Market size and forecast 2025-2030

Chart on Italy - Market size and forecast 2025-2030 ($ million)
Data Table on Italy - Market size and forecast 2025-2030 ($ million)
Chart on Italy - Year-over-year growth 2025-2030 (%)
Data Table on Italy - Year-over-year growth 2025-2030 (%)

12.4.5 Spain - Market size and forecast 2025-2030

Chart on Spain - Market size and forecast 2025-2030 ($ million)
Data Table on Spain - Market size and forecast 2025-2030 ($ million)
Chart on Spain - Year-over-year growth 2025-2030 (%)
Data Table on Spain - Year-over-year growth 2025-2030 (%)

12.4.6 The Netherlands - Market size and forecast 2025-2030

Chart on The Netherlands - Market size and forecast 2025-2030 ($ million)
Data Table on The Netherlands - Market size and forecast 2025-2030 ($ million)
Chart on The Netherlands - Year-over-year growth 2025-2030 (%)
Data Table on The Netherlands - Year-over-year growth 2025-2030 (%)

12.5 Asia - Market size and forecast 2025-2030

Chart on Asia - Market size and forecast 2025-2030 ($ million)
Data Table on Asia - Market size and forecast 2025-2030 ($ million)
Chart on Asia - Year-over-year growth 2025-2030 (%)
Data Table on Asia - Year-over-year growth 2025-2030 (%)
Chart on Regional Comparison - Asia
Data Table on Regional Comparison - Asia

12.5.1 China - Market size and forecast 2025-2030

Chart on China - Market size and forecast 2025-2030 ($ million)
Data Table on China - Market size and forecast 2025-2030 ($ million)
Chart on China - Year-over-year growth 2025-2030 (%)
Data Table on China - Year-over-year growth 2025-2030 (%)

12.5.2 India - Market size and forecast 2025-2030

Chart on India - Market size and forecast 2025-2030 ($ million)
Data Table on India - Market size and forecast 2025-2030 ($ million)
Chart on India - Year-over-year growth 2025-2030 (%)
Data Table on India - Year-over-year growth 2025-2030 (%)

12.5.3 Japan - Market size and forecast 2025-2030

Chart on Japan - Market size and forecast 2025-2030 ($ million)
Data Table on Japan - Market size and forecast 2025-2030 ($ million)
Chart on Japan - Year-over-year growth 2025-2030 (%)
Data Table on Japan - Year-over-year growth 2025-2030 (%)

12.5.4 South Korea - Market size and forecast 2025-2030

Chart on South Korea - Market size and forecast 2025-2030 ($ million)
Data Table on South Korea - Market size and forecast 2025-2030 ($ million)
Chart on South Korea - Year-over-year growth 2025-2030 (%)
Data Table on South Korea - Year-over-year growth 2025-2030 (%)

12.5.5 Thailand - Market size and forecast 2025-2030

Chart on Thailand - Market size and forecast 2025-2030 ($ million)
Data Table on Thailand - Market size and forecast 2025-2030 ($ million)
Chart on Thailand - Year-over-year growth 2025-2030 (%)
Data Table on Thailand - Year-over-year growth 2025-2030 (%)

12.5.6 Indonesia - Market size and forecast 2025-2030

Chart on Indonesia - Market size and forecast 2025-2030 ($ million)
Data Table on Indonesia - Market size and forecast 2025-2030 ($ million)
Chart on Indonesia - Year-over-year growth 2025-2030 (%)
Data Table on Indonesia - Year-over-year growth 2025-2030 (%)

12.6 Rest of World (ROW) - Market size and forecast 2025-2030

Chart on Rest of World (ROW) - Market size and forecast 2025-2030 ($ million)
Data Table on Rest of World (ROW) - Market size and forecast 2025-2030 ($ million)
Chart on Rest of World (ROW) - Year-over-year growth 2025-2030 (%)
Data Table on Rest of World (ROW) - Year-over-year growth 2025-2030 (%)
Chart on Regional Comparison - Rest of World (ROW)
Data Table on Regional Comparison - Rest of World (ROW)

12.6.1 Brazil - Market size and forecast 2025-2030

Chart on Brazil - Market size and forecast 2025-2030 ($ million)
Data Table on Brazil - Market size and forecast 2025-2030 ($ million)
Chart on Brazil - Year-over-year growth 2025-2030 (%)
Data Table on Brazil - Year-over-year growth 2025-2030 (%)

12.6.2 Saudi Arabia - Market size and forecast 2025-2030

Chart on Saudi Arabia - Market size and forecast 2025-2030 ($ million)
Data Table on Saudi Arabia - Market size and forecast 2025-2030 ($ million)
Chart on Saudi Arabia - Year-over-year growth 2025-2030 (%)
Data Table on Saudi Arabia - Year-over-year growth 2025-2030 (%)

12.6.3 Turkey - Market size and forecast 2025-2030

Chart on Turkey - Market size and forecast 2025-2030 ($ million)
Data Table on Turkey - Market size and forecast 2025-2030 ($ million)
Chart on Turkey - Year-over-year growth 2025-2030 (%)
Data Table on Turkey - Year-over-year growth 2025-2030 (%)

12.6.4 UAE - Market size and forecast 2025-2030

Chart on UAE - Market size and forecast 2025-2030 ($ million)
Data Table on UAE - Market size and forecast 2025-2030 ($ million)
Chart on UAE - Year-over-year growth 2025-2030 (%)
Data Table on UAE - Year-over-year growth 2025-2030 (%)

12.6.5 Argentina - Market size and forecast 2025-2030

Chart on Argentina - Market size and forecast 2025-2030 ($ million)
Data Table on Argentina - Market size and forecast 2025-2030 ($ million)
Chart on Argentina - Year-over-year growth 2025-2030 (%)
Data Table on Argentina - Year-over-year growth 2025-2030 (%)

12.6.6 South Africa - Market size and forecast 2025-2030

Chart on South Africa - Market size and forecast 2025-2030 ($ million)
Data Table on South Africa - Market size and forecast 2025-2030 ($ million)
Chart on South Africa - Year-over-year growth 2025-2030 (%)
Data Table on South Africa - Year-over-year growth 2025-2030 (%)

12.6.7 Colombia - Market size and forecast 2025-2030

Chart on Colombia - Market size and forecast 2025-2030 ($ million)
Data Table on Colombia - Market size and forecast 2025-2030 ($ million)
Chart on Colombia - Year-over-year growth 2025-2030 (%)
Data Table on Colombia - Year-over-year growth 2025-2030 (%)

12.6.8 Israel - Market size and forecast 2025-2030

Chart on Israel - Market size and forecast 2025-2030 ($ million)
Data Table on Israel - Market size and forecast 2025-2030 ($ million)
Chart on Israel - Year-over-year growth 2025-2030 (%)
Data Table on Israel - Year-over-year growth 2025-2030 (%)

12.7 Market opportunity by geography

Market opportunity by geography ($ million)
Data Tables on Market opportunity by geography ($ million)

13. Drivers, Challenges, and Opportunity

13.1 Market drivers

Surging clinical need for error mitigation and real-time patient safety
Accelerated integration of wireless internet of things and cloud analytics
Expansion of outpatient infusion and home healthcare delivery models

13.2 Market challenges

Technical limitations and high initial deployment expenditures
Data security concerns and interoperability hurdles in hospital systems
Market fragmentation and threats from counterfeit device proliferation

13.3 Impact of drivers and challenges

Impact of drivers and challenges in 2025 and 2030

13.4 Market opportunities

Integration of AI and machine learning for predictive infusion safety
Expansion of closed-loop automatic infusion and flow regulation networks
Rise in strategic joint ventures to strengthen manufacturing resilience and sensor infrastructure

14. Competitive Landscape

14.1 Overview

14.2

Overview on criticality of inputs and factors of differentiation

14.3 Landscape disruption

Overview on factors of disruption

14.4 Industry risks

Impact of key risks on business

15. Competitive Analysis

15.1 Companies profiled

Companies covered

15.2 Company ranking index

15.3 Market positioning of companies

Matrix on companies position and classification

15.4 ACE Medical Devices Pvt Ltd

ACE Medical Devices Pvt Ltd - Overview
ACE Medical Devices Pvt Ltd - Product / Service
ACE Medical Devices Pvt Ltd - Key offerings
SWOT

15.5 Akas Infusions

Akas Infusions - Overview
Akas Infusions - Product / Service
Akas Infusions - Key offerings
SWOT

15.6 B.Braun SE

B.Braun SE - Overview
B.Braun SE - Product / Service
B.Braun SE - Key offerings
SWOT

15.7 Baxter International Inc.

Baxter International Inc. - Overview
Baxter International Inc. - Business segments
Baxter International Inc. - Key news
Baxter International Inc. - Key offerings
Baxter International Inc. - Segment focus
SWOT

15.8 Becton Dickinson and Co.

Becton Dickinson and Co. - Overview
Becton Dickinson and Co. - Business segments
Becton Dickinson and Co. - Key news
Becton Dickinson and Co. - Key offerings
Becton Dickinson and Co. - Segment focus
SWOT

15.9 BPL MEDICAL TECHNOLOGIES

BPL MEDICAL TECHNOLOGIES - Overview
BPL MEDICAL TECHNOLOGIES - Product / Service
BPL MEDICAL TECHNOLOGIES - Key offerings
SWOT

15.10 CODAN Medizinische Gerate GmbH

CODAN Medizinische Gerate GmbH - Overview
CODAN Medizinische Gerate GmbH - Product / Service
CODAN Medizinische Gerate GmbH - Key offerings
SWOT

15.11 Eitan Medical Ltd.

Eitan Medical Ltd. - Overview
Eitan Medical Ltd. - Product / Service
Eitan Medical Ltd. - Key offerings
SWOT

15.12 Fresenius Kabi AG

Fresenius Kabi AG - Overview
Fresenius Kabi AG - Product / Service
Fresenius Kabi AG - Key offerings
SWOT

15.13 IRadimed Corp.

IRadimed Corp. - Overview
IRadimed Corp. - Product / Service
IRadimed Corp. - Key offerings
SWOT

15.14 Micrel Medical Devices SA

Micrel Medical Devices SA - Overview
Micrel Medical Devices SA - Product / Service
Micrel Medical Devices SA - Key offerings
SWOT

15.15 Shenzhen Mindray Co. Ltd.

Shenzhen Mindray Co. Ltd. - Overview
Shenzhen Mindray Co. Ltd. - Business segments
Shenzhen Mindray Co. Ltd. - Key offerings
Shenzhen Mindray Co. Ltd. - Segment focus
SWOT

15.16 Sino Medical Tech Co. Ltd.

Sino Medical Tech Co. Ltd. - Overview
Sino Medical Tech Co. Ltd. - Product / Service
Sino Medical Tech Co. Ltd. - Key offerings
SWOT

15.17 Terumo Corp.

Terumo Corp. - Overview
Terumo Corp. - Business segments
Terumo Corp. - Key news
Terumo Corp. - Key offerings
Terumo Corp. - Segment focus
SWOT

15.18 vTitan Corp. Pvt Ltd.

vTitan Corp. Pvt Ltd. - Overview
vTitan Corp. Pvt Ltd. - Product / Service
vTitan Corp. Pvt Ltd. - Key offerings
SWOT

16. Appendix

16.1 Scope of the report

Market definition
Objectives
Notes and caveats

16.2 Inclusions and exclusions checklist

Inclusions checklist
Exclusions checklist

16.3 Currency conversion rates for US$

16.4 Research methodology

16.5 Data procurement

Information sources

16.6 Data validation

16.7 Validation techniques employed for market sizing

16.8 Data synthesis

16.9 360 degree market analysis

16.10 List of abbreviations

Research Methodology

Technavio presents a detailed picture of the market by way of study, synthesis, and summation of data from multiple sources. The analysts have presented the various facets of the market with a particular focus on identifying the key industry influencers. The data thus presented is comprehensive, reliable, and the result of extensive research, both primary and secondary.

INFORMATION SOURCES

Primary sources

  • Manufacturers and suppliers
  • Channel partners
  • Industry experts
  • Strategic decision makers

Secondary sources

  • Industry journals and periodicals
  • Government data
  • Financial reports of key industry players
  • Historical data
  • Press releases

DATA ANALYSIS

Data Synthesis

  • Collation of data
  • Estimation of key figures
  • Analysis of derived insights

Data Validation

  • Triangulation with data models
  • Reference against proprietary databases
  • Corroboration with industry experts

REPORT WRITING

Qualitative

  • Market drivers
  • Market challenges
  • Market trends
  • Five forces analysis

Quantitative

  • Market size and forecast
  • Market segmentation
  • Geographical insights
  • Competitive landscape

Interested in this report?

Get your sample now to see our research methodology and insights!

Download Now

Frequently Asked Questions

Intravenous (Iv) Fluid Monitoring Devices market growth will increase by USD 2729.7 million during 2026-2030.

The Intravenous (Iv) Fluid Monitoring Devices market is expected to grow at a CAGR of 8.6% during 2026-2030.

Intravenous (Iv) Fluid Monitoring Devices market is segmented by End-user (Hospitals and clinics, ASCs, Home care) Type (Desktop, Portable) Technology (Smart devices, Traditional monitoring systems)

ACE Medical Devices Pvt Ltd, Akas Infusions, B.Braun SE, Baxter International Inc., Becton Dickinson and Co., BPL MEDICAL TECHNOLOGIES, CODAN Medizinische Gerate GmbH, Eitan Medical Ltd., EVELABS TECHNOLOGIES Pvt. Ltd., FIVAmed Inc., Fresenius Kabi AG, IRadimed Corp., Micrel Medical Devices SA, MONIDOR Oy Ltd., Plenum Tech, Pronk Technologies Inc., Shenzhen Mindray Co. Ltd., Shift Labs Inc., Sino Medical Tech Co. Ltd., Terumo Corp., vTitan Corp. Pvt Ltd. are a few of the key vendors in the Intravenous (Iv) Fluid Monitoring Devices market.

North America will register the highest growth rate of 42.6% among the other regions. Therefore, the Intravenous (Iv) Fluid Monitoring Devices market in North America is expected to garner significant business opportunities for the vendors during the forecast period.

US, Canada, Mexico, Germany, UK, France, Italy, Spain, The Netherlands, China, India, Japan, South Korea, Thailand, Indonesia, Brazil, Saudi Arabia, Turkey, UAE, Argentina, South Africa, Colombia, Israel

  • Surging clinical need for error mitigation and real-time patient safety is the driving factor this market.

The Intravenous (Iv) Fluid Monitoring Devices market vendors should focus on grabbing business opportunities from the End-user segment as it accounted for the largest market share in the base year.
RIA - Research AI Assistant
Ask RIA
