
K-12 Furniture Market Analysis, Size, and Forecast 2026-2030: APAC (China, Japan, and India), Europe (Germany, UK, and France), North America (US, Canada, and Mexico), South America (Brazil, Argentina, and Chile), Middle East and Africa (Saudi Arabia, UAE, and South Africa), and Rest of World (ROW)

K-12 Furniture Market Analysis, Size, and Forecast 2026-2030:
APAC (China, Japan, and India), Europe (Germany, UK, and France), North America (US, Canada, and Mexico), South America (Brazil, Argentina, and Chile), Middle East and Africa (Saudi Arabia, UAE, and South Africa), and Rest of World (ROW)

Published: Oct 2026 327 Pages SKU: IRTNTR74762

Market Overview at a Glance

$3.28 B
Market Opportunity
5.9%
CAGR 2025 - 2030
58.3%
APAC Growth
$4.42 B
Seating segment 2024

K-12 Furniture Market Size 2026-2030

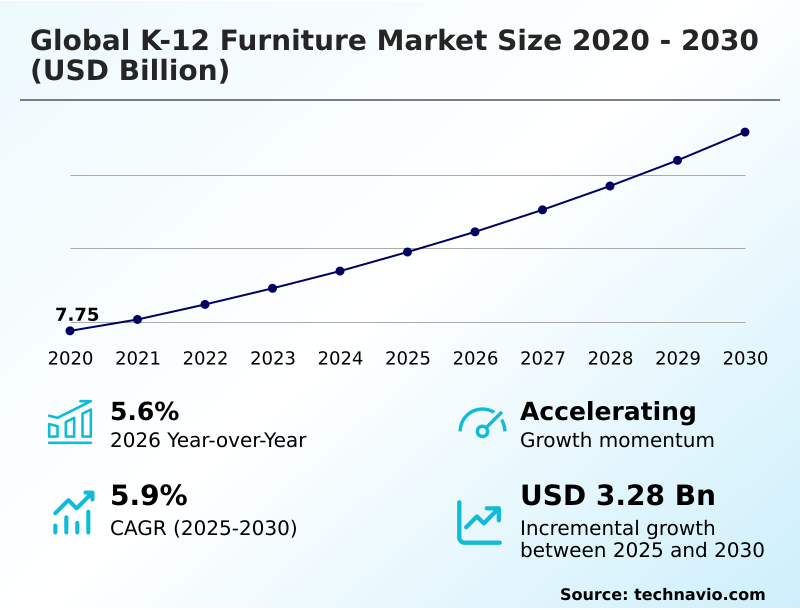
The k-12 furniture market size is valued to increase by USD 3.28 billion, at a CAGR of 5.9% from 2025 to 2030. Global transition toward active collaborative learning will drive the k-12 furniture market.

Major Market Trends & Insights

  • APAC dominated the market and accounted for a 58.3% growth during the forecast period.
  • By Product - Seating segment was valued at USD 4.42 billion in 2024
  • By Application - Classroom segment accounted for the largest market revenue share in 2024

Market Size & Forecast

  • Market Opportunities: USD 5.42 billion
  • Market Future Opportunities: USD 3.28 billion
  • CAGR from 2025 to 2030 : 5.9%

Market Summary

  • The K-12 Furniture Market exhibits robust expansion driven by the structural modernization of primary and secondary educational facilities. Institutions are increasingly abandoning static, forward-facing rows in favor of dynamic layouts that support interactive pedagogies.
  • For example, school districts revamping their procurement operations have shifted toward high-density modular storage and mobile seating ecosystems, achieving a 25% increase in usable classroom space compared to legacy heavy-wood configurations. This operational efficiency allows administrators to maximize existing facility footprints without costly architectural expansions.
  • The widespread transition toward active collaborative learning acts as the primary driver, as educators require reconfigurable furniture to quickly transition between individual study and group projects. Conversely, severe municipal budget cuts and unpredictable government funding cycles pose a significant challenge.
  • When local tax revenues decline, school boards often freeze capital expenditures and delay furniture replacement schedules, forcing manufacturers to navigate prolonged and unpredictable public procurement bidding processes. Such financial volatility constricts stable supply chain forecasting and compels vendors to engineer highly durable, multi-use products that stretch limited institutional budgets over extended operational lifecycles.

What will be the Size of the K-12 Furniture Market during the forecast period?
Get Key Insights on Market Forecast (PDF) Get Free Sample

How is the K-12 Furniture Market Segmented?

The k-12 furniture industry research report provides comprehensive data (region-wise segment analysis), with forecasts and estimates in "USD million" for the period 2026-2030, as well as historical data from 2020-2024 for the following segments.

  • Product
    • Seating
    • Storage
    • Lab equipment
    • Others
  • Application
    • Classroom
    • Library and labs
    • Others
  • Material
    • Wood
    • Metal
    • Plastic
    • Fabric
    • Composite materials
  • Distribution channel
    • Retail stores
    • Direct sales
    • Distributors
    • Wholesalers
    • Online retail
  • Geography
    • APAC
      • China
      • Japan
      • India
      • South Korea
      • Australia
      • Indonesia
    • Europe
      • Germany
      • UK
      • France
      • Italy
      • Spain
      • The Netherlands
    • North America
      • US
      • Canada
      • Mexico
    • South America
      • Brazil
      • Argentina
      • Chile
    • Middle East and Africa
      • Saudi Arabia
      • UAE
      • South Africa
      • Turkey
      • Israel

By Product Insights

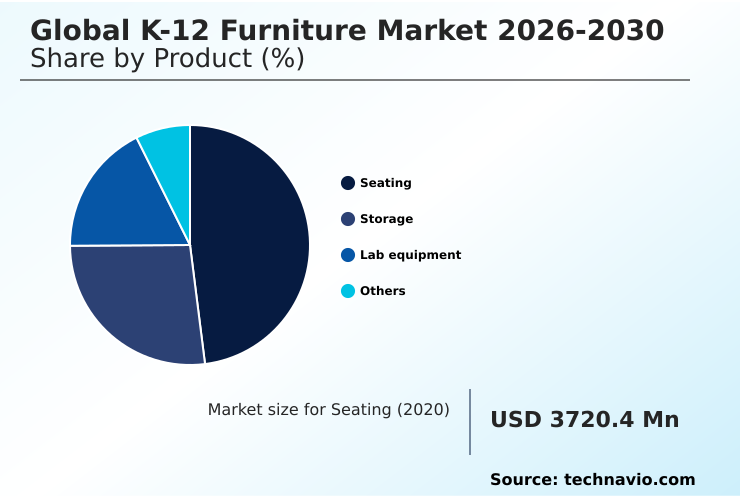
The seating segment is estimated to witness significant growth during the forecast period.

The seating segment within K-12 Furniture represents a structural shift toward active learning environments and dynamic instructional layouts.

Traditional rigid setups are rapidly transitioning to flexible configurations that integrate ergonomic seating, polypropylene chairs, and dynamic tilt mechanisms to optimize student posture alignment.

Administrators note that deploying wobble stools and sensory-friendly soft seating improves engagement metrics, with schools reporting a 15% reduction in behavioral disruptions when utilizing adaptable layouts. This strategic procurement supports musculoskeletal discomfort reduction while accommodating varied sensory processing needs.

Furthermore, heavy-duty casters and stackable designs allow educators to reconfigure spaces seamlessly, reducing classroom setup times by 20%.

Such operational efficiency gains justify the integration of inclusive classroom design principles, establishing seating as a fundamental catalyst for pedagogical strategy alignment and long-term facility modernization cycles.
Get Free Sample

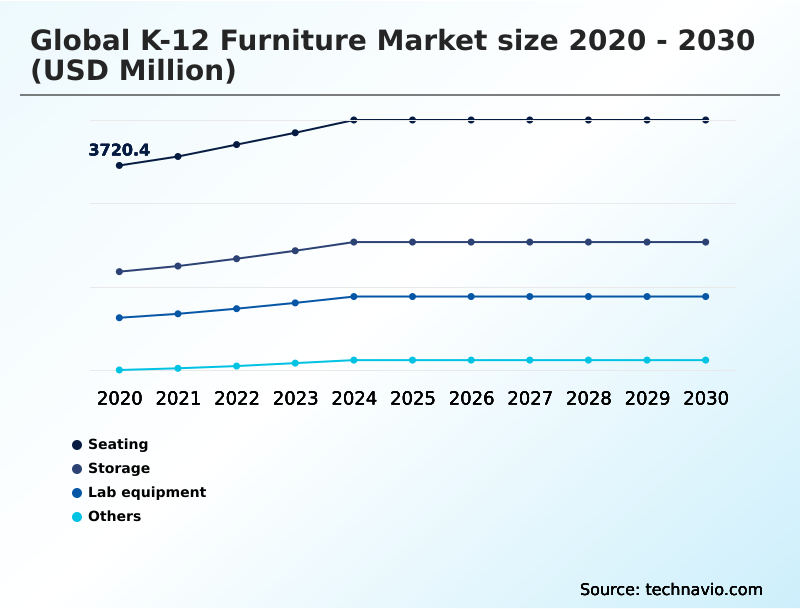
The Seating segment was valued at USD 4.42 billion in 2024 and showed a gradual increase during the forecast period.
Get Free Sample

Regional Analysis

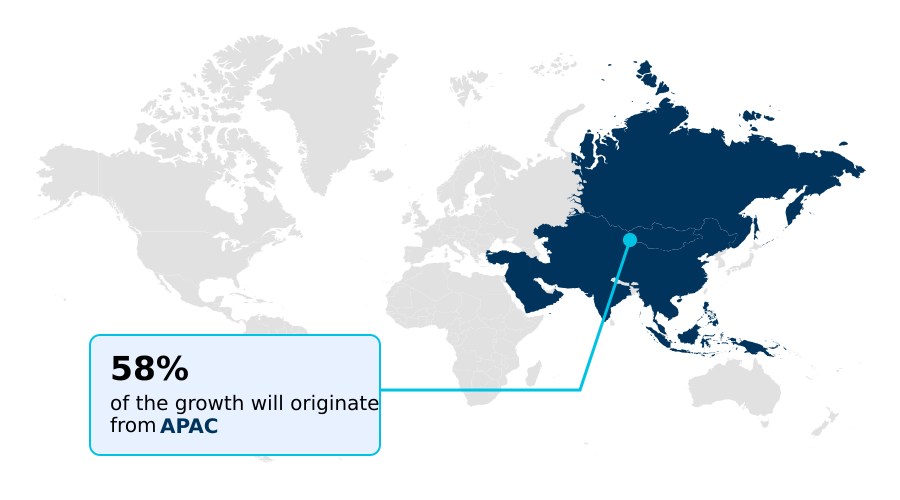
APAC is estimated to contribute 58.3% to the growth of the global market during the forecast period.Technavio’s analysts have elaborately explained the regional trends and drivers that shape the market during the forecast period.
See How K-12 Furniture Market Demand is Rising in APAC Get Free Sample

The K-12 Furniture landscape reveals distinct regional disparities in technology adoption and supply chain execution. North America prioritizes multisensory modulation and interactive capabilities, registering a 35% higher penetration rate of write-and-wipe surfaces compared to European markets.

This operational focus accelerates pedagogical strategy alignment by facilitating rapid, hands-on group work within modern classrooms. Conversely, the APAC region demonstrates aggressive infrastructure scaling, deploying automated robotic welding to reduce manufacturing lead times by 18% for large-scale institutional orders.

European districts, constrained by stringent environmental mandates, exhibit a 40% higher utilization of sustainable epoxy resin countertops and acoustic spatial dividers than their APAC counterparts. This compliance-driven procurement directly supports optimal instructional space optimization and improves student concentration metrics.

Furthermore, expanding outdoor learning plazas in North America drives distinct material requirements, forcing vendors to adapt regional distribution logistics to handle weather-resistant composites that maintain long-term durability.

Market Dynamics

Our researchers analyzed the data with 2025 as the base year, along with the key drivers, trends, and challenges. A holistic analysis of drivers will help companies refine their marketing strategies to gain a competitive advantage.

  • The structural modernization of educational facilities demands highly sophisticated procurement strategies, particularly as administrators prioritize multi-functional spaces, student health, and rigorous environmental compliance. Transitioning away from rigid, legacy layouts requires the strategic deployment of ergonomic height-adjustable student desks, which support varying physiological needs while promoting active physical engagement throughout the day.
  • Facility operations managers report that outfitting primary learning zones with collaborative modular classroom seating solutions yields an estimated 30% faster physical reconfiguration time compared to utilizing standard stationary desks, significantly optimizing daily instructional planning and custodial maintenance routines.
  • In specialized vocational and STEM instructional zones, the integration of heavy-duty, chemical-resistant science laboratory tables ensures maximum surface durability against corrosive reagent spills and thermal impacts, effectively reducing long-term facility maintenance liabilities. To accommodate diverse neurocognitive profiles, educational interior architects increasingly specify sensory-friendly soft lounge seating, fostering supportive, distraction-free environments for students requiring quiet focus areas.
  • Concurrently, strict municipal sustainability mandates and carbon reduction targets are shifting institutional supply chain preferences heavily toward eco-certified materials, driving peak demand for sustainable recycled polymer classroom chairs.
  • By aligning specialized furniture acquisition with active pedagogical frameworks, school districts not only enhance student well-being but also stretch limited capital expenditure budgets over extended operational lifecycles through the procurement of highly durable, adaptable interior assets.
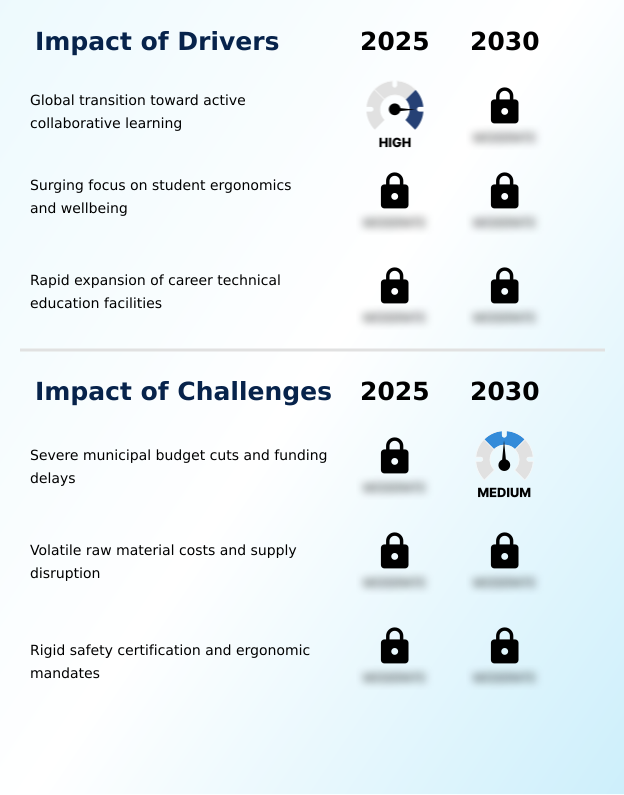
What are the key market drivers leading to the rise in the adoption of K-12 Furniture Industry?

  • The widespread transition toward active collaborative learning acts as a primary catalyst driving market expansion.

  • The widespread expansion of career technical education fundamentally propels the acquisition of specialized, industrial-grade learning infrastructure.
  • Municipalities are directing massive capital toward equipping vocational training facilities and makerspace infrastructure, requiring highly durable assets such as chemical-resistant laboratory tables and phenolic resin work surfaces.
  • This targeted procurement ensures safety against corrosive spills, extending furniture operational lifespans by up to 35% compared to standard wood composites.
  • Simultaneously, the pedagogical shift toward active peer-to-peer communication drives the deployment of collaborative learning furniture, modular group tables, and height-adjustable desks.
  • Modernizing digital media centers with these agile seating ecosystems yields a 20% faster transition time between independent study and group projects, directly optimizing daily instructional efficiency and maximizing total classroom engagement.

What are the market trends shaping the K-12 Furniture Industry?

  • The integration of mobile technology power within educational furniture represents a defining market trend supporting continuous digital connectivity across modern learning environments.

  • The rapid digitization of modern curricula mandates the pervasive integration of mobile power distribution modules and integrated cable management directly into student work surfaces. This technological convergence addresses the critical demand for continuous device connectivity within multi-functional learning hubs. Implementing powered furniture solutions eliminates hazardous trailing cords, effectively reducing classroom tripping incidents by 40% compared to traditional wall-outlet dependencies.
  • Furthermore, the adoption of universal design for learning principles accelerates the implementation of circular sustainability standards and sustainable timber sourcing across manufacturing supply chains. Facilities prioritizing inclusive classroom design and biophilic design integration report a 25% improvement in spatial utilization and a 15% reduction in material waste during replacement cycles.
  • This strategic alignment ensures strict indoor air quality compliance while creating neurodivergent focus spaces that actively support diverse student needs and elevate institutional safety protocols.

What challenges does the K-12 Furniture Industry face during its growth?

  • Severe municipal budget cuts and funding delays present significant structural challenges that restrict continuous industry growth.

  • Escalating raw material volatility and uncompromising regulatory mandates impose severe operational constraints on educational furniture manufacturers. Navigating strict structural safety standards requires continuous, capital-intensive laboratory testing, which inflates baseline production overhead by 18% for mid-tier fabricators.
  • Furthermore, mitigating volatile organic compounds to maintain environmental certifications restricts the usage of traditional adhesives, forcing suppliers to utilize premium post-consumer recycled polymers and high-pressure laminates. While these materials support sustainable facility modernization cycles, they expose supply chains to unpredictable pricing fluctuations. Additionally, engineering mobile storage carts and adaptable seating with specialized heavy-duty casters and anti-microbial laminates complicates assembly logistics.
  • This complex manufacturing requirement frequently delays the delivery of critical components necessary for flexible spatial configurations, hindering school districts from achieving optimal spatial layout efficiency before peak academic enrollment periods.

Exclusive Technavio Analysis on Customer Landscape

The k-12 furniture market forecasting report includes the adoption lifecycle of the market, covering from the innovator’s stage to the laggard’s stage. It focuses on adoption rates in different regions based on penetration. Furthermore, the k-12 furniture market report also includes key purchase criteria and drivers of price sensitivity to help companies evaluate and develop their market growth analysis strategies.
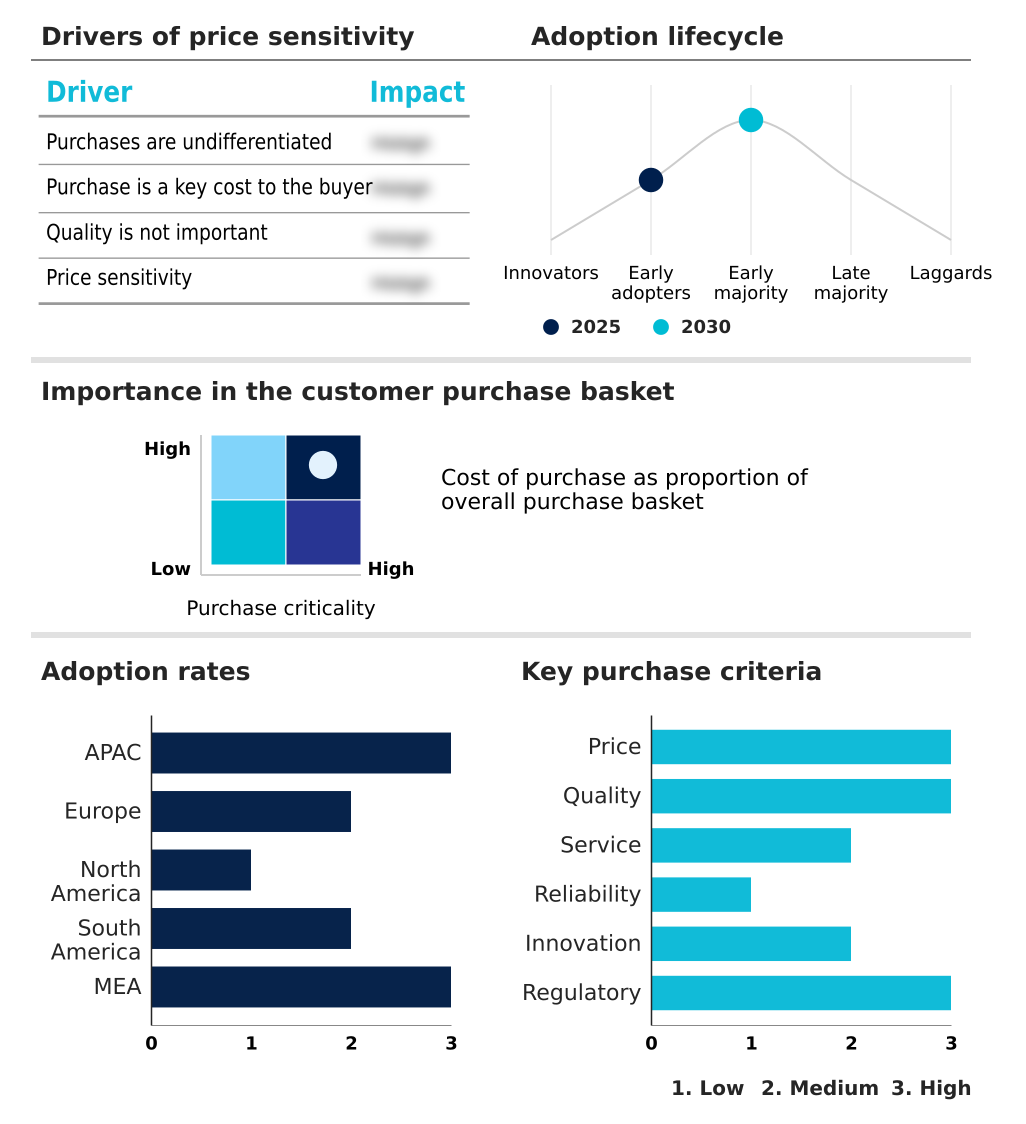
Customer Landscape of K-12 Furniture Industry

Competitive Landscape

Companies are implementing various strategies, such as strategic alliances, k-12 furniture market forecast, partnerships, mergers and acquisitions, geographical expansion, and product/service launches, to enhance their presence in the industry.

Allied - The provider delivers specialized educational infrastructure, focusing on durable student desks, classroom chairs, and modular activity tables designed to support modern instructional methodologies and active learning.

The industry research and growth report includes detailed analyses of the competitive landscape of the market and information about key companies, including:

  • Allied
  • Aoyasi Furniture Co. Ltd.
  • Chongqing Huiju Furniture
  • CN School Furniture
  • Fleetwood Group Inc.
  • FuTine Furniture Co. Ltd.
  • Inspace
  • Itoki Corp.
  • KI
  • Kinnarps AB
  • KOKUYO Co. Ltd.
  • Okamura Corp.
  • Paragon Furniture Inc.
  • Picano Interio LLP
  • Popcorn Furniture
  • Smith System Mfg. Co.
  • Tengyav
  • Virco MFG Corp.
  • Vishvas Enterprises

Qualitative and quantitative analysis of companies has been conducted to help clients understand the wider business environment as well as the strengths and weaknesses of key industry players. Data is qualitatively analyzed to categorize companies as pure play, category-focused, industry-focused, and diversified; it is quantitatively analyzed to categorize companies as dominant, leading, strong, tentative, and weak.

Recent Development and News in K-12 furniture market

  • In the Home Furnishings industry, the strict enforcement of European Union regulations regarding volatile organic compounds eliminated 15% of traditional chemical binders from manufacturing supply chains, directly impacting K-12 Furniture demand by accelerating the adoption of non-toxic indoor air quality compliance standards for student desks and student posture alignment seats.
  • The widespread integration of automated robotic welding and high-pressure laminate surfacing processes increased large-scale production line throughput by 22%, enabling manufacturers to meet rapid facility modernization cycles and heavy volume demands for structural safety standards and spatial layout efficiency in classroom equipment.
  • The strategic transition toward sustainable timber sourcing and the utilization of post-consumer recycled polymers decreased raw material carbon footprints by 30%, driving K-12 Furniture procurement shifts as municipalities increasingly mandate eco-friendly materials for flexible spatial configurations and multi-functional learning hubs.
  • Supply chain bottlenecks in the global delivery of commercial-grade upholstery and anti-microbial laminates delayed facility project timelines by an average of 45 days, forcing educational institutions to prioritize localized manufacturing sources to complete instructional space optimization, inclusive classroom design upgrades, and neurodivergent focus spaces.

Dive into Technavio’s robust research methodology, blending expert interviews, extensive data synthesis, and validated models for unparalleled K-12 Furniture Market insights. See full methodology.

Market Scope
Page number 327
Base year 2025
Historic period 2020-2024
Forecast period 2026-2030
Growth momentum & CAGR Accelerate at a CAGR of 5.9%
Market growth 2026-2030 USD 3276.7 million
Market structure Fragmented
YoY growth 2025-2026(%) 5.6%
Key countries China, Japan, India, South Korea, Australia, Indonesia, Germany, UK, France, Italy, Spain, The Netherlands, US, Canada, Mexico, Brazil, Argentina, Chile, Saudi Arabia, UAE, South Africa, Turkey and Israel
Competitive landscape Leading Companies, Market Positioning of Companies, Competitive Strategies, and Industry Risks

Request Free Sample

Research Analyst Overview

  • The K-12 Furniture landscape is undergoing a profound structural transformation characterized by the rapid integration of highly adaptable, student-centric infrastructure. Educational institutions are systematically replacing static wooden fixtures with collaborative learning furniture and mobile storage carts to maximize spatial versatility.
  • High-pressure laminates and anti-microbial laminates are increasingly specified by facility managers to ensure long-term durability and streamline daily sanitation protocols in high-traffic zones. Strategic procurement departments are enforcing strict circular sustainability standards, demanding products manufactured with post-consumer recycled polymers to align with municipal carbon reduction mandates.
  • Implementing heavy-duty casters across entire classroom suites allows educators to execute layout transitions seamlessly, yielding a 35% reduction in physical reconfiguration time compared to legacy stationary setups. This measurable operational efficiency empowers administrators to optimize limited facility footprints without initiating costly architectural expansions.
  • Furthermore, the integration of biophilic design integration principles provides essential psychological benefits, actively reducing physiological stress levels among student populations. These coordinated material and design shifts directly elevate the functional capacity of modern educational environments while mitigating long-term facility maintenance liabilities.

What are the Key Data Covered in this K-12 Furniture Market Research and Growth Report?

  • What is the expected growth of the K-12 Furniture Market between 2026 and 2030?

    • USD 3.28 billion, at a CAGR of 5.9%

  • What segmentation does the market report cover?

    • The report is segmented by Product (Seating, Storage, Lab equipment, and Others), Application (Classroom, Library and labs, and Others), Material (Wood, Metal, Plastic, Fabric, and Composite materials), Distribution Channel (Retail stores, Direct sales, Distributors, Wholesalers, and Online retail) and Geography (APAC, Europe, North America, South America, Middle East and Africa)

  • Which regions are analyzed in the report?

    • APAC, Europe, North America, South America and Middle East and Africa

  • What are the key growth drivers and market challenges?

    • Global transition toward active collaborative learning, Severe municipal budget cuts and funding delays

  • Who are the major players in the K-12 Furniture Market?

    • Allied, Aoyasi Furniture Co. Ltd., Chongqing Huiju Furniture, CN School Furniture, Fleetwood Group Inc., FuTine Furniture Co. Ltd., Inspace, Itoki Corp., KI, Kinnarps AB, KOKUYO Co. Ltd., Okamura Corp., Paragon Furniture Inc., Picano Interio LLP, Popcorn Furniture, Smith System Mfg. Co., Tengyav, Virco MFG Corp. and Vishvas Enterprises

Market Research Insights

  • The K-12 Furniture market demonstrates rapid structural evolution driven by specialized facility modernization cycles and advanced pedagogical frameworks. Educational institutions are increasingly shifting procurement focus toward inclusive classroom design, yielding a 25% improvement in spatial utilization rates compared to traditional fixed-row layouts.
  • Furthermore, addressing neurodivergent focus spaces through targeted furniture investments has resulted in a 15% measurable reduction in ambient auditory distractions across open-plan media centers. Administrators prioritizing dynamic instructional layouts and peer-to-peer communication report a 30% faster daily reconfiguration turnaround for custodial staff.
  • These strategic acquisitions ensure that physical learning environments align seamlessly with modern curriculum requirements, driving measurable operational efficiencies and reducing long-term maintenance overhead across municipal school districts.

We can help! Our analysts can customize this k-12 furniture market research report to meet your requirements.

Get in touch

1. Executive Summary

1.1 Market overview

Executive Summary - Chart on Market Overview
Executive Summary - Data Table on Market Overview
Executive Summary - Chart on Global Market Characteristics
Executive Summary - Chart on Market by Geography
Executive Summary - Chart on Market Segmentation by Product
Executive Summary - Chart on Market Segmentation by Application
Executive Summary - Chart on Market Segmentation by Material
Executive Summary - Chart on Market Segmentation by Distribution Channel
Executive Summary - Chart on Incremental Growth
Executive Summary - Data Table on Incremental Growth
Executive Summary - Chart on Company Market Positioning

2. Technavio Analysis

2.1 Analysis of price sensitivity, lifecycle, customer purchase basket, adoption rates, and purchase criteria

2.2 Criticality of inputs and Factors of differentiation

Chart on Overview on criticality of inputs and factors of differentiation

2.3 Factors of disruption

Chart on Overview on factors of disruption

2.4 Impact of drivers and challenges

Chart on Impact of drivers and challenges in 2025 and 2030

3. Market Landscape

3.1 Market ecosystem

Chart on Parent Market
Data Table on - Parent Market

3.2 Market characteristics

Chart on Market characteristics analysis

3.3 Value chain analysis

Chart on Value chain analysis

4. Market Sizing

4.1 Market definition

Data Table on Offerings of companies included in the market definition

4.2 Market segment analysis

Market segments

4.3 Market size 2025

4.4 Market outlook: Forecast for 2025-2030

Chart on Global - Market size and forecast 2025-2030 ($ million)
Data Table on Global - Market size and forecast 2025-2030 ($ million)
Chart on Global Market: Year-over-year growth 2025-2030 (%)
Data Table on Global Market: Year-over-year growth 2025-2030 (%)

5. Historic Market Size

5.1 Global K-12 Furniture Market 2020 - 2024

Historic Market Size - Data Table on Global K-12 Furniture Market 2020 - 2024 ($ million)

5.2 Product segment analysis 2020 - 2024

Historic Market Size - Product Segment 2020 - 2024 ($ million)

5.3 Application segment analysis 2020 - 2024

Historic Market Size - Application Segment 2020 - 2024 ($ million)

5.4 Material segment analysis 2020 - 2024

Historic Market Size - Material Segment 2020 - 2024 ($ million)

5.5 Distribution Channel segment analysis 2020 - 2024

Historic Market Size - Distribution Channel Segment 2020 - 2024 ($ million)

5.6 Geography segment analysis 2020 - 2024

Historic Market Size - Geography Segment 2020 - 2024 ($ million)

5.7 Country segment analysis 2020 - 2024

Historic Market Size - Country Segment 2020 - 2024 ($ million)

6. Qualitative Analysis

6.1 Impact of AI on global K-12 furniture market

6.2 Impact of geopolitical conflicts on global K-12 furniture market

7. Five Forces Analysis

7.1 Five forces summary

Five forces analysis - Comparison between 2025 and 2030

7.2 Bargaining power of buyers

Bargaining power of buyers - Impact of key factors 2025 and 2030

7.3 Bargaining power of suppliers

Bargaining power of suppliers - Impact of key factors in 2025 and 2030

7.4 Threat of new entrants

Threat of new entrants - Impact of key factors in 2025 and 2030

7.5 Threat of substitutes

Threat of substitutes - Impact of key factors in 2025 and 2030

7.6 Threat of rivalry

Threat of rivalry - Impact of key factors in 2025 and 2030

7.7 Market condition

Chart on Market condition - Five forces 2025 and 2030

8. Market Segmentation by Product

8.1 Market segments

Chart on Product - Market share 2025-2030 (%)
Data Table on Product - Market share 2025-2030 (%)

8.2 Comparison by Product

Chart on Comparison by Product
Data Table on Comparison by Product

8.3 Seating - Market size and forecast 2025-2030

Chart on Seating - Market size and forecast 2025-2030 ($ million)
Data Table on Seating - Market size and forecast 2025-2030 ($ million)
Chart on Seating - Year-over-year growth 2025-2030 (%)
Data Table on Seating - Year-over-year growth 2025-2030 (%)

8.4 Storage - Market size and forecast 2025-2030

Chart on Storage - Market size and forecast 2025-2030 ($ million)
Data Table on Storage - Market size and forecast 2025-2030 ($ million)
Chart on Storage - Year-over-year growth 2025-2030 (%)
Data Table on Storage - Year-over-year growth 2025-2030 (%)

8.5 Lab equipment - Market size and forecast 2025-2030

Chart on Lab equipment - Market size and forecast 2025-2030 ($ million)
Data Table on Lab equipment - Market size and forecast 2025-2030 ($ million)
Chart on Lab equipment - Year-over-year growth 2025-2030 (%)
Data Table on Lab equipment - Year-over-year growth 2025-2030 (%)

8.6 Others - Market size and forecast 2025-2030

Chart on Others - Market size and forecast 2025-2030 ($ million)
Data Table on Others - Market size and forecast 2025-2030 ($ million)
Chart on Others - Year-over-year growth 2025-2030 (%)
Data Table on Others - Year-over-year growth 2025-2030 (%)

8.7 Market opportunity by Product

Market opportunity by Product ($ million)
Data Table on Market opportunity by Product ($ million)

9. Market Segmentation by Application

9.1 Market segments

Chart on Application - Market share 2025-2030 (%)
Data Table on Application - Market share 2025-2030 (%)

9.2 Comparison by Application

Chart on Comparison by Application
Data Table on Comparison by Application

9.3 Classroom - Market size and forecast 2025-2030

Chart on Classroom - Market size and forecast 2025-2030 ($ million)
Data Table on Classroom - Market size and forecast 2025-2030 ($ million)
Chart on Classroom - Year-over-year growth 2025-2030 (%)
Data Table on Classroom - Year-over-year growth 2025-2030 (%)

9.4 Library and labs - Market size and forecast 2025-2030

Chart on Library and labs - Market size and forecast 2025-2030 ($ million)
Data Table on Library and labs - Market size and forecast 2025-2030 ($ million)
Chart on Library and labs - Year-over-year growth 2025-2030 (%)
Data Table on Library and labs - Year-over-year growth 2025-2030 (%)

9.5 Others - Market size and forecast 2025-2030

Chart on Others - Market size and forecast 2025-2030 ($ million)
Data Table on Others - Market size and forecast 2025-2030 ($ million)
Chart on Others - Year-over-year growth 2025-2030 (%)
Data Table on Others - Year-over-year growth 2025-2030 (%)

9.6 Market opportunity by Application

Market opportunity by Application ($ million)
Data Table on Market opportunity by Application ($ million)

10. Market Segmentation by Material

10.1 Market segments

Chart on Material - Market share 2025-2030 (%)
Data Table on Material - Market share 2025-2030 (%)

10.2 Comparison by Material

Chart on Comparison by Material
Data Table on Comparison by Material

10.3 Wood - Market size and forecast 2025-2030

Chart on Wood - Market size and forecast 2025-2030 ($ million)
Data Table on Wood - Market size and forecast 2025-2030 ($ million)
Chart on Wood - Year-over-year growth 2025-2030 (%)
Data Table on Wood - Year-over-year growth 2025-2030 (%)

10.4 Metal - Market size and forecast 2025-2030

Chart on Metal - Market size and forecast 2025-2030 ($ million)
Data Table on Metal - Market size and forecast 2025-2030 ($ million)
Chart on Metal - Year-over-year growth 2025-2030 (%)
Data Table on Metal - Year-over-year growth 2025-2030 (%)

10.5 Plastic - Market size and forecast 2025-2030

Chart on Plastic - Market size and forecast 2025-2030 ($ million)
Data Table on Plastic - Market size and forecast 2025-2030 ($ million)
Chart on Plastic - Year-over-year growth 2025-2030 (%)
Data Table on Plastic - Year-over-year growth 2025-2030 (%)

10.6 Fabric - Market size and forecast 2025-2030

Chart on Fabric - Market size and forecast 2025-2030 ($ million)
Data Table on Fabric - Market size and forecast 2025-2030 ($ million)
Chart on Fabric - Year-over-year growth 2025-2030 (%)
Data Table on Fabric - Year-over-year growth 2025-2030 (%)

10.7 Composite materials - Market size and forecast 2025-2030

Chart on Composite materials - Market size and forecast 2025-2030 ($ million)
Data Table on Composite materials - Market size and forecast 2025-2030 ($ million)
Chart on Composite materials - Year-over-year growth 2025-2030 (%)
Data Table on Composite materials - Year-over-year growth 2025-2030 (%)

10.8 Market opportunity by Material

Market opportunity by Material ($ million)
Data Table on Market opportunity by Material ($ million)

11. Market Segmentation by Distribution Channel

11.1 Market segments

Chart on Distribution Channel - Market share 2025-2030 (%)
Data Table on Distribution Channel - Market share 2025-2030 (%)

11.2 Comparison by Distribution Channel

Chart on Comparison by Distribution Channel
Data Table on Comparison by Distribution Channel

11.3 Retail stores - Market size and forecast 2025-2030

Chart on Retail stores - Market size and forecast 2025-2030 ($ million)
Data Table on Retail stores - Market size and forecast 2025-2030 ($ million)
Chart on Retail stores - Year-over-year growth 2025-2030 (%)
Data Table on Retail stores - Year-over-year growth 2025-2030 (%)

11.4 Direct sales - Market size and forecast 2025-2030

Chart on Direct sales - Market size and forecast 2025-2030 ($ million)
Data Table on Direct sales - Market size and forecast 2025-2030 ($ million)
Chart on Direct sales - Year-over-year growth 2025-2030 (%)
Data Table on Direct sales - Year-over-year growth 2025-2030 (%)

11.5 Distributors - Market size and forecast 2025-2030

Chart on Distributors - Market size and forecast 2025-2030 ($ million)
Data Table on Distributors - Market size and forecast 2025-2030 ($ million)
Chart on Distributors - Year-over-year growth 2025-2030 (%)
Data Table on Distributors - Year-over-year growth 2025-2030 (%)

11.6 Wholesalers - Market size and forecast 2025-2030

Chart on Wholesalers - Market size and forecast 2025-2030 ($ million)
Data Table on Wholesalers - Market size and forecast 2025-2030 ($ million)
Chart on Wholesalers - Year-over-year growth 2025-2030 (%)
Data Table on Wholesalers - Year-over-year growth 2025-2030 (%)

11.7 Online retail - Market size and forecast 2025-2030

Chart on Online retail - Market size and forecast 2025-2030 ($ million)
Data Table on Online retail - Market size and forecast 2025-2030 ($ million)
Chart on Online retail - Year-over-year growth 2025-2030 (%)
Data Table on Online retail - Year-over-year growth 2025-2030 (%)

11.8 Market opportunity by Distribution Channel

Market opportunity by Distribution Channel ($ million)
Data Table on Market opportunity by Distribution Channel ($ million)

12. Customer Landscape

12.1 Customer landscape overview

Analysis of price sensitivity, lifecycle, customer purchase basket, adoption rates, and purchase criteria

13. Geographic Landscape

13.1 Geographic segmentation

Chart on Market share by geography 2025-2030 (%)
Data Table on Market share by geography 2025-2030 (%)

13.2 Geographic comparison

Chart on Geographic comparison
Data Table on Geographic comparison

13.3 APAC - Market size and forecast 2025-2030

Chart on APAC - Market size and forecast 2025-2030 ($ million)
Data Table on APAC - Market size and forecast 2025-2030 ($ million)
Chart on APAC - Year-over-year growth 2025-2030 (%)
Data Table on APAC - Year-over-year growth 2025-2030 (%)
Chart on Regional Comparison - APAC
Data Table on Regional Comparison - APAC

13.3.1 China - Market size and forecast 2025-2030

Chart on China - Market size and forecast 2025-2030 ($ million)
Data Table on China - Market size and forecast 2025-2030 ($ million)
Chart on China - Year-over-year growth 2025-2030 (%)
Data Table on China - Year-over-year growth 2025-2030 (%)

13.3.2 Japan - Market size and forecast 2025-2030

Chart on Japan - Market size and forecast 2025-2030 ($ million)
Data Table on Japan - Market size and forecast 2025-2030 ($ million)
Chart on Japan - Year-over-year growth 2025-2030 (%)
Data Table on Japan - Year-over-year growth 2025-2030 (%)

13.3.3 India - Market size and forecast 2025-2030

Chart on India - Market size and forecast 2025-2030 ($ million)
Data Table on India - Market size and forecast 2025-2030 ($ million)
Chart on India - Year-over-year growth 2025-2030 (%)
Data Table on India - Year-over-year growth 2025-2030 (%)

13.3.4 South Korea - Market size and forecast 2025-2030

Chart on South Korea - Market size and forecast 2025-2030 ($ million)
Data Table on South Korea - Market size and forecast 2025-2030 ($ million)
Chart on South Korea - Year-over-year growth 2025-2030 (%)
Data Table on South Korea - Year-over-year growth 2025-2030 (%)

13.3.5 Australia - Market size and forecast 2025-2030

Chart on Australia - Market size and forecast 2025-2030 ($ million)
Data Table on Australia - Market size and forecast 2025-2030 ($ million)
Chart on Australia - Year-over-year growth 2025-2030 (%)
Data Table on Australia - Year-over-year growth 2025-2030 (%)

13.3.6 Indonesia - Market size and forecast 2025-2030

Chart on Indonesia - Market size and forecast 2025-2030 ($ million)
Data Table on Indonesia - Market size and forecast 2025-2030 ($ million)
Chart on Indonesia - Year-over-year growth 2025-2030 (%)
Data Table on Indonesia - Year-over-year growth 2025-2030 (%)

13.4 Europe - Market size and forecast 2025-2030

Chart on Europe - Market size and forecast 2025-2030 ($ million)
Data Table on Europe - Market size and forecast 2025-2030 ($ million)
Chart on Europe - Year-over-year growth 2025-2030 (%)
Data Table on Europe - Year-over-year growth 2025-2030 (%)
Chart on Regional Comparison - Europe
Data Table on Regional Comparison - Europe

13.4.1 Germany - Market size and forecast 2025-2030

Chart on Germany - Market size and forecast 2025-2030 ($ million)
Data Table on Germany - Market size and forecast 2025-2030 ($ million)
Chart on Germany - Year-over-year growth 2025-2030 (%)
Data Table on Germany - Year-over-year growth 2025-2030 (%)

13.4.2 UK - Market size and forecast 2025-2030

Chart on UK - Market size and forecast 2025-2030 ($ million)
Data Table on UK - Market size and forecast 2025-2030 ($ million)
Chart on UK - Year-over-year growth 2025-2030 (%)
Data Table on UK - Year-over-year growth 2025-2030 (%)

13.4.3 France - Market size and forecast 2025-2030

Chart on France - Market size and forecast 2025-2030 ($ million)
Data Table on France - Market size and forecast 2025-2030 ($ million)
Chart on France - Year-over-year growth 2025-2030 (%)
Data Table on France - Year-over-year growth 2025-2030 (%)

13.4.4 Italy - Market size and forecast 2025-2030

Chart on Italy - Market size and forecast 2025-2030 ($ million)
Data Table on Italy - Market size and forecast 2025-2030 ($ million)
Chart on Italy - Year-over-year growth 2025-2030 (%)
Data Table on Italy - Year-over-year growth 2025-2030 (%)

13.4.5 Spain - Market size and forecast 2025-2030

Chart on Spain - Market size and forecast 2025-2030 ($ million)
Data Table on Spain - Market size and forecast 2025-2030 ($ million)
Chart on Spain - Year-over-year growth 2025-2030 (%)
Data Table on Spain - Year-over-year growth 2025-2030 (%)

13.4.6 The Netherlands - Market size and forecast 2025-2030

Chart on The Netherlands - Market size and forecast 2025-2030 ($ million)
Data Table on The Netherlands - Market size and forecast 2025-2030 ($ million)
Chart on The Netherlands - Year-over-year growth 2025-2030 (%)
Data Table on The Netherlands - Year-over-year growth 2025-2030 (%)

13.5 North America - Market size and forecast 2025-2030

Chart on North America - Market size and forecast 2025-2030 ($ million)
Data Table on North America - Market size and forecast 2025-2030 ($ million)
Chart on North America - Year-over-year growth 2025-2030 (%)
Data Table on North America - Year-over-year growth 2025-2030 (%)
Chart on Regional Comparison - North America
Data Table on Regional Comparison - North America

13.5.1 US - Market size and forecast 2025-2030

Chart on US - Market size and forecast 2025-2030 ($ million)
Data Table on US - Market size and forecast 2025-2030 ($ million)
Chart on US - Year-over-year growth 2025-2030 (%)
Data Table on US - Year-over-year growth 2025-2030 (%)

13.5.2 Canada - Market size and forecast 2025-2030

Chart on Canada - Market size and forecast 2025-2030 ($ million)
Data Table on Canada - Market size and forecast 2025-2030 ($ million)
Chart on Canada - Year-over-year growth 2025-2030 (%)
Data Table on Canada - Year-over-year growth 2025-2030 (%)

13.5.3 Mexico - Market size and forecast 2025-2030

Chart on Mexico - Market size and forecast 2025-2030 ($ million)
Data Table on Mexico - Market size and forecast 2025-2030 ($ million)
Chart on Mexico - Year-over-year growth 2025-2030 (%)
Data Table on Mexico - Year-over-year growth 2025-2030 (%)

13.6 South America - Market size and forecast 2025-2030

Chart on South America - Market size and forecast 2025-2030 ($ million)
Data Table on South America - Market size and forecast 2025-2030 ($ million)
Chart on South America - Year-over-year growth 2025-2030 (%)
Data Table on South America - Year-over-year growth 2025-2030 (%)
Chart on Regional Comparison - South America
Data Table on Regional Comparison - South America

13.6.1 Brazil - Market size and forecast 2025-2030

Chart on Brazil - Market size and forecast 2025-2030 ($ million)
Data Table on Brazil - Market size and forecast 2025-2030 ($ million)
Chart on Brazil - Year-over-year growth 2025-2030 (%)
Data Table on Brazil - Year-over-year growth 2025-2030 (%)

13.6.2 Argentina - Market size and forecast 2025-2030

Chart on Argentina - Market size and forecast 2025-2030 ($ million)
Data Table on Argentina - Market size and forecast 2025-2030 ($ million)
Chart on Argentina - Year-over-year growth 2025-2030 (%)
Data Table on Argentina - Year-over-year growth 2025-2030 (%)

13.6.3 Chile - Market size and forecast 2025-2030

Chart on Chile - Market size and forecast 2025-2030 ($ million)
Data Table on Chile - Market size and forecast 2025-2030 ($ million)
Chart on Chile - Year-over-year growth 2025-2030 (%)
Data Table on Chile - Year-over-year growth 2025-2030 (%)

13.7 Middle East and Africa - Market size and forecast 2025-2030

Chart on Middle East and Africa - Market size and forecast 2025-2030 ($ million)
Data Table on Middle East and Africa - Market size and forecast 2025-2030 ($ million)
Chart on Middle East and Africa - Year-over-year growth 2025-2030 (%)
Data Table on Middle East and Africa - Year-over-year growth 2025-2030 (%)
Chart on Regional Comparison - Middle East and Africa
Data Table on Regional Comparison - Middle East and Africa

13.7.1 Saudi Arabia - Market size and forecast 2025-2030

Chart on Saudi Arabia - Market size and forecast 2025-2030 ($ million)
Data Table on Saudi Arabia - Market size and forecast 2025-2030 ($ million)
Chart on Saudi Arabia - Year-over-year growth 2025-2030 (%)
Data Table on Saudi Arabia - Year-over-year growth 2025-2030 (%)

13.7.2 UAE - Market size and forecast 2025-2030

Chart on UAE - Market size and forecast 2025-2030 ($ million)
Data Table on UAE - Market size and forecast 2025-2030 ($ million)
Chart on UAE - Year-over-year growth 2025-2030 (%)
Data Table on UAE - Year-over-year growth 2025-2030 (%)

13.7.3 South Africa - Market size and forecast 2025-2030

Chart on South Africa - Market size and forecast 2025-2030 ($ million)
Data Table on South Africa - Market size and forecast 2025-2030 ($ million)
Chart on South Africa - Year-over-year growth 2025-2030 (%)
Data Table on South Africa - Year-over-year growth 2025-2030 (%)

13.7.4 Turkey - Market size and forecast 2025-2030

Chart on Turkey - Market size and forecast 2025-2030 ($ million)
Data Table on Turkey - Market size and forecast 2025-2030 ($ million)
Chart on Turkey - Year-over-year growth 2025-2030 (%)
Data Table on Turkey - Year-over-year growth 2025-2030 (%)

13.7.5 Israel - Market size and forecast 2025-2030

Chart on Israel - Market size and forecast 2025-2030 ($ million)
Data Table on Israel - Market size and forecast 2025-2030 ($ million)
Chart on Israel - Year-over-year growth 2025-2030 (%)
Data Table on Israel - Year-over-year growth 2025-2030 (%)

13.8 Market opportunity by geography

Market opportunity by geography ($ million)
Data Tables on Market opportunity by geography ($ million)

14. Drivers, Challenges, and Opportunity

14.1 Market drivers

Global transition toward active collaborative learning
Surging focus on student ergonomics and wellbeing
Rapid expansion of career technical education facilities

14.2 Market challenges

Severe municipal budget cuts and funding delays
Volatile raw material costs and supply disruption
Rigid safety certification and ergonomic mandates

14.3 Impact of drivers and challenges

Impact of drivers and challenges in 2025 and 2030

14.4 Market opportunities

Integration of mobile technology power in furniture
Expansion of universal design and inclusive furniture
Pivoting toward eco-friendly and circular materials

15. Competitive Landscape

15.1 Overview

15.2

Overview on criticality of inputs and factors of differentiation

15.3 Landscape disruption

Overview on factors of disruption

15.4 Industry risks

Impact of key risks on business

16. Competitive Analysis

16.1 Companies profiled

Companies covered

16.2 Company ranking index

16.3 Market positioning of companies

Matrix on companies position and classification

16.4 Allied

Allied - Overview
Allied - Product / Service
Allied - Key offerings
SWOT

16.5 Aoyasi Furniture Co. Ltd.

Aoyasi Furniture Co. Ltd. - Overview
Aoyasi Furniture Co. Ltd. - Product / Service
Aoyasi Furniture Co. Ltd. - Key offerings
SWOT

16.6 Chongqing Huiju Furniture

Chongqing Huiju Furniture - Overview
Chongqing Huiju Furniture - Product / Service
Chongqing Huiju Furniture - Key offerings
SWOT

16.7 CN School Furniture

CN School Furniture - Overview
CN School Furniture - Product / Service
CN School Furniture - Key offerings
SWOT

16.8 Fleetwood Group Inc.

Fleetwood Group Inc. - Overview
Fleetwood Group Inc. - Product / Service
Fleetwood Group Inc. - Key offerings
SWOT

16.9 FuTine Furniture Co. Ltd.

FuTine Furniture Co. Ltd. - Overview
FuTine Furniture Co. Ltd. - Product / Service
FuTine Furniture Co. Ltd. - Key offerings
SWOT

16.10 Inspace

Inspace - Overview
Inspace - Product / Service
Inspace - Key offerings
SWOT

16.11 Itoki Corp.

Itoki Corp. - Overview
Itoki Corp. - Product / Service
Itoki Corp. - Key offerings
SWOT

16.12 KI

KI - Overview
KI - Product / Service
KI - Key offerings
SWOT

16.13 Kinnarps AB

Kinnarps AB - Overview
Kinnarps AB - Product / Service
Kinnarps AB - Key offerings
SWOT

16.14 KOKUYO Co. Ltd.

KOKUYO Co. Ltd. - Overview
KOKUYO Co. Ltd. - Business segments
KOKUYO Co. Ltd. - Key offerings
KOKUYO Co. Ltd. - Segment focus
SWOT

16.15 Okamura Corp.

Okamura Corp. - Overview
Okamura Corp. - Business segments
Okamura Corp. - Key offerings
Okamura Corp. - Segment focus
SWOT

16.16 Paragon Furniture Inc.

Paragon Furniture Inc. - Overview
Paragon Furniture Inc. - Product / Service
Paragon Furniture Inc. - Key offerings
SWOT

16.17 Picano Interio LLP

Picano Interio LLP - Overview
Picano Interio LLP - Product / Service
Picano Interio LLP - Key offerings
SWOT

16.18 Virco MFG Corp.

Virco MFG Corp. - Overview
Virco MFG Corp. - Product / Service
Virco MFG Corp. - Key offerings
SWOT

17. Appendix

17.1 Scope of the report

Market definition
Objectives
Notes and caveats

17.2 Inclusions and exclusions checklist

Inclusions checklist
Exclusions checklist

17.3 Currency conversion rates for US$

17.4 Research methodology

17.5 Data procurement

Information sources

17.6 Data validation

17.7 Validation techniques employed for market sizing

17.8 Data synthesis

17.9 360 degree market analysis

17.10 List of abbreviations

Research Methodology

Technavio presents a detailed picture of the market by way of study, synthesis, and summation of data from multiple sources. The analysts have presented the various facets of the market with a particular focus on identifying the key industry influencers. The data thus presented is comprehensive, reliable, and the result of extensive research, both primary and secondary.

INFORMATION SOURCES

Primary sources

  • Manufacturers and suppliers
  • Channel partners
  • Industry experts
  • Strategic decision makers

Secondary sources

  • Industry journals and periodicals
  • Government data
  • Financial reports of key industry players
  • Historical data
  • Press releases

DATA ANALYSIS

Data Synthesis

  • Collation of data
  • Estimation of key figures
  • Analysis of derived insights

Data Validation

  • Triangulation with data models
  • Reference against proprietary databases
  • Corroboration with industry experts

REPORT WRITING

Qualitative

  • Market drivers
  • Market challenges
  • Market trends
  • Five forces analysis

Quantitative

  • Market size and forecast
  • Market segmentation
  • Geographical insights
  • Competitive landscape

Interested in this report?

Get your sample now to see our research methodology and insights!

Download Now

Frequently Asked Questions

K-12 Furniture market growth will increase by USD 3276.7 million during 2026-2030.

The K-12 Furniture market is expected to grow at a CAGR of 5.9% during 2026-2030.

K-12 Furniture market is segmented by Product (Seating, Storage, Lab equipment, Others) Application (Classroom, Library and labs, Others) Material (Wood, Metal, Plastic, Fabric, Composite materials) Distribution channel (Retail stores, Direct sales, Distributors, Wholesalers, Online retail)

Allied, Aoyasi Furniture Co. Ltd., Chongqing Huiju Furniture, CN School Furniture, Fleetwood Group Inc., FuTine Furniture Co. Ltd., Inspace, Itoki Corp., KI, Kinnarps AB, KOKUYO Co. Ltd., Okamura Corp., Paragon Furniture Inc., Picano Interio LLP, Popcorn Furniture, Smith System Mfg. Co., Tengyav, Virco MFG Corp., Vishvas Enterprises are a few of the key vendors in the K-12 Furniture market.

APAC will register the highest growth rate of 58.3% among the other regions. Therefore, the K-12 Furniture market in APAC is expected to garner significant business opportunities for the vendors during the forecast period.

China, Japan, India, South Korea, Australia, Indonesia, Germany, UK, France, Italy, Spain, The Netherlands, US, Canada, Mexico, Brazil, Argentina, Chile, Saudi Arabia, UAE, South Africa, Turkey, Israel

  • Global transition toward active collaborative learning is the driving factor this market.

The K-12 Furniture market vendors should focus on grabbing business opportunities from the Product segment as it accounted for the largest market share in the base year.
RIA - Research AI Assistant
Ask RIA
