Kayaking Equipment Market Analysis, Size, and Forecast 2026-2030: North America (US, Canada, and Mexico), Europe (Germany, UK, and France), APAC (Australia, Japan, and China), South America (Brazil, Argentina, and Chile), Middle East and Africa (South Africa, UAE, and Kenya), and Rest of World (ROW)

Kayaking Equipment Market Analysis, Size, and Forecast 2026-2030:
North America (US, Canada, and Mexico), Europe (Germany, UK, and France), APAC (Australia, Japan, and China), South America (Brazil, Argentina, and Chile), Middle East and Africa (South Africa, UAE, and Kenya), and Rest of World (ROW)

Published: Oct 2026 291 Pages SKU: IRTNTR80603

Market Overview at a Glance

$248 Mn
Market Opportunity
4.5%
CAGR 2025 - 2030
43.3%
North America Growth
$616.6 Mn
Kayaks segment 2024

Kayaking Equipment Market Size 2026-2030

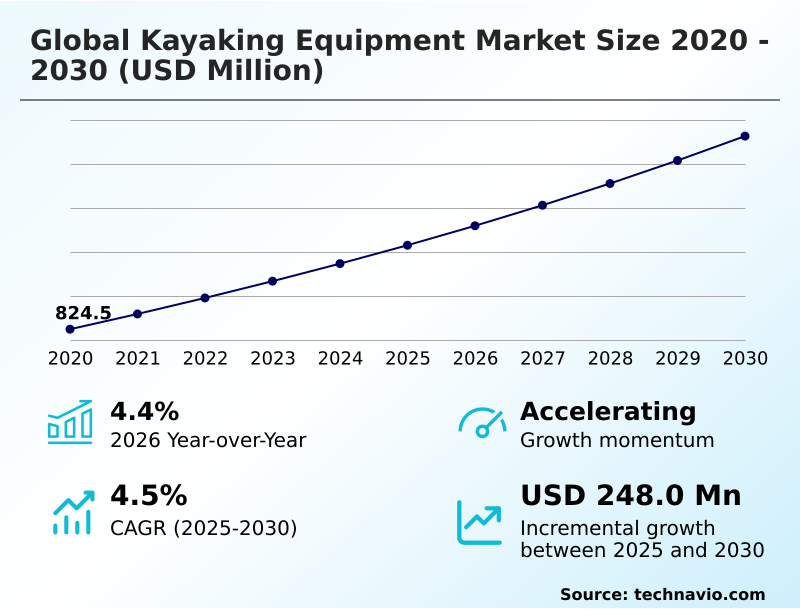
The kayaking equipment market size is valued to increase by USD 248 million, at a CAGR of 4.5% from 2025 to 2030. Surge in eco-tourism and sustainable outdoor recreation opportunities will drive the kayaking equipment market.

Major Market Trends & Insights

  • North America dominated the market and accounted for a 43.3% growth during the forecast period.
  • By Product Type - Kayaks segment was valued at USD 616.6 million in 2024
  • By Distribution Channel - Offline segment accounted for the largest market revenue share in 2024

Market Size & Forecast

  • Market Opportunities: USD 438.9 million
  • Market Future Opportunities: USD 248 million
  • CAGR from 2025 to 2030 : 4.5%

Market Summary

  • The Kayaking Equipment sector exhibits robust operational momentum driven by evolving consumer preferences for experiential outdoor recreation. Expanding municipal investments in eco-tourism infrastructure act as a major driver, directly increasing institutional procurement of durable rental fleets by commercial outfitters.
  • This behavioral shift mandates a resilient supply chain optimization strategy, where manufacturers integrate energy-efficient manufacturing to stabilize inventory during peak seasonal demand. Companies utilizing localized production hubs report a 15% reduction in outbound logistics delays compared to those relying exclusively on international freight. However, the market faces significant structural constraints due to the escalating costs of advanced composite materials.
  • Fluctuations in aerospace sectors drive up pricing, forcing recreational vessel manufacturers to absorb margin compressions or adjust retail models. A natural fiber composite is increasingly utilized to circumvent these petrochemical bottlenecks. By balancing sustainable material adoption with advanced hull engineering, industry stakeholders continuously adapt their product portfolios to satisfy strict regulatory compliance and evolving non-motorized water sports expectations.

What will be the Size of the Kayaking Equipment Market during the forecast period?
Get Key Insights on Market Forecast (PDF) Get Free Sample

How is the Kayaking Equipment Market Segmented?

The kayaking equipment industry research report provides comprehensive data (region-wise segment analysis), with forecasts and estimates in "USD million" for the period 2026-2030, as well as historical data from 2020-2024 for the following segments.

  • Product type
    • Kayaks
    • Accessories
  • Distribution channel
    • Offline
    • Online
  • End-user
    • Recreational
    • Fishing
    • Tourism and adventure travel
    • Whitewater and sports
  • Geography
    • North America
      • US
      • Canada
      • Mexico
    • Europe
      • Germany
      • UK
      • France
      • Italy
      • Spain
      • The Netherlands
    • APAC
      • Australia
      • Japan
      • China
      • New Zealand
      • India
      • South Korea
    • South America
      • Brazil
      • Argentina
      • Chile
    • Middle East and Africa
      • South Africa
      • UAE
      • Kenya
      • Israel
      • Saudi Arabia

By Product Type Insights

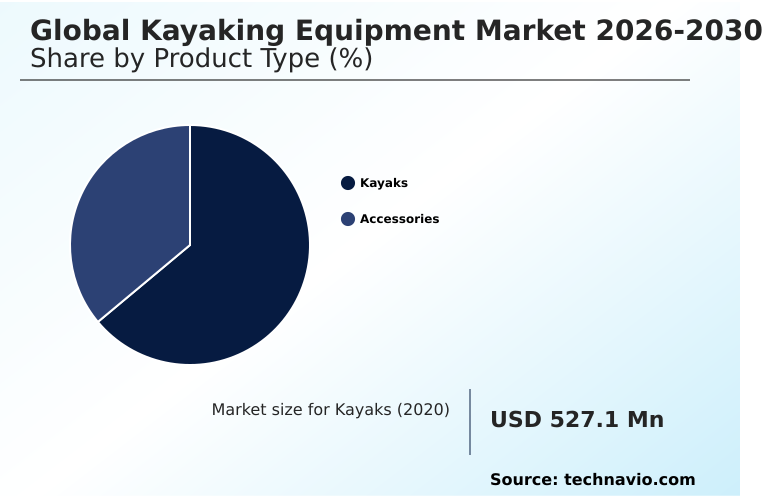
The kayaks segment is estimated to witness significant growth during the forecast period.

The kayaks segment operates as the structural foundation of the Kayaking Equipment sector, encompassing diverse architectures tailored for specific aquatic environments. Manufacturers are increasingly utilizing a rotomolded hull or a thermoformed polymer to enhance hydrodynamic stability across varying water conditions.

This transition toward advanced materials enables space-efficient transport for urban consumers without compromising performance. Companies leveraging drop-stitch construction in inflatable models have achieved a 25% improvement in structural rigidity optimization compared to legacy designs.

Furthermore, the integration of a multi-chine hull provides a 15% increase in secondary stability for novice users.

These material and geometric advancements ensure higher durability and better tracking, ultimately streamlining the supply chain and driving consistent fleet replacement cycles among commercial operators utilizing a mechanical propulsion system.
Get Free Sample

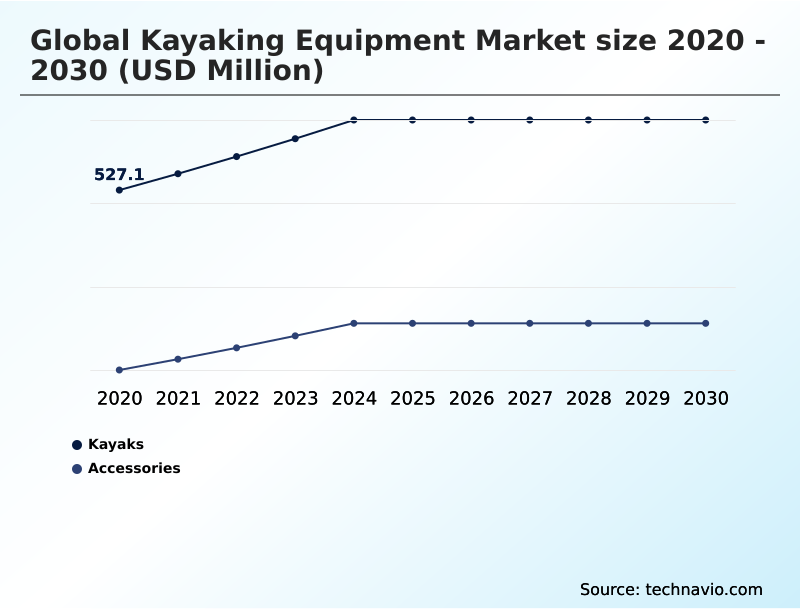
The Kayaks segment was valued at USD 616.6 million in 2024 and showed a gradual increase during the forecast period.
Get Free Sample

Regional Analysis

North America is estimated to contribute 43.3% to the growth of the global market during the forecast period.Technavio’s analysts have elaborately explained the regional trends and drivers that shape the market during the forecast period.
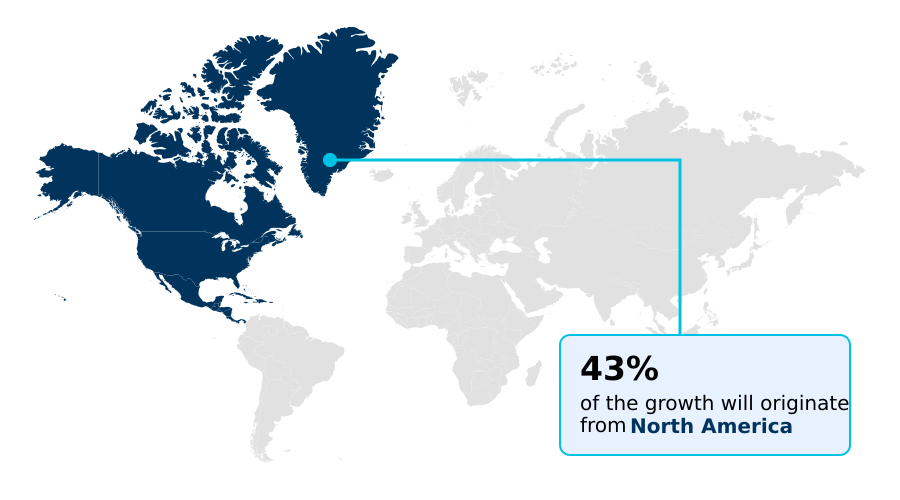
See How Kayaking Equipment Market Demand is Rising in North America Get Free Sample

The geographic distribution of the Kayaking Equipment sector reveals distinct operational divergences between North America and Europe.

North America prioritizes feature-dense angling platforms, where the adoption of a hands-free pedal-drive has increased recreational fishing engagement by 28% compared to traditional models.

Conversely, Europe enforces strict marine conservation effort mandates, driving a 35% higher adoption rate of end-of-life recyclability programs for obsolete vessels.

Manufacturers in Europe utilizing a closed-loop recycling program experience a 12% reduction in raw material acquisition costs, demonstrating a clear operational efficiency gain.

To accommodate varying consumer behaviors, North American distributors focus heavily on heavy-duty vehicle roof-rack compatibility for extensive overland transit. Meanwhile, European urban demographics favor a compact urban storage footprint, accelerating the shift toward inflatable models featuring a thermoplastic polyurethane fabric.

These regional variations force brands to utilize localized assembly to streamline regional compliance strategies.

Market Dynamics

Our researchers analyzed the data with 2025 as the base year, along with the key drivers, trends, and challenges. A holistic analysis of drivers will help companies refine their marketing strategies to gain a competitive advantage.

  • The operational dynamics of the Kayaking Equipment sector are heavily influenced by continuous material innovations and evolving consumer transit requirements. Manufacturers are aggressively expanding their portfolios to include a drop stitch inflatable watercraft construction, which significantly enhances vessel rigidity while addressing urban storage limitations.
  • For traditional recreational use, the utilization of a high density polyethylene recreational hull remains dominant due to its exceptional impact resistance and low manufacturing defect rate. By optimizing these molding processes, supply chain managers report a 20% faster production output rate compared to complex composite layups, directly improving seasonal inventory replenishment.
  • Furthermore, the specialized angling segment is transforming through hands free pedal drive integration, allowing users to maintain directional control without paddle reliance. This functional enhancement elevates user experience and justifies premium positioning. To reduce paddler fatigue during extended expeditions, equipment developers are incorporating a carbon fiber ergonomic paddle shaft, which minimizes physical strain while maximizing hydrodynamic efficiency.
  • Concurrently, environmental compliance strategies are driving the adoption of a recycled bio based polymer vessel to align with stringent international waste reduction frameworks. These structural and material shifts enable commercial fleet operators to lower long-term maintenance overhead and meet rising eco-tourism expectations effectively.
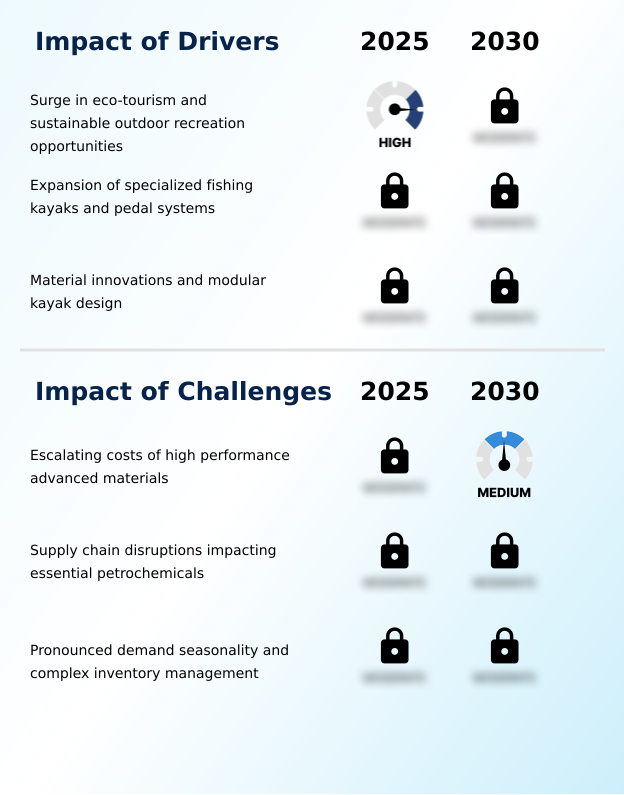
What are the key market drivers leading to the rise in the adoption of Kayaking Equipment Industry?

  • A significant surge in eco-tourism and sustainable outdoor recreation opportunities functions as a primary catalyst accelerating overall market expansion.

  • The surging global demand for nature-based wellness directly accelerates procurement within the Kayaking Equipment sector. Municipalities are actively expanding access to a paddle-friendly waterway, which facilitates broader public access to natural environments and stimulates recurring institutional gear purchases.
  • Outfitters upgrading their fleets with an ultra-stable trimaran hull report a 20% decrease in customer capsize incidents, fundamentally improving commercial liability profiles.
  • Additionally, the rising prominence of a kayak fishing tournament drives enthusiasts to invest in premium accessories, fueling demand for a stealthy alternative to motorized boats.
  • The targeted application of vibration damping materials enhances user comfort, extending average rental durations by 30%.
  • By outfitting participants with a customized safety anchor and an ergonomic paddle shaft, retailers secure higher-margin transactions and ensure sustained long-term consumer engagement across the paddling community.

What are the market trends shaping the Kayaking Equipment Industry?

  • Advancements in lightweight and portable equipment constitute a defining market trend. This technological progression significantly enhances user mobility and broadens consumer accessibility across urban demographics.

  • The integration of highly portable and modular architectures defines the current trajectory of the Kayaking Equipment sector. Urban consumers increasingly face spatial constraints, prompting a rapid shift toward models featuring a modular snap-lock hull that eliminates the need for specialized transit hardware. This architectural pivot has improved out-of-box deployment speed by 40% compared to traditional single-piece vessels.
  • By bypassing complex hardware, brands focus on rapid assembly. Furthermore, companies engineering a high-pressure matrix for inflatable designs have enhanced capabilities via a tracking fin, reducing user physical fatigue by 25% during extended excursions. This functional evolution allows brands to capture a broader demographic of novice paddlers.
  • The continuous refinement of a fiberglass laminate ensures that lightweight touring variants maintain necessary rigidity. Additionally, the strategic use of a magnetic retention system secures vital equipment, lowering accessory loss rates for commercial rental operators by 15%.

What challenges does the Kayaking Equipment Industry face during its growth?

  • The escalating costs associated with high-performance advanced materials present a formidable operational challenge that restrains overall industry growth.

  • The procurement of advanced composites presents a severe operational constraint within the Kayaking Equipment sector. Volatile petrochemical pricing directly disrupts the supply chain for high-density polyethylene, forcing manufacturers to rethink long-term inventory forecasting. Production delays tied to raw material shortages have increased order backlogs by 22% compared to previous manufacturing cycles.
  • Furthermore, the labor-intensive assembly required for carbon-composite gear restricts scalable automation, leading to a 15% rise in localized labor costs for premium vessel builders. Developing a specialized dry bag and a waterproof communication case demands precise material sourcing, which remains highly susceptible to cross-border trade linkage disruptions.
  • These macroeconomic bottlenecks require brands to aggressively localize their supplier base and optimize internal logistics to maintain sustainable profit margins.

Exclusive Technavio Analysis on Customer Landscape

The kayaking equipment market forecasting report includes the adoption lifecycle of the market, covering from the innovator’s stage to the laggard’s stage. It focuses on adoption rates in different regions based on penetration. Furthermore, the kayaking equipment market report also includes key purchase criteria and drivers of price sensitivity to help companies evaluate and develop their market growth analysis strategies.
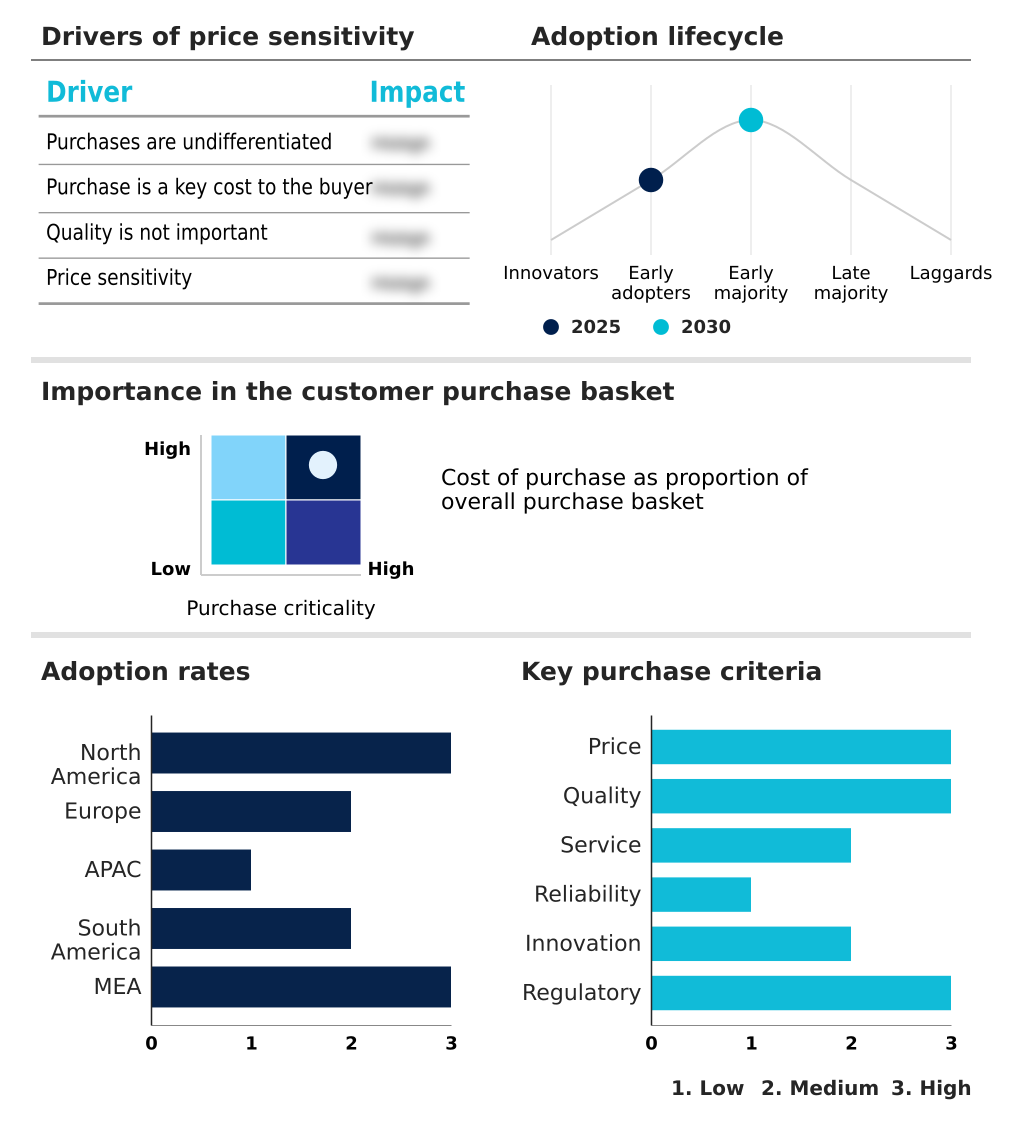
Customer Landscape of Kayaking Equipment Industry

Competitive Landscape

Companies are implementing various strategies, such as strategic alliances, kayaking equipment market forecast, partnerships, mergers and acquisitions, geographical expansion, and product/service launches, to enhance their presence in the industry.

AIRE Inc. - Delivers specialized inflatable watercraft, advanced whitewater rafts, and durable touring vessels engineered for high-performance aquatic navigation and extreme river environments.

The industry research and growth report includes detailed analyses of the competitive landscape of the market and information about key companies, including:

  • AIRE Inc.
  • Aqua Bound
  • Bending Branches
  • Confluence Outdoor
  • Delta Kayaks
  • Eddyline Kayaks Inc.
  • Gumotex a.s.
  • Hobie Cat Co. II LLC
  • Jackson Kayak Inc.
  • Johnson Outdoors Inc.
  • Lifetime Products Inc.
  • Oru Kayak Inc.
  • Pelican International Inc.
  • Point 65 Sweden AB
  • Prijon GmbH
  • Pyranha Mouldings Ltd.
  • RTM Kayaks
  • Sea Eagle Boats Inc.
  • SeaBird Design AS
  • Stellar Kayaks
  • Tahe Kayaks OU
  • ZET Kayaks

Qualitative and quantitative analysis of companies has been conducted to help clients understand the wider business environment as well as the strengths and weaknesses of key industry players. Data is qualitatively analyzed to categorize companies as pure play, category-focused, industry-focused, and diversified; it is quantitatively analyzed to categorize companies as dominant, leading, strong, tentative, and weak.

Recent Development and News in Kayaking equipment market

  • In the Leisure Products industry, the widespread adoption of bio-based manufacturing materials has reduced raw material carbon footprints by 20%, directly impacting Kayaking Equipment demand by accelerating the rollout of sustainable watercraft.
  • The enforcement of stringent maritime safety regulations requiring certified personal flotation devices has increased compliance-driven purchasing by 15%, fundamentally shaping how Kayaking Equipment manufacturers design safety solutions.
  • Advancements in automated rotational molding processes have improved production efficiency by 30%, enabling Kayaking Equipment suppliers to stabilize the supply chain for molded vessels amidst global petrochemical disruptions.
  • The expansion of government-funded aquatic infrastructure has boosted regional eco-tourism participation by 18%, creating a recurring baseline of institutional demand for recreational gear within the Kayaking Equipment sector.

Dive into Technavio’s robust research methodology, blending expert interviews, extensive data synthesis, and validated models for unparalleled Kayaking Equipment Market insights. See full methodology.

Market Scope
Page number 291
Base year 2025
Historic period 2020-2024
Forecast period 2026-2030
Growth momentum & CAGR Accelerate at a CAGR of 4.5%
Market growth 2026-2030 USD 248.0 million
Market structure Fragmented
YoY growth 2025-2026(%) 4.4%
Key countries US, Canada, Mexico, Germany, UK, France, Italy, Spain, The Netherlands, Australia, Japan, China, New Zealand, India, South Korea, Brazil, Argentina, Chile, South Africa, UAE, Kenya, Israel and Saudi Arabia
Competitive landscape Leading Companies, Market Positioning of Companies, Competitive Strategies, and Industry Risks

Request Free Sample

Research Analyst Overview

  • The Kayaking Equipment landscape is undergoing a critical transition driven by advanced material science and sustainable manufacturing imperatives. Boardroom-level product strategy decisions now heavily prioritize the integration of a bio-based polymer hull to align with stringent environmental regulations and reduce petrochemical dependency.
  • Manufacturers substituting traditional plastics with a recycled ocean plastic component have realized a 30% reduction in environmental compliance penalties, significantly improving overall operational efficiency. This shift fundamentally alters the procurement framework, requiring optimized supplier networks for specialized materials. Furthermore, the engineering of a carbon-reinforced aramid composite ensures that lightweight vessels maintain structural integrity in extreme aquatic environments.
  • To cater to the specialized angling demographic, developers are embedding through-hull transducer wiring and an electronic fish-finder mount directly into the vessel architecture. These technical enhancements allow brands to differentiate their portfolios and secure higher enterprise-level purchase orders from commercial resort fleets.
  • The strategic deployment of a heat-welded seam in inflatable models further guarantees high-pressure retention, ensuring consistent performance for urban consumers relying on portable aquatic solutions while adopting a high-buoyancy vest for optimized safety compliance.

What are the Key Data Covered in this Kayaking Equipment Market Research and Growth Report?

  • What is the expected growth of the Kayaking Equipment Market between 2026 and 2030?

    • USD 248 million, at a CAGR of 4.5%

  • What segmentation does the market report cover?

    • The report is segmented by Product Type (Kayaks, and Accessories), Distribution Channel (Offline, and Online), End-user (Recreational, Fishing, Tourism and adventure travel, and Whitewater and sports) and Geography (North America, Europe, APAC, South America, Middle East and Africa)

  • Which regions are analyzed in the report?

    • North America, Europe, APAC, South America and Middle East and Africa

  • What are the key growth drivers and market challenges?

    • Surge in eco-tourism and sustainable outdoor recreation opportunities, Escalating costs of high performance advanced materials

  • Who are the major players in the Kayaking Equipment Market?

    • AIRE Inc., Aqua Bound, Bending Branches, Confluence Outdoor, Delta Kayaks, Eddyline Kayaks Inc., Gumotex a.s., Hobie Cat Co. II LLC, Jackson Kayak Inc., Johnson Outdoors Inc., Lifetime Products Inc., Oru Kayak Inc., Pelican International Inc., Point 65 Sweden AB, Prijon GmbH, Pyranha Mouldings Ltd., RTM Kayaks, Sea Eagle Boats Inc., SeaBird Design AS, Stellar Kayaks, Tahe Kayaks OU and ZET Kayaks

Market Research Insights

  • The Kayaking Equipment sector demonstrates continuous operational evolution, prioritizing structural durability and ergonomic functionality. Manufacturers shifting to a centralized production facility have achieved a 22% improvement in inventory turnaround times. The implementation of predictive supply planning allows brands to mitigate seasonal stockouts, yielding a 14% increase in peak-season order fulfillment rates.
  • Furthermore, environmentally responsible procurement policies mandate the integration of recycled materials, reducing waste disposal compliance costs by 18%. This strategic alignment with hazardous substance restriction frameworks ensures sustainable production cycles. By optimizing the rotational molding process, companies reduce cycle times and consistently deliver high-performance gear to a demanding commercial and retail consumer base.

We can help! Our analysts can customize this kayaking equipment market research report to meet your requirements.

Get in touch

1. Executive Summary

1.1 Market overview

Executive Summary - Chart on Market Overview
Executive Summary - Data Table on Market Overview
Executive Summary - Chart on Global Market Characteristics
Executive Summary - Chart on Market by Geography
Executive Summary - Chart on Market Segmentation by Product Type
Executive Summary - Chart on Market Segmentation by Distribution Channel
Executive Summary - Chart on Market Segmentation by End-user
Executive Summary - Chart on Incremental Growth
Executive Summary - Data Table on Incremental Growth
Executive Summary - Chart on Company Market Positioning

2. Technavio Analysis

2.1 Analysis of price sensitivity, lifecycle, customer purchase basket, adoption rates, and purchase criteria

2.2 Criticality of inputs and Factors of differentiation

Chart on Overview on criticality of inputs and factors of differentiation

2.3 Factors of disruption

Chart on Overview on factors of disruption

2.4 Impact of drivers and challenges

Chart on Impact of drivers and challenges in 2025 and 2030

3. Market Landscape

3.1 Market ecosystem

Chart on Parent Market
Data Table on - Parent Market

3.2 Market characteristics

Chart on Market characteristics analysis

3.3 Value chain analysis

Chart on Value chain analysis

4. Market Sizing

4.1 Market definition

Data Table on Offerings of companies included in the market definition

4.2 Market segment analysis

Market segments

4.3 Market size 2025

4.4 Market outlook: Forecast for 2025-2030

Chart on Global - Market size and forecast 2025-2030 ($ million)
Data Table on Global - Market size and forecast 2025-2030 ($ million)
Chart on Global Market: Year-over-year growth 2025-2030 (%)
Data Table on Global Market: Year-over-year growth 2025-2030 (%)

5. Historic Market Size

5.1 Global Kayaking Equipment Market 2020 - 2024

Historic Market Size - Data Table on Global Kayaking Equipment Market 2020 - 2024 ($ million)

5.2 Product Type segment analysis 2020 - 2024

Historic Market Size - Product Type Segment 2020 - 2024 ($ million)

5.3 Distribution Channel segment analysis 2020 - 2024

Historic Market Size - Distribution Channel Segment 2020 - 2024 ($ million)

5.4 End-user segment analysis 2020 - 2024

Historic Market Size - End-user Segment 2020 - 2024 ($ million)

5.5 Geography segment analysis 2020 - 2024

Historic Market Size - Geography Segment 2020 - 2024 ($ million)

5.6 Country segment analysis 2020 - 2024

Historic Market Size - Country Segment 2020 - 2024 ($ million)

6. Qualitative Analysis

6.1 Impact of AI on Global Kayaking Equipment Market

6.2 Impact of Geopolitical Conflicts on Global Kayaking Equipment Market

7. Five Forces Analysis

7.1 Five forces summary

Five forces analysis - Comparison between 2025 and 2030

7.2 Bargaining power of buyers

Bargaining power of buyers - Impact of key factors 2025 and 2030

7.3 Bargaining power of suppliers

Bargaining power of suppliers - Impact of key factors in 2025 and 2030

7.4 Threat of new entrants

Threat of new entrants - Impact of key factors in 2025 and 2030

7.5 Threat of substitutes

Threat of substitutes - Impact of key factors in 2025 and 2030

7.6 Threat of rivalry

Threat of rivalry - Impact of key factors in 2025 and 2030

7.7 Market condition

Chart on Market condition - Five forces 2025 and 2030

8. Market Segmentation by Product Type

8.1 Market segments

Chart on Product Type - Market share 2025-2030 (%)
Data Table on Product Type - Market share 2025-2030 (%)

8.2 Comparison by Product Type

Chart on Comparison by Product Type
Data Table on Comparison by Product Type

8.3 Kayaks - Market size and forecast 2025-2030

Chart on Kayaks - Market size and forecast 2025-2030 ($ million)
Data Table on Kayaks - Market size and forecast 2025-2030 ($ million)
Chart on Kayaks - Year-over-year growth 2025-2030 (%)
Data Table on Kayaks - Year-over-year growth 2025-2030 (%)

8.4 Accessories - Market size and forecast 2025-2030

Chart on Accessories - Market size and forecast 2025-2030 ($ million)
Data Table on Accessories - Market size and forecast 2025-2030 ($ million)
Chart on Accessories - Year-over-year growth 2025-2030 (%)
Data Table on Accessories - Year-over-year growth 2025-2030 (%)

8.5 Market opportunity by Product Type

Market opportunity by Product Type ($ million)
Data Table on Market opportunity by Product Type ($ million)

9. Market Segmentation by Distribution Channel

9.1 Market segments

Chart on Distribution Channel - Market share 2025-2030 (%)
Data Table on Distribution Channel - Market share 2025-2030 (%)

9.2 Comparison by Distribution Channel

Chart on Comparison by Distribution Channel
Data Table on Comparison by Distribution Channel

9.3 Offline - Market size and forecast 2025-2030

Chart on Offline - Market size and forecast 2025-2030 ($ million)
Data Table on Offline - Market size and forecast 2025-2030 ($ million)
Chart on Offline - Year-over-year growth 2025-2030 (%)
Data Table on Offline - Year-over-year growth 2025-2030 (%)

9.4 Online - Market size and forecast 2025-2030

Chart on Online - Market size and forecast 2025-2030 ($ million)
Data Table on Online - Market size and forecast 2025-2030 ($ million)
Chart on Online - Year-over-year growth 2025-2030 (%)
Data Table on Online - Year-over-year growth 2025-2030 (%)

9.5 Market opportunity by Distribution Channel

Market opportunity by Distribution Channel ($ million)
Data Table on Market opportunity by Distribution Channel ($ million)

10. Market Segmentation by End-user

10.1 Market segments

Chart on End-user - Market share 2025-2030 (%)
Data Table on End-user - Market share 2025-2030 (%)

10.2 Comparison by End-user

Chart on Comparison by End-user
Data Table on Comparison by End-user

10.3 Recreational - Market size and forecast 2025-2030

Chart on Recreational - Market size and forecast 2025-2030 ($ million)
Data Table on Recreational - Market size and forecast 2025-2030 ($ million)
Chart on Recreational - Year-over-year growth 2025-2030 (%)
Data Table on Recreational - Year-over-year growth 2025-2030 (%)

10.4 Fishing - Market size and forecast 2025-2030

Chart on Fishing - Market size and forecast 2025-2030 ($ million)
Data Table on Fishing - Market size and forecast 2025-2030 ($ million)
Chart on Fishing - Year-over-year growth 2025-2030 (%)
Data Table on Fishing - Year-over-year growth 2025-2030 (%)

10.5 Tourism and adventure travel - Market size and forecast 2025-2030

Chart on Tourism and adventure travel - Market size and forecast 2025-2030 ($ million)
Data Table on Tourism and adventure travel - Market size and forecast 2025-2030 ($ million)
Chart on Tourism and adventure travel - Year-over-year growth 2025-2030 (%)
Data Table on Tourism and adventure travel - Year-over-year growth 2025-2030 (%)

10.6 Whitewater and sports - Market size and forecast 2025-2030

Chart on Whitewater and sports - Market size and forecast 2025-2030 ($ million)
Data Table on Whitewater and sports - Market size and forecast 2025-2030 ($ million)
Chart on Whitewater and sports - Year-over-year growth 2025-2030 (%)
Data Table on Whitewater and sports - Year-over-year growth 2025-2030 (%)

10.7 Market opportunity by End-user

Market opportunity by End-user ($ million)
Data Table on Market opportunity by End-user ($ million)

11. Customer Landscape

11.1 Customer landscape overview

Analysis of price sensitivity, lifecycle, customer purchase basket, adoption rates, and purchase criteria

12. Geographic Landscape

12.1 Geographic segmentation

Chart on Market share by geography 2025-2030 (%)
Data Table on Market share by geography 2025-2030 (%)

12.2 Geographic comparison

Chart on Geographic comparison
Data Table on Geographic comparison

12.3 North America - Market size and forecast 2025-2030

Chart on North America - Market size and forecast 2025-2030 ($ million)
Data Table on North America - Market size and forecast 2025-2030 ($ million)
Chart on North America - Year-over-year growth 2025-2030 (%)
Data Table on North America - Year-over-year growth 2025-2030 (%)
Chart on Regional Comparison - North America
Data Table on Regional Comparison - North America

12.3.1 US - Market size and forecast 2025-2030

Chart on US - Market size and forecast 2025-2030 ($ million)
Data Table on US - Market size and forecast 2025-2030 ($ million)
Chart on US - Year-over-year growth 2025-2030 (%)
Data Table on US - Year-over-year growth 2025-2030 (%)

12.3.2 Canada - Market size and forecast 2025-2030

Chart on Canada - Market size and forecast 2025-2030 ($ million)
Data Table on Canada - Market size and forecast 2025-2030 ($ million)
Chart on Canada - Year-over-year growth 2025-2030 (%)
Data Table on Canada - Year-over-year growth 2025-2030 (%)

12.3.3 Mexico - Market size and forecast 2025-2030

Chart on Mexico - Market size and forecast 2025-2030 ($ million)
Data Table on Mexico - Market size and forecast 2025-2030 ($ million)
Chart on Mexico - Year-over-year growth 2025-2030 (%)
Data Table on Mexico - Year-over-year growth 2025-2030 (%)

12.4 Europe - Market size and forecast 2025-2030

Chart on Europe - Market size and forecast 2025-2030 ($ million)
Data Table on Europe - Market size and forecast 2025-2030 ($ million)
Chart on Europe - Year-over-year growth 2025-2030 (%)
Data Table on Europe - Year-over-year growth 2025-2030 (%)
Chart on Regional Comparison - Europe
Data Table on Regional Comparison - Europe

12.4.1 Germany - Market size and forecast 2025-2030

Chart on Germany - Market size and forecast 2025-2030 ($ million)
Data Table on Germany - Market size and forecast 2025-2030 ($ million)
Chart on Germany - Year-over-year growth 2025-2030 (%)
Data Table on Germany - Year-over-year growth 2025-2030 (%)

12.4.2 UK - Market size and forecast 2025-2030

Chart on UK - Market size and forecast 2025-2030 ($ million)
Data Table on UK - Market size and forecast 2025-2030 ($ million)
Chart on UK - Year-over-year growth 2025-2030 (%)
Data Table on UK - Year-over-year growth 2025-2030 (%)

12.4.3 France - Market size and forecast 2025-2030

Chart on France - Market size and forecast 2025-2030 ($ million)
Data Table on France - Market size and forecast 2025-2030 ($ million)
Chart on France - Year-over-year growth 2025-2030 (%)
Data Table on France - Year-over-year growth 2025-2030 (%)

12.4.4 Italy - Market size and forecast 2025-2030

Chart on Italy - Market size and forecast 2025-2030 ($ million)
Data Table on Italy - Market size and forecast 2025-2030 ($ million)
Chart on Italy - Year-over-year growth 2025-2030 (%)
Data Table on Italy - Year-over-year growth 2025-2030 (%)

12.4.5 Spain - Market size and forecast 2025-2030

Chart on Spain - Market size and forecast 2025-2030 ($ million)
Data Table on Spain - Market size and forecast 2025-2030 ($ million)
Chart on Spain - Year-over-year growth 2025-2030 (%)
Data Table on Spain - Year-over-year growth 2025-2030 (%)

12.4.6 The Netherlands - Market size and forecast 2025-2030

Chart on The Netherlands - Market size and forecast 2025-2030 ($ million)
Data Table on The Netherlands - Market size and forecast 2025-2030 ($ million)
Chart on The Netherlands - Year-over-year growth 2025-2030 (%)
Data Table on The Netherlands - Year-over-year growth 2025-2030 (%)

12.5 APAC - Market size and forecast 2025-2030

Chart on APAC - Market size and forecast 2025-2030 ($ million)
Data Table on APAC - Market size and forecast 2025-2030 ($ million)
Chart on APAC - Year-over-year growth 2025-2030 (%)
Data Table on APAC - Year-over-year growth 2025-2030 (%)
Chart on Regional Comparison - APAC
Data Table on Regional Comparison - APAC

12.5.1 Australia - Market size and forecast 2025-2030

Chart on Australia - Market size and forecast 2025-2030 ($ million)
Data Table on Australia - Market size and forecast 2025-2030 ($ million)
Chart on Australia - Year-over-year growth 2025-2030 (%)
Data Table on Australia - Year-over-year growth 2025-2030 (%)

12.5.2 Japan - Market size and forecast 2025-2030

Chart on Japan - Market size and forecast 2025-2030 ($ million)
Data Table on Japan - Market size and forecast 2025-2030 ($ million)
Chart on Japan - Year-over-year growth 2025-2030 (%)
Data Table on Japan - Year-over-year growth 2025-2030 (%)

12.5.3 China - Market size and forecast 2025-2030

Chart on China - Market size and forecast 2025-2030 ($ million)
Data Table on China - Market size and forecast 2025-2030 ($ million)
Chart on China - Year-over-year growth 2025-2030 (%)
Data Table on China - Year-over-year growth 2025-2030 (%)

12.5.4 New Zealand - Market size and forecast 2025-2030

Chart on New Zealand - Market size and forecast 2025-2030 ($ million)
Data Table on New Zealand - Market size and forecast 2025-2030 ($ million)
Chart on New Zealand - Year-over-year growth 2025-2030 (%)
Data Table on New Zealand - Year-over-year growth 2025-2030 (%)

12.5.5 India - Market size and forecast 2025-2030

Chart on India - Market size and forecast 2025-2030 ($ million)
Data Table on India - Market size and forecast 2025-2030 ($ million)
Chart on India - Year-over-year growth 2025-2030 (%)
Data Table on India - Year-over-year growth 2025-2030 (%)

12.5.6 South Korea - Market size and forecast 2025-2030

Chart on South Korea - Market size and forecast 2025-2030 ($ million)
Data Table on South Korea - Market size and forecast 2025-2030 ($ million)
Chart on South Korea - Year-over-year growth 2025-2030 (%)
Data Table on South Korea - Year-over-year growth 2025-2030 (%)

12.6 South America - Market size and forecast 2025-2030

Chart on South America - Market size and forecast 2025-2030 ($ million)
Data Table on South America - Market size and forecast 2025-2030 ($ million)
Chart on South America - Year-over-year growth 2025-2030 (%)
Data Table on South America - Year-over-year growth 2025-2030 (%)
Chart on Regional Comparison - South America
Data Table on Regional Comparison - South America

12.6.1 Brazil - Market size and forecast 2025-2030

Chart on Brazil - Market size and forecast 2025-2030 ($ million)
Data Table on Brazil - Market size and forecast 2025-2030 ($ million)
Chart on Brazil - Year-over-year growth 2025-2030 (%)
Data Table on Brazil - Year-over-year growth 2025-2030 (%)

12.6.2 Argentina - Market size and forecast 2025-2030

Chart on Argentina - Market size and forecast 2025-2030 ($ million)
Data Table on Argentina - Market size and forecast 2025-2030 ($ million)
Chart on Argentina - Year-over-year growth 2025-2030 (%)
Data Table on Argentina - Year-over-year growth 2025-2030 (%)

12.6.3 Chile - Market size and forecast 2025-2030

Chart on Chile - Market size and forecast 2025-2030 ($ million)
Data Table on Chile - Market size and forecast 2025-2030 ($ million)
Chart on Chile - Year-over-year growth 2025-2030 (%)
Data Table on Chile - Year-over-year growth 2025-2030 (%)

12.7 Middle East and Africa - Market size and forecast 2025-2030

Chart on Middle East and Africa - Market size and forecast 2025-2030 ($ million)
Data Table on Middle East and Africa - Market size and forecast 2025-2030 ($ million)
Chart on Middle East and Africa - Year-over-year growth 2025-2030 (%)
Data Table on Middle East and Africa - Year-over-year growth 2025-2030 (%)
Chart on Regional Comparison - Middle East and Africa
Data Table on Regional Comparison - Middle East and Africa

12.7.1 South Africa - Market size and forecast 2025-2030

Chart on South Africa - Market size and forecast 2025-2030 ($ million)
Data Table on South Africa - Market size and forecast 2025-2030 ($ million)
Chart on South Africa - Year-over-year growth 2025-2030 (%)
Data Table on South Africa - Year-over-year growth 2025-2030 (%)

12.7.2 UAE - Market size and forecast 2025-2030

Chart on UAE - Market size and forecast 2025-2030 ($ million)
Data Table on UAE - Market size and forecast 2025-2030 ($ million)
Chart on UAE - Year-over-year growth 2025-2030 (%)
Data Table on UAE - Year-over-year growth 2025-2030 (%)

12.7.3 Kenya - Market size and forecast 2025-2030

Chart on Kenya - Market size and forecast 2025-2030 ($ million)
Data Table on Kenya - Market size and forecast 2025-2030 ($ million)
Chart on Kenya - Year-over-year growth 2025-2030 (%)
Data Table on Kenya - Year-over-year growth 2025-2030 (%)

12.7.4 Israel - Market size and forecast 2025-2030

Chart on Israel - Market size and forecast 2025-2030 ($ million)
Data Table on Israel - Market size and forecast 2025-2030 ($ million)
Chart on Israel - Year-over-year growth 2025-2030 (%)
Data Table on Israel - Year-over-year growth 2025-2030 (%)

12.7.5 Saudi Arabia - Market size and forecast 2025-2030

Chart on Saudi Arabia - Market size and forecast 2025-2030 ($ million)
Data Table on Saudi Arabia - Market size and forecast 2025-2030 ($ million)
Chart on Saudi Arabia - Year-over-year growth 2025-2030 (%)
Data Table on Saudi Arabia - Year-over-year growth 2025-2030 (%)

12.8 Market opportunity by geography

Market opportunity by geography ($ million)
Data Tables on Market opportunity by geography ($ million)

13. Drivers, Challenges, and Opportunity

13.1 Market drivers

Surge in eco-tourism and sustainable outdoor recreation opportunities
Expansion of specialized fishing kayaks and pedal systems
Material innovations and modular kayak design

13.2 Market challenges

Escalating costs of high performance advanced materials
Supply chain disruptions impacting essential petrochemicals
Pronounced demand seasonality and complex inventory management

13.3 Impact of drivers and challenges

Impact of drivers and challenges in 2025 and 2030

13.4 Market opportunities

Advancements in lightweight and portable equipment
Integration of eco-friendly and sustainable manufacturing practices
Strategic acquisitions and consolidation to expand product portfolios

14. Competitive Landscape

14.1 Overview

14.2

Overview on criticality of inputs and factors of differentiation

14.3 Landscape disruption

Overview on factors of disruption

14.4 Industry risks

Impact of key risks on business

15. Competitive Analysis

15.1 Companies profiled

Companies covered

15.2 Company ranking index

15.3 Market positioning of companies

Matrix on companies position and classification

15.4 AIRE Inc.

AIRE Inc. - Overview
AIRE Inc. - Product / Service
AIRE Inc. - Key offerings
SWOT

15.5 Bending Branches

Bending Branches - Overview
Bending Branches - Product / Service
Bending Branches - Key offerings
SWOT

15.6 Confluence Outdoor

Confluence Outdoor - Overview
Confluence Outdoor - Product / Service
Confluence Outdoor - Key offerings
SWOT

15.7 Delta Kayaks

Delta Kayaks - Overview
Delta Kayaks - Product / Service
Delta Kayaks - Key offerings
SWOT

15.8 Eddyline Kayaks Inc.

Eddyline Kayaks Inc. - Overview
Eddyline Kayaks Inc. - Product / Service
Eddyline Kayaks Inc. - Key offerings
SWOT

15.9 Hobie Cat Co. II LLC

Hobie Cat Co. II LLC - Overview
Hobie Cat Co. II LLC - Product / Service
Hobie Cat Co. II LLC - Key offerings
SWOT

15.10 Jackson Kayak Inc.

Jackson Kayak Inc. - Overview
Jackson Kayak Inc. - Product / Service
Jackson Kayak Inc. - Key offerings
SWOT

15.11 Johnson Outdoors Inc.

Johnson Outdoors Inc. - Overview
Johnson Outdoors Inc. - Business segments
Johnson Outdoors Inc. - Key offerings
Johnson Outdoors Inc. - Segment focus
SWOT

15.12 Lifetime Products Inc.

Lifetime Products Inc. - Overview
Lifetime Products Inc. - Product / Service
Lifetime Products Inc. - Key offerings
SWOT

15.13 Pelican International Inc.

Pelican International Inc. - Overview
Pelican International Inc. - Product / Service
Pelican International Inc. - Key offerings
SWOT

15.14 Prijon GmbH

Prijon GmbH - Overview
Prijon GmbH - Product / Service
Prijon GmbH - Key offerings
SWOT

15.15 RTM Kayaks

RTM Kayaks - Overview
RTM Kayaks - Product / Service
RTM Kayaks - Key offerings
SWOT

15.16 SeaBird Design AS

SeaBird Design AS - Overview
SeaBird Design AS - Product / Service
SeaBird Design AS - Key offerings
SWOT

15.17 Tahe Kayaks OU

Tahe Kayaks OU - Overview
Tahe Kayaks OU - Product / Service
Tahe Kayaks OU - Key offerings
SWOT

15.18 ZET Kayaks

ZET Kayaks - Overview
ZET Kayaks - Product / Service
ZET Kayaks - Key offerings
SWOT

16. Appendix

16.1 Scope of the report

Market definition
Objectives
Notes and caveats

16.2 Inclusions and exclusions checklist

Inclusions checklist
Exclusions checklist

16.3 Currency conversion rates for US$

16.4 Research methodology

16.5 Data procurement

Information sources

16.6 Data validation

16.7 Validation techniques employed for market sizing

16.8 Data synthesis

16.9 360 degree market analysis

16.10 List of abbreviations

Research Methodology

Technavio presents a detailed picture of the market by way of study, synthesis, and summation of data from multiple sources. The analysts have presented the various facets of the market with a particular focus on identifying the key industry influencers. The data thus presented is comprehensive, reliable, and the result of extensive research, both primary and secondary.

INFORMATION SOURCES

Primary sources

  • Manufacturers and suppliers
  • Channel partners
  • Industry experts
  • Strategic decision makers

Secondary sources

  • Industry journals and periodicals
  • Government data
  • Financial reports of key industry players
  • Historical data
  • Press releases

DATA ANALYSIS

Data Synthesis

  • Collation of data
  • Estimation of key figures
  • Analysis of derived insights

Data Validation

  • Triangulation with data models
  • Reference against proprietary databases
  • Corroboration with industry experts

REPORT WRITING

Qualitative

  • Market drivers
  • Market challenges
  • Market trends
  • Five forces analysis

Quantitative

  • Market size and forecast
  • Market segmentation
  • Geographical insights
  • Competitive landscape

Interested in this report?

Get your sample now to see our research methodology and insights!

Download Now

Frequently Asked Questions

Kayaking Equipment market growth will increase by USD 248.0 million during 2026-2030.

The Kayaking Equipment market is expected to grow at a CAGR of 4.5% during 2026-2030.

Kayaking Equipment market is segmented by Product type (Kayaks, Accessories) Distribution channel (Offline, Online) End-user (Recreational, Fishing, Tourism and adventure travel, Whitewater and sports)

AIRE Inc., Aqua Bound, Bending Branches, Confluence Outdoor, Delta Kayaks, Eddyline Kayaks Inc., Gumotex a.s., Hobie Cat Co. II LLC, Jackson Kayak Inc., Johnson Outdoors Inc., Lifetime Products Inc., Oru Kayak Inc., Pelican International Inc., Point 65 Sweden AB, Prijon GmbH, Pyranha Mouldings Ltd., RTM Kayaks, Sea Eagle Boats Inc., SeaBird Design AS, Stellar Kayaks, Tahe Kayaks OU, ZET Kayaks are a few of the key vendors in the Kayaking Equipment market.

North America will register the highest growth rate of 43.3% among the other regions. Therefore, the Kayaking Equipment market in North America is expected to garner significant business opportunities for the vendors during the forecast period.

US, Canada, Mexico, Germany, UK, France, Italy, Spain, The Netherlands, Australia, Japan, China, New Zealand, India, South Korea, Brazil, Argentina, Chile, South Africa, UAE, Kenya, Israel, Saudi Arabia

  • Surge in eco-tourism and sustainable outdoor recreation opportunities is the driving factor this market.

The Kayaking Equipment market vendors should focus on grabbing business opportunities from the Product type segment as it accounted for the largest market share in the base year.
RIA - Research AI Assistant
Ask RIA
