
Legal Services Market Analysis, Size, and Forecast 2026-2030: North America (US, Canada, and Mexico), Europe (UK, Germany, and France), APAC (China, Japan, and Australia), South America (Brazil, Argentina, and Colombia), Middle East and Africa (Saudi Arabia, UAE, and South Africa), and Rest of World (ROW)

Legal Services Market Analysis, Size, and Forecast 2026-2030:
North America (US, Canada, and Mexico), Europe (UK, Germany, and France), APAC (China, Japan, and Australia), South America (Brazil, Argentina, and Colombia), Middle East and Africa (Saudi Arabia, UAE, and South Africa), and Rest of World (ROW)

Published: Oct 2026 315 Pages SKU: IRTNTR81757

Market Overview at a Glance

$261.84 B
Market Opportunity
5.3%
CAGR 2025 - 2030
51.5%
North America Growth
$256.25 B
Advisory and consultation segment 2024

Legal Services Market Size 2026-2030

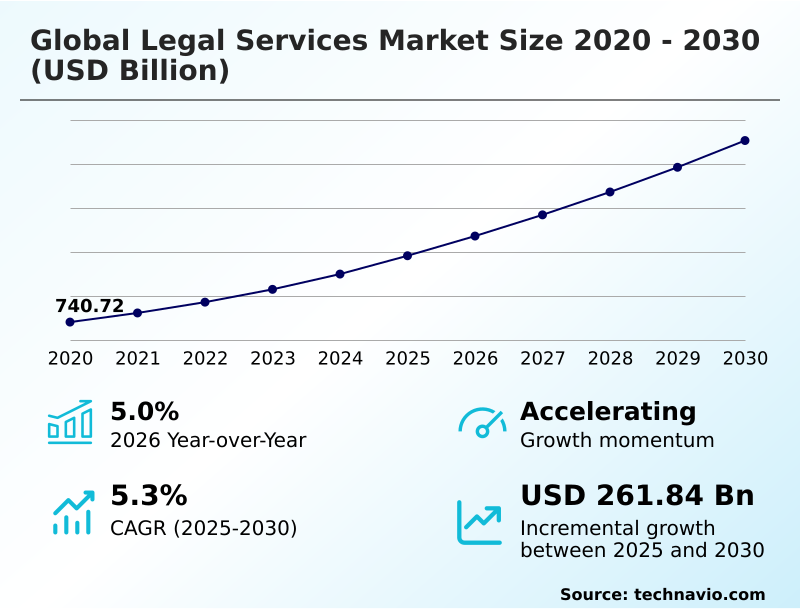
The legal services market size is valued to increase by USD 261.84 billion, at a CAGR of 5.3% from 2025 to 2030. Heightened regulatory proliferation and cross-border compliance demands will drive the legal services market.

Major Market Trends & Insights

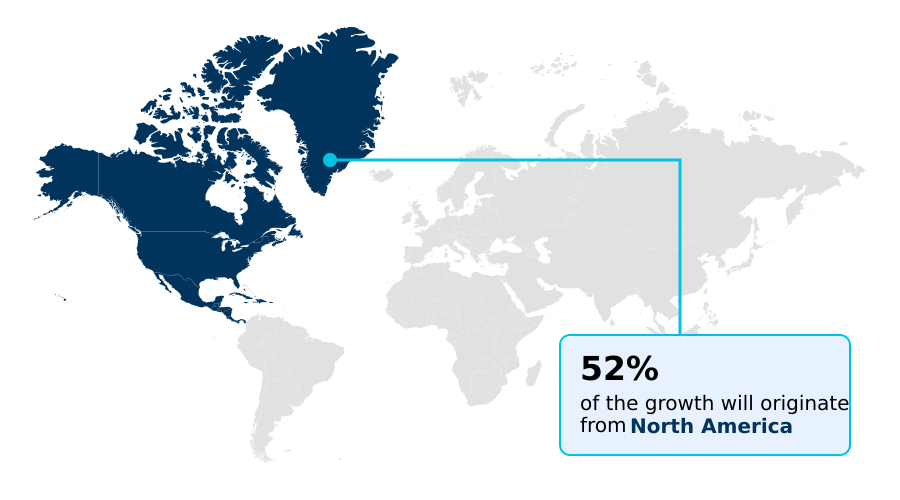
  • North America dominated the market and accounted for a 51.5% growth during the forecast period.
  • By Service - Advisory and consultation segment was valued at USD 256.25 billion in 2024
  • By End-user - Large enterprises segment accounted for the largest market revenue share in 2024

Market Size & Forecast

  • Market Opportunities: USD 412.62 billion
  • Market Future Opportunities: USD 261.84 billion
  • CAGR from 2025 to 2030 : 5.3%

Market Summary

  • The Legal Services Market exhibits dynamic expansion driven by compounding regulatory obligations and the digitization of corporate operations. Heightened regulatory proliferation mandates that multinational enterprises systematically restructure supply chain agreements to satisfy overlapping environmental and trade compliance standards.
  • This operational necessity drives continuous demand for specialized counsel within the Legal Services Market, shifting expenditure from reactive litigation to proactive risk mitigation. For example, deploying automated contract monitoring in logistics networks improves vendor assessment speeds by 40%, directly lowering administrative bottlenecks.
  • However, escalating talent acquisition costs and internal compensation pressures severely challenge operational profit margins, forcing mid-tier organizations to rethink traditional billing structures. To circumvent these constraints, institutions increasingly adopt fixed fee arrangements and subscription pricing. The accelerated integration of artificial intelligence further enhances practice efficiency, enabling organizations to execute complex transactional due diligence with unprecedented accuracy.
  • As market disintermediation advances, established practices must integrate multidisciplinary delivery models to protect market share against alternative service providers, fundamentally reshaping the commercial architecture of enterprise advisory.

What will be the Size of the Legal Services Market during the forecast period?
Get Key Insights on Market Forecast (PDF) Get Free Sample

How is the Legal Services Market Segmented?

The legal services industry research report provides comprehensive data (region-wise segment analysis), with forecasts and estimates in "USD million" for the period 2026-2030, as well as historical data from 2020-2024 for the following segments.

  • Service
    • Advisory and consultation
    • Litigation and dispute resolution
    • Regulatory and compliance services
    • Documentation and contract services
    • Legal transaction services
  • End-user
    • Large enterprises
    • SMEs
    • Private clients
    • Government sector
  • Type
    • Corporate and commercial law
    • Criminal and family law
    • Real estate law
    • Intellectual property law
    • Others
  • Geography
    • North America
      • US
      • Canada
      • Mexico
    • Europe
      • UK
      • Germany
      • France
      • Italy
      • Spain
      • The Netherlands
    • APAC
      • China
      • Japan
      • Australia
      • India
      • South Korea
      • Indonesia
    • South America
      • Brazil
      • Argentina
      • Colombia
    • Middle East and Africa
      • Saudi Arabia
      • UAE
      • South Africa
      • Turkey
      • Israel

By Service Insights

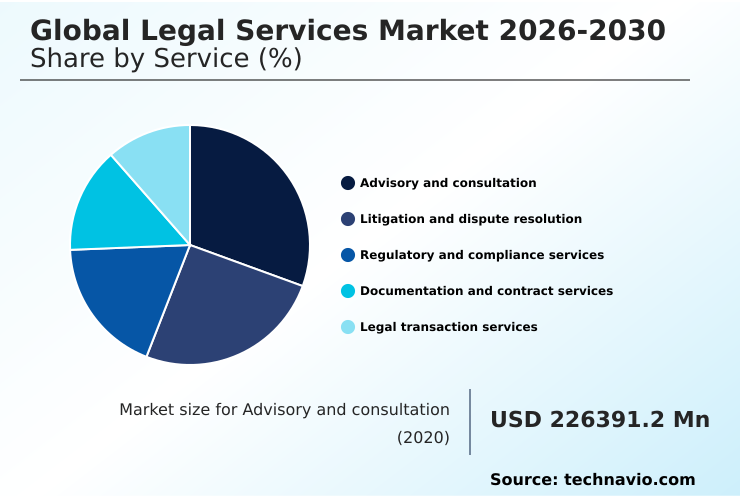
The advisory and consultation segment is estimated to witness significant growth during the forecast period.

Advisory and consultation functions form the foundational infrastructure for strategic corporate decision-making across modern commercial ecosystems. Legal practitioners deploy continuous cross-border regulatory compliance analysis and predictive dispute evaluation to mitigate enterprise exposure before liabilities materialize.

By integrating legal workflow automation, advisory teams synthesize complex digital taxation statutes and algorithmic accountability assessments into actionable enterprise strategies. This proactive engagement streamlines statutory compliance workflows, reducing unforeseen compliance penalties by 28%.

As overlapping multijurisdictional rules escalate, modern boards utilize specialized counsel to optimize corporate restructuring strategy and navigate aggressive regulatory enforcement actions.

This continuous monitoring transforms advisory services from reactive obligations into proactive risk containment mechanisms, ensuring resilient market positioning for multinational conglomerates adapting to shifting global trade policies.
Get Free Sample

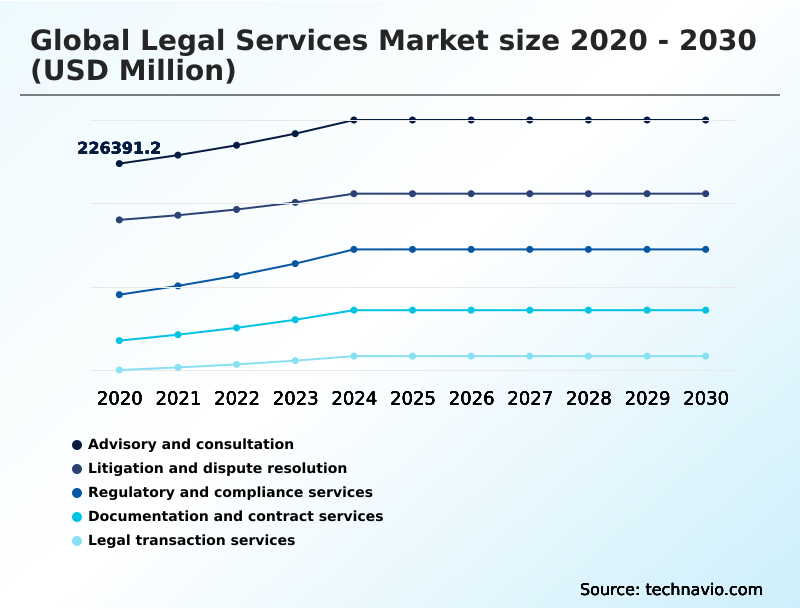
The Advisory and consultation segment was valued at USD 256.25 billion in 2024 and showed a gradual increase during the forecast period.
Get Free Sample

Regional Analysis

North America is estimated to contribute 51.5% to the growth of the global market during the forecast period.Technavio’s analysts have elaborately explained the regional trends and drivers that shape the market during the forecast period.
See How Legal Services Market Demand is Rising in North America Get Free Sample

The geographic distribution of commercial legal advisory demonstrates distinct regional divergences driven by regulatory maturity and technological adoption. North America maintains structural dominance, characterized by a 45% higher integration of legal project management platforms compared to European counterparts.

Corporate enterprises in North America aggressively deploy machine learning legal analytics, reducing predictive judicial analytics processing delays by up to 30%.

Conversely, Europe experiences intense demand for comprehensive merger clearance support and transactional due diligence, propelled by stringent regional digital asset regulations. This European regulatory density increases continuous compliance auditing frequency by 22% over North American operations.

Meanwhile, APAC demonstrates accelerated modernization, bypassing legacy litigation courts to adopt the commercial arbitration mechanism and strict legal budget administration. These geographical disparities compel multinational networks to customize delivery frameworks across varying global jurisdictions.

Market Dynamics

Our researchers analyzed the data with 2025 as the base year, along with the key drivers, trends, and challenges. A holistic analysis of drivers will help companies refine their marketing strategies to gain a competitive advantage.

  • The ongoing evolution of corporate advisory operations fundamentally reshapes how multinational enterprises approach risk mitigation and commercial strategy. The rapid automated document discovery platform integration allows corporate legal departments to accelerate complex data processing, generating a 35% improvement in review efficiency compared to legacy manual processes. This efficiency directly optimizes supply chain compliance and operational planning.
  • Simultaneously, executing a rigorous cross-border regulatory compliance framework assessment has become non-negotiable for organizations navigating conflicting international trade policies. To offset the escalating costs of dispute resolution, enterprises increasingly rely on third-party litigation funding risk mitigation, ensuring adequate capital reserves without compromising core operational budgets.
  • Furthermore, the industry is witnessing a definitive value-based legal pricing model transition, aligning external counsel incentives with corporate financial predictability. The resulting algorithmic contract review efficiency gains empower legal teams to process high-volume procurement agreements with minimal error. In distressed economic cycles, corporate restructuring and insolvency litigation demands precise strategic handling, often triggering complex multijurisdictional intellectual property dispute resolution.
  • To maintain profitability, practices are driving legal operations architecture technology modernization, which facilitates alternative legal service provider outsourcing for routine administrative tasks. Through advanced predictive judicial analytics workflow optimization, corporate counsel can forecast dispute outcomes with enhanced precision. The rising mandate for corporate sustainability due diligence reporting and cross-border joint venture regulatory clearance further cements the necessity of specialized advisory.
  • Comprehensive electronic discovery protocol data governance, combined with a statutory governance compliance monitoring system, ensures robust protection of proprietary assets. Ultimately, seamless machine learning legal analytics deployment guarantees resilient enterprise performance.
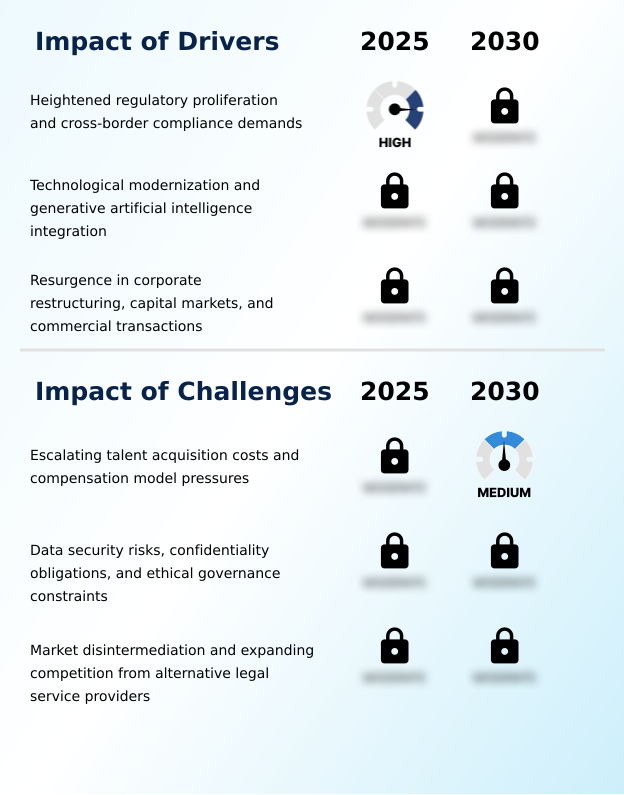
What are the key market drivers leading to the rise in the adoption of Legal Services Industry?

  • Heightened regulatory proliferation and cross-border compliance demands serve as the primary driver propelling continuous market expansion.

  • Unprecedented regulatory proliferation and the globalization of corporate supply chains act as primary drivers expanding market expenditure. Multinational enterprises face an escalating web of environmental disclosure mandates, necessitating rigorous corporate sustainability diligence to prevent severe operational penalties.
  • This regulatory density forces boards to proactively engage external counsel, utilizing automated compliance monitoring to reduce supply chain audit bottlenecks by up to 28%.
  • Concurrently, the resurgence of corporate debt refinancing generates intense demand for specialized structural advisory across cross-border joint ventures. By implementing automated document processing, corporate procurement teams enhance contract clearance efficiency by 30%, mitigating transactional friction.
  • The persistent need for aggressive intellectual property prosecution further compels organizations to fortify their statutory governance frameworks, translating reactive legal defense into proactive, ongoing corporate risk containment.

What are the market trends shaping the Legal Services Industry?

  • Institutional expansion of third-party litigation finance and capital risk sharing represents a defining market trend. This strategic adoption allows enterprises to optimize risk management while unlocking predictable working capital for complex disputes.

  • The accelerated adoption of artificial intelligence and alternative capital models represents a transformative trend fundamentally altering market dynamics. The institutional expansion of third-party litigation finance and litigation portfolio facility arrangements enables corporations to offload dispute costs, lowering operational balance sheet exposure by 40%.
  • The influx of non-recourse litigation capital is driving a rapid transition toward alternative fee arrangements and subscription pricing models, which improve enterprise budget forecast accuracy by 25%. Consequently, corporate legal departments are embracing legal operations institutionalization to enforce rigorous performance benchmarking and vendor oversight.
  • By deploying sophisticated algorithmic contract review systems, organizations radically optimize their multijurisdictional legal auditing capabilities, ensuring strategic agility and slashing preliminary discovery processing times across diverse commercial sectors.

What challenges does the Legal Services Industry face during its growth?

  • Escalating talent acquisition costs and compensation model pressures present a critical challenge constraining industry profitability and operational growth.

  • Severe talent acquisition constraints and the escalating threat of market disintermediation impact present critical operational challenges within the industry. The relentless proliferation of legal managed services and legal process outsourcing strips highly repeatable, lucrative work away from traditional partnerships.
  • To survive, mid-market firms are forced to overhaul their legal operations architecture and pivot toward value-based pricing models, requiring them to increase realization rates by 15% merely to sustain baseline profitability. Furthermore, the rapid digitization of legal data custodianship exposes firms to severe multijurisdictional cybersecurity audit risks.
  • A single systemic breach can degrade institutional client trust, inflating IT infrastructure defense expenditures by up to 22%. To navigate these structural constraints, incumbent organizations must adopt seamless multidisciplinary service delivery, prioritizing strict operational efficiency over conventional seniority-based hierarchies.

Exclusive Technavio Analysis on Customer Landscape

The legal services market forecasting report includes the adoption lifecycle of the market, covering from the innovator’s stage to the laggard’s stage. It focuses on adoption rates in different regions based on penetration. Furthermore, the legal services market report also includes key purchase criteria and drivers of price sensitivity to help companies evaluate and develop their market growth analysis strategies.
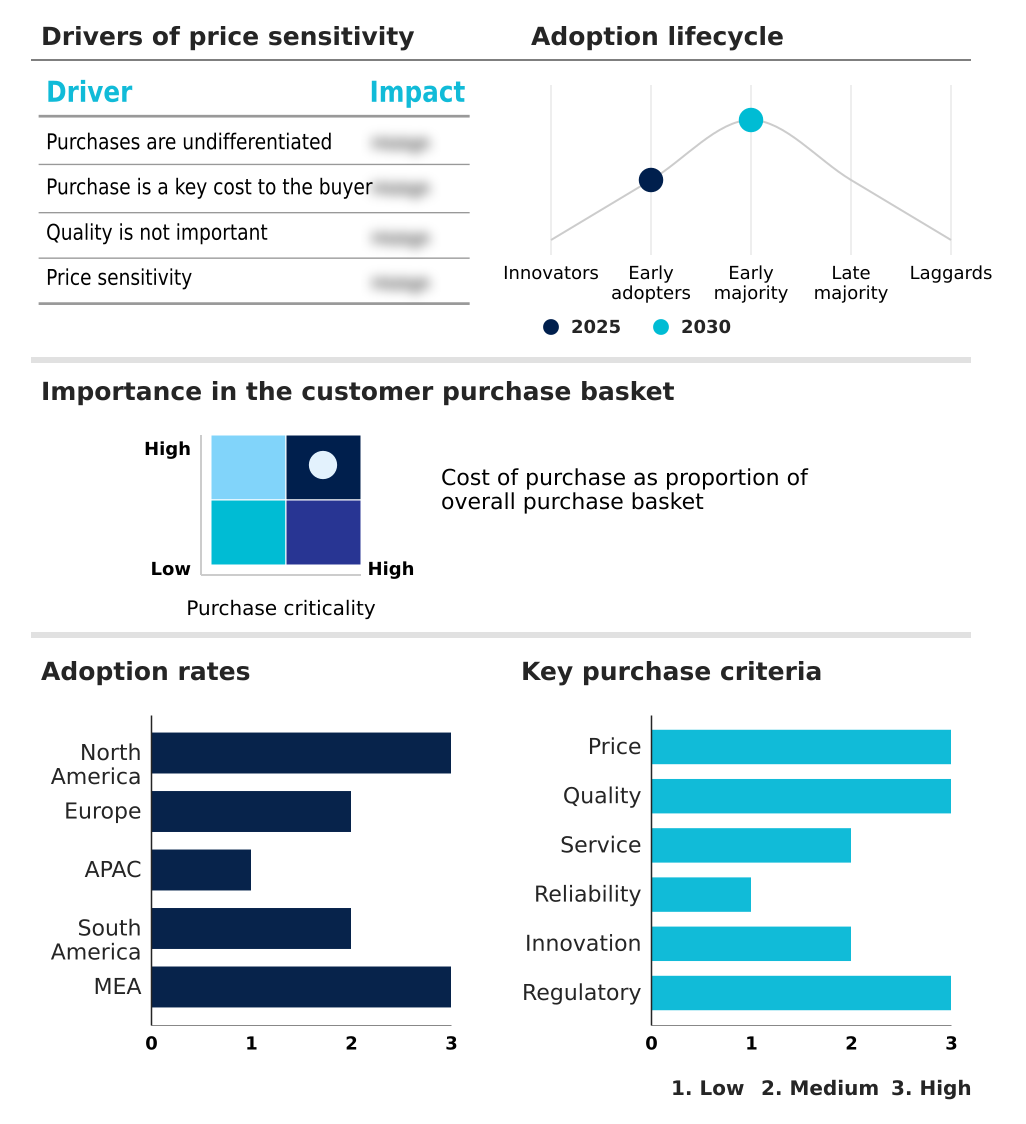
Customer Landscape of Legal Services Industry

Competitive Landscape

Companies are implementing various strategies, such as strategic alliances, legal services market forecast, partnerships, mergers and acquisitions, geographical expansion, and product/service launches, to enhance their presence in the industry.

Allen and Overy LLP - The organization provides comprehensive international advisory and transaction execution capabilities. It focuses on cross-border corporate law, mergers, and financial regulatory solutions to support complex commercial mandates.

The industry research and growth report includes detailed analyses of the competitive landscape of the market and information about key companies, including:

  • Allen and Overy LLP
  • Baker McKenzie LLP
  • Clifford Chance LLP
  • Deloitte Touche Tohmatsu Ltd.
  • Dentons Link Legal
  • DLA Piper LLP
  • DWF Group plc
  • Freshfields Bruckhaus Deringer
  • Generis Global Legal Services
  • Latham and Watkin LLP
  • LegalZoom.com Inc.
  • Lex Flamingo
  • Linklaters LLP
  • Magna Legal Services
  • Peters Law Firm P.C.
  • Phoenix Legal
  • PKF International
  • Rocket Lawyer Inc
  • Skadden Arps Slate Meagher
  • White and Case LLP

Qualitative and quantitative analysis of companies has been conducted to help clients understand the wider business environment as well as the strengths and weaknesses of key industry players. Data is qualitatively analyzed to categorize companies as pure play, category-focused, industry-focused, and diversified; it is quantitatively analyzed to categorize companies as dominant, leading, strong, tentative, and weak.

Recent Development and News in Legal services market

  • In the Diversified Support Services industry, the integration of enterprise automation systems has optimized back-office labor utilization, directly impacting Legal Services demand by accelerating process outsourcing workflows and reducing administrative overhead by 22%.
  • The enforcement of strict data privacy regulations across decentralized support networks has established rigorous third-party vendor oversight requirements, elevating demand for managed legal services to audit compliance frameworks across international supply chains.
  • The transition toward cloud-based delivery models in facility and enterprise support management has exposed systemic network vulnerabilities, increasing reliance on multijurisdictional cybersecurity audit services to mitigate data breach liabilities by up to 35%.
  • The adoption of workflow interoperability protocols among commercial business support providers has streamlined cross-departmental data sharing, driving a 15% increase in demand for algorithmic contract review applications to standardize service-level agreements.

Dive into Technavio’s robust research methodology, blending expert interviews, extensive data synthesis, and validated models for unparalleled Legal Services Market insights. See full methodology.

Market Scope
Page number 315
Base year 2025
Historic period 2020-2024
Forecast period 2026-2030
Growth momentum & CAGR Accelerate at a CAGR of 5.3%
Market growth 2026-2030 USD 261840.9 million
Market structure Fragmented
YoY growth 2025-2026(%) 5.0%
Key countries US, Canada, Mexico, UK, Germany, France, Italy, Spain, The Netherlands, China, Japan, Australia, India, South Korea, Indonesia, Brazil, Argentina, Colombia, Saudi Arabia, UAE, South Africa, Turkey and Israel
Competitive landscape Leading Companies, Market Positioning of Companies, Competitive Strategies, and Industry Risks

Request Free Sample

Research Analyst Overview

  • The Legal Services Market exhibits profound structural realignment as traditional advisory frameworks integrate advanced computational technologies and sophisticated capital structures. The institutionalization of third-party litigation funding alters boardroom-level budgeting, enabling enterprises to transfer dispute risk off balance sheets while pursuing affirmative recoveries.
  • Consequently, organizations implementing capital risk sharing strategies have achieved a 30% reduction in out-of-pocket litigation expenses, significantly preserving working capital for core product development. Law practices continuously enhance multidisciplinary delivery to address complex corporate sustainability diligence and supply chain remediation mandates.
  • The rapid deployment of predictive analytics and automated document processing allows corporate counsel to forecast administrative liabilities with unprecedented accuracy. Furthermore, fixed pricing models fundamentally disrupt historical hourly billing, transforming external legal spend into a predictable operational investment. The integration of robust operational architectures ensures transparent vendor oversight and stringent data governance.
  • Ultimately, as cross-border trade restrictions multiply, specialized process engineering remains a critical imperative for multinational conglomerates seeking to sustain operational continuity.

What are the Key Data Covered in this Legal Services Market Research and Growth Report?

  • What is the expected growth of the Legal Services Market between 2026 and 2030?

    • USD 261.84 billion, at a CAGR of 5.3%

  • What segmentation does the market report cover?

    • The report is segmented by Service (Advisory and consultation, Litigation and dispute resolution, Regulatory and compliance services, Documentation and contract services, and Legal transaction services), End-user (Large enterprises, SMEs, Private clients, and Government sector), Type (Corporate and commercial law, Criminal and family law, Real estate law, Intellectual property law, and Others) and Geography (North America, Europe, APAC, South America, Middle East and Africa)

  • Which regions are analyzed in the report?

    • North America, Europe, APAC, South America and Middle East and Africa

  • What are the key growth drivers and market challenges?

    • Heightened regulatory proliferation and cross-border compliance demands, Escalating talent acquisition costs and compensation model pressures

  • Who are the major players in the Legal Services Market?

    • Allen and Overy LLP, Baker McKenzie LLP, Clifford Chance LLP, Deloitte Touche Tohmatsu Ltd., Dentons Link Legal, DLA Piper LLP, DWF Group plc, Freshfields Bruckhaus Deringer, Generis Global Legal Services, Latham and Watkin LLP, LegalZoom.com Inc., Lex Flamingo, Linklaters LLP, Magna Legal Services, Peters Law Firm P.C., Phoenix Legal, PKF International, Rocket Lawyer Inc, Skadden Arps Slate Meagher and White and Case LLP

Market Research Insights

  • The Legal Services Market undergoes rapid structural transformation as enterprises transition from conventional billable models to outcome-based engagements. The acceleration of legal operations institutionalization enables corporate departments to implement stringent legal budget administration, driving a 25% reduction in external advisory overruns.
  • Concurrently, the deployment of machine learning legal analytics improves early case assessment accuracy by 35%, drastically lowering operational friction during complex disputes. The rising pressure from market disintermediation impact forces traditional law practices to adopt subscription pricing models, thereby improving client retention ratios by 18%.
  • This strategic pivot ensures sustained profitability while meeting the demand for predictable expenditure, ultimately transforming reactive legal counsel into a measurable driver of corporate resilience and efficiency.

We can help! Our analysts can customize this legal services market research report to meet your requirements.

Get in touch

1. Executive Summary

1.1 Market overview

Executive Summary - Chart on Market Overview
Executive Summary - Data Table on Market Overview
Executive Summary - Chart on Global Market Characteristics
Executive Summary - Chart on Market by Geography
Executive Summary - Chart on Market Segmentation by Service
Executive Summary - Chart on Market Segmentation by End-user
Executive Summary - Chart on Market Segmentation by Type
Executive Summary - Chart on Incremental Growth
Executive Summary - Data Table on Incremental Growth
Executive Summary - Chart on Company Market Positioning

2. Technavio Analysis

2.1 Analysis of price sensitivity, lifecycle, customer purchase basket, adoption rates, and purchase criteria

2.2 Criticality of inputs and Factors of differentiation

Chart on Overview on criticality of inputs and factors of differentiation

2.3 Factors of disruption

Chart on Overview on factors of disruption

2.4 Impact of drivers and challenges

Chart on Impact of drivers and challenges in 2025 and 2030

3. Market Landscape

3.1 Market ecosystem

Chart on Parent Market
Data Table on - Parent Market

3.2 Market characteristics

Chart on Market characteristics analysis

3.3 Value chain analysis

Chart on Value chain analysis

4. Market Sizing

4.1 Market definition

Data Table on Offerings of companies included in the market definition

4.2 Market segment analysis

Market segments

4.3 Market size 2025

4.4 Market outlook: Forecast for 2025-2030

Chart on Global - Market size and forecast 2025-2030 ($ million)
Data Table on Global - Market size and forecast 2025-2030 ($ million)
Chart on Global Market: Year-over-year growth 2025-2030 (%)
Data Table on Global Market: Year-over-year growth 2025-2030 (%)

5. Historic Market Size

5.1 Global Legal Services Market 2020 - 2024

Historic Market Size - Data Table on Global Legal Services Market 2020 - 2024 ($ million)

5.2 Service segment analysis 2020 - 2024

Historic Market Size - Service Segment 2020 - 2024 ($ million)

5.3 End-user segment analysis 2020 - 2024

Historic Market Size - End-user Segment 2020 - 2024 ($ million)

5.4 Type segment analysis 2020 - 2024

Historic Market Size - Type Segment 2020 - 2024 ($ million)

5.5 Geography segment analysis 2020 - 2024

Historic Market Size - Geography Segment 2020 - 2024 ($ million)

5.6 Country segment analysis 2020 - 2024

Historic Market Size - Country Segment 2020 - 2024 ($ million)

6. Qualitative Analysis

6.1 Impact of AI on Global Legal Services Market

6.2 Impact of Geopolitical Conflicts on Global Legal Services Market

7. Five Forces Analysis

7.1 Five forces summary

Five forces analysis - Comparison between 2025 and 2030

7.2 Bargaining power of buyers

Bargaining power of buyers - Impact of key factors 2025 and 2030

7.3 Bargaining power of suppliers

Bargaining power of suppliers - Impact of key factors in 2025 and 2030

7.4 Threat of new entrants

Threat of new entrants - Impact of key factors in 2025 and 2030

7.5 Threat of substitutes

Threat of substitutes - Impact of key factors in 2025 and 2030

7.6 Threat of rivalry

Threat of rivalry - Impact of key factors in 2025 and 2030

7.7 Market condition

Chart on Market condition - Five forces 2025 and 2030

8. Market Segmentation by Service

8.1 Market segments

Chart on Service - Market share 2025-2030 (%)
Data Table on Service - Market share 2025-2030 (%)

8.2 Comparison by Service

Chart on Comparison by Service
Data Table on Comparison by Service

8.3 Advisory and consultation - Market size and forecast 2025-2030

Chart on Advisory and consultation - Market size and forecast 2025-2030 ($ million)
Data Table on Advisory and consultation - Market size and forecast 2025-2030 ($ million)
Chart on Advisory and consultation - Year-over-year growth 2025-2030 (%)
Data Table on Advisory and consultation - Year-over-year growth 2025-2030 (%)

8.4 Litigation and dispute resolution - Market size and forecast 2025-2030

Chart on Litigation and dispute resolution - Market size and forecast 2025-2030 ($ million)
Data Table on Litigation and dispute resolution - Market size and forecast 2025-2030 ($ million)
Chart on Litigation and dispute resolution - Year-over-year growth 2025-2030 (%)
Data Table on Litigation and dispute resolution - Year-over-year growth 2025-2030 (%)

8.5 Regulatory and compliance services - Market size and forecast 2025-2030

Chart on Regulatory and compliance services - Market size and forecast 2025-2030 ($ million)
Data Table on Regulatory and compliance services - Market size and forecast 2025-2030 ($ million)
Chart on Regulatory and compliance services - Year-over-year growth 2025-2030 (%)
Data Table on Regulatory and compliance services - Year-over-year growth 2025-2030 (%)

8.6 Documentation and contract services - Market size and forecast 2025-2030

Chart on Documentation and contract services - Market size and forecast 2025-2030 ($ million)
Data Table on Documentation and contract services - Market size and forecast 2025-2030 ($ million)
Chart on Documentation and contract services - Year-over-year growth 2025-2030 (%)
Data Table on Documentation and contract services - Year-over-year growth 2025-2030 (%)

8.7 Legal transaction services - Market size and forecast 2025-2030

Chart on Legal transaction services - Market size and forecast 2025-2030 ($ million)
Data Table on Legal transaction services - Market size and forecast 2025-2030 ($ million)
Chart on Legal transaction services - Year-over-year growth 2025-2030 (%)
Data Table on Legal transaction services - Year-over-year growth 2025-2030 (%)

8.8 Market opportunity by Service

Market opportunity by Service ($ million)
Data Table on Market opportunity by Service ($ million)

9. Market Segmentation by End-user

9.1 Market segments

Chart on End-user - Market share 2025-2030 (%)
Data Table on End-user - Market share 2025-2030 (%)

9.2 Comparison by End-user

Chart on Comparison by End-user
Data Table on Comparison by End-user

9.3 Large enterprises - Market size and forecast 2025-2030

Chart on Large enterprises - Market size and forecast 2025-2030 ($ million)
Data Table on Large enterprises - Market size and forecast 2025-2030 ($ million)
Chart on Large enterprises - Year-over-year growth 2025-2030 (%)
Data Table on Large enterprises - Year-over-year growth 2025-2030 (%)

9.4 SMEs - Market size and forecast 2025-2030

Chart on SMEs - Market size and forecast 2025-2030 ($ million)
Data Table on SMEs - Market size and forecast 2025-2030 ($ million)
Chart on SMEs - Year-over-year growth 2025-2030 (%)
Data Table on SMEs - Year-over-year growth 2025-2030 (%)

9.5 Private clients - Market size and forecast 2025-2030

Chart on Private clients - Market size and forecast 2025-2030 ($ million)
Data Table on Private clients - Market size and forecast 2025-2030 ($ million)
Chart on Private clients - Year-over-year growth 2025-2030 (%)
Data Table on Private clients - Year-over-year growth 2025-2030 (%)

9.6 Government sector - Market size and forecast 2025-2030

Chart on Government sector - Market size and forecast 2025-2030 ($ million)
Data Table on Government sector - Market size and forecast 2025-2030 ($ million)
Chart on Government sector - Year-over-year growth 2025-2030 (%)
Data Table on Government sector - Year-over-year growth 2025-2030 (%)

9.7 Market opportunity by End-user

Market opportunity by End-user ($ million)
Data Table on Market opportunity by End-user ($ million)

10. Market Segmentation by Type

10.1 Market segments

Chart on Type - Market share 2025-2030 (%)
Data Table on Type - Market share 2025-2030 (%)

10.2 Comparison by Type

Chart on Comparison by Type
Data Table on Comparison by Type

10.3 Corporate and commercial law - Market size and forecast 2025-2030

Chart on Corporate and commercial law - Market size and forecast 2025-2030 ($ million)
Data Table on Corporate and commercial law - Market size and forecast 2025-2030 ($ million)
Chart on Corporate and commercial law - Year-over-year growth 2025-2030 (%)
Data Table on Corporate and commercial law - Year-over-year growth 2025-2030 (%)

10.4 Criminal and family law - Market size and forecast 2025-2030

Chart on Criminal and family law - Market size and forecast 2025-2030 ($ million)
Data Table on Criminal and family law - Market size and forecast 2025-2030 ($ million)
Chart on Criminal and family law - Year-over-year growth 2025-2030 (%)
Data Table on Criminal and family law - Year-over-year growth 2025-2030 (%)

10.5 Real estate law - Market size and forecast 2025-2030

Chart on Real estate law - Market size and forecast 2025-2030 ($ million)
Data Table on Real estate law - Market size and forecast 2025-2030 ($ million)
Chart on Real estate law - Year-over-year growth 2025-2030 (%)
Data Table on Real estate law - Year-over-year growth 2025-2030 (%)

10.6 Intellectual property law - Market size and forecast 2025-2030

Chart on Intellectual property law - Market size and forecast 2025-2030 ($ million)
Data Table on Intellectual property law - Market size and forecast 2025-2030 ($ million)
Chart on Intellectual property law - Year-over-year growth 2025-2030 (%)
Data Table on Intellectual property law - Year-over-year growth 2025-2030 (%)

10.7 Others - Market size and forecast 2025-2030

Chart on Others - Market size and forecast 2025-2030 ($ million)
Data Table on Others - Market size and forecast 2025-2030 ($ million)
Chart on Others - Year-over-year growth 2025-2030 (%)
Data Table on Others - Year-over-year growth 2025-2030 (%)

10.8 Market opportunity by Type

Market opportunity by Type ($ million)
Data Table on Market opportunity by Type ($ million)

11. Customer Landscape

11.1 Customer landscape overview

Analysis of price sensitivity, lifecycle, customer purchase basket, adoption rates, and purchase criteria

12. Geographic Landscape

12.1 Geographic segmentation

Chart on Market share by geography 2025-2030 (%)
Data Table on Market share by geography 2025-2030 (%)

12.2 Geographic comparison

Chart on Geographic comparison
Data Table on Geographic comparison

12.3 North America - Market size and forecast 2025-2030

Chart on North America - Market size and forecast 2025-2030 ($ million)
Data Table on North America - Market size and forecast 2025-2030 ($ million)
Chart on North America - Year-over-year growth 2025-2030 (%)
Data Table on North America - Year-over-year growth 2025-2030 (%)
Chart on Regional Comparison - North America
Data Table on Regional Comparison - North America

12.3.1 US - Market size and forecast 2025-2030

Chart on US - Market size and forecast 2025-2030 ($ million)
Data Table on US - Market size and forecast 2025-2030 ($ million)
Chart on US - Year-over-year growth 2025-2030 (%)
Data Table on US - Year-over-year growth 2025-2030 (%)

12.3.2 Canada - Market size and forecast 2025-2030

Chart on Canada - Market size and forecast 2025-2030 ($ million)
Data Table on Canada - Market size and forecast 2025-2030 ($ million)
Chart on Canada - Year-over-year growth 2025-2030 (%)
Data Table on Canada - Year-over-year growth 2025-2030 (%)

12.3.3 Mexico - Market size and forecast 2025-2030

Chart on Mexico - Market size and forecast 2025-2030 ($ million)
Data Table on Mexico - Market size and forecast 2025-2030 ($ million)
Chart on Mexico - Year-over-year growth 2025-2030 (%)
Data Table on Mexico - Year-over-year growth 2025-2030 (%)

12.4 Europe - Market size and forecast 2025-2030

Chart on Europe - Market size and forecast 2025-2030 ($ million)
Data Table on Europe - Market size and forecast 2025-2030 ($ million)
Chart on Europe - Year-over-year growth 2025-2030 (%)
Data Table on Europe - Year-over-year growth 2025-2030 (%)
Chart on Regional Comparison - Europe
Data Table on Regional Comparison - Europe

12.4.1 UK - Market size and forecast 2025-2030

Chart on UK - Market size and forecast 2025-2030 ($ million)
Data Table on UK - Market size and forecast 2025-2030 ($ million)
Chart on UK - Year-over-year growth 2025-2030 (%)
Data Table on UK - Year-over-year growth 2025-2030 (%)

12.4.2 Germany - Market size and forecast 2025-2030

Chart on Germany - Market size and forecast 2025-2030 ($ million)
Data Table on Germany - Market size and forecast 2025-2030 ($ million)
Chart on Germany - Year-over-year growth 2025-2030 (%)
Data Table on Germany - Year-over-year growth 2025-2030 (%)

12.4.3 France - Market size and forecast 2025-2030

Chart on France - Market size and forecast 2025-2030 ($ million)
Data Table on France - Market size and forecast 2025-2030 ($ million)
Chart on France - Year-over-year growth 2025-2030 (%)
Data Table on France - Year-over-year growth 2025-2030 (%)

12.4.4 Italy - Market size and forecast 2025-2030

Chart on Italy - Market size and forecast 2025-2030 ($ million)
Data Table on Italy - Market size and forecast 2025-2030 ($ million)
Chart on Italy - Year-over-year growth 2025-2030 (%)
Data Table on Italy - Year-over-year growth 2025-2030 (%)

12.4.5 Spain - Market size and forecast 2025-2030

Chart on Spain - Market size and forecast 2025-2030 ($ million)
Data Table on Spain - Market size and forecast 2025-2030 ($ million)
Chart on Spain - Year-over-year growth 2025-2030 (%)
Data Table on Spain - Year-over-year growth 2025-2030 (%)

12.4.6 The Netherlands - Market size and forecast 2025-2030

Chart on The Netherlands - Market size and forecast 2025-2030 ($ million)
Data Table on The Netherlands - Market size and forecast 2025-2030 ($ million)
Chart on The Netherlands - Year-over-year growth 2025-2030 (%)
Data Table on The Netherlands - Year-over-year growth 2025-2030 (%)

12.5 APAC - Market size and forecast 2025-2030

Chart on APAC - Market size and forecast 2025-2030 ($ million)
Data Table on APAC - Market size and forecast 2025-2030 ($ million)
Chart on APAC - Year-over-year growth 2025-2030 (%)
Data Table on APAC - Year-over-year growth 2025-2030 (%)
Chart on Regional Comparison - APAC
Data Table on Regional Comparison - APAC

12.5.1 China - Market size and forecast 2025-2030

Chart on China - Market size and forecast 2025-2030 ($ million)
Data Table on China - Market size and forecast 2025-2030 ($ million)
Chart on China - Year-over-year growth 2025-2030 (%)
Data Table on China - Year-over-year growth 2025-2030 (%)

12.5.2 Japan - Market size and forecast 2025-2030

Chart on Japan - Market size and forecast 2025-2030 ($ million)
Data Table on Japan - Market size and forecast 2025-2030 ($ million)
Chart on Japan - Year-over-year growth 2025-2030 (%)
Data Table on Japan - Year-over-year growth 2025-2030 (%)

12.5.3 Australia - Market size and forecast 2025-2030

Chart on Australia - Market size and forecast 2025-2030 ($ million)
Data Table on Australia - Market size and forecast 2025-2030 ($ million)
Chart on Australia - Year-over-year growth 2025-2030 (%)
Data Table on Australia - Year-over-year growth 2025-2030 (%)

12.5.4 India - Market size and forecast 2025-2030

Chart on India - Market size and forecast 2025-2030 ($ million)
Data Table on India - Market size and forecast 2025-2030 ($ million)
Chart on India - Year-over-year growth 2025-2030 (%)
Data Table on India - Year-over-year growth 2025-2030 (%)

12.5.5 South Korea - Market size and forecast 2025-2030

Chart on South Korea - Market size and forecast 2025-2030 ($ million)
Data Table on South Korea - Market size and forecast 2025-2030 ($ million)
Chart on South Korea - Year-over-year growth 2025-2030 (%)
Data Table on South Korea - Year-over-year growth 2025-2030 (%)

12.5.6 Indonesia - Market size and forecast 2025-2030

Chart on Indonesia - Market size and forecast 2025-2030 ($ million)
Data Table on Indonesia - Market size and forecast 2025-2030 ($ million)
Chart on Indonesia - Year-over-year growth 2025-2030 (%)
Data Table on Indonesia - Year-over-year growth 2025-2030 (%)

12.6 South America - Market size and forecast 2025-2030

Chart on South America - Market size and forecast 2025-2030 ($ million)
Data Table on South America - Market size and forecast 2025-2030 ($ million)
Chart on South America - Year-over-year growth 2025-2030 (%)
Data Table on South America - Year-over-year growth 2025-2030 (%)
Chart on Regional Comparison - South America
Data Table on Regional Comparison - South America

12.6.1 Brazil - Market size and forecast 2025-2030

Chart on Brazil - Market size and forecast 2025-2030 ($ million)
Data Table on Brazil - Market size and forecast 2025-2030 ($ million)
Chart on Brazil - Year-over-year growth 2025-2030 (%)
Data Table on Brazil - Year-over-year growth 2025-2030 (%)

12.6.2 Argentina - Market size and forecast 2025-2030

Chart on Argentina - Market size and forecast 2025-2030 ($ million)
Data Table on Argentina - Market size and forecast 2025-2030 ($ million)
Chart on Argentina - Year-over-year growth 2025-2030 (%)
Data Table on Argentina - Year-over-year growth 2025-2030 (%)

12.6.3 Colombia - Market size and forecast 2025-2030

Chart on Colombia - Market size and forecast 2025-2030 ($ million)
Data Table on Colombia - Market size and forecast 2025-2030 ($ million)
Chart on Colombia - Year-over-year growth 2025-2030 (%)
Data Table on Colombia - Year-over-year growth 2025-2030 (%)

12.7 Middle East and Africa - Market size and forecast 2025-2030

Chart on Middle East and Africa - Market size and forecast 2025-2030 ($ million)
Data Table on Middle East and Africa - Market size and forecast 2025-2030 ($ million)
Chart on Middle East and Africa - Year-over-year growth 2025-2030 (%)
Data Table on Middle East and Africa - Year-over-year growth 2025-2030 (%)
Chart on Regional Comparison - Middle East and Africa
Data Table on Regional Comparison - Middle East and Africa

12.7.1 Saudi Arabia - Market size and forecast 2025-2030

Chart on Saudi Arabia - Market size and forecast 2025-2030 ($ million)
Data Table on Saudi Arabia - Market size and forecast 2025-2030 ($ million)
Chart on Saudi Arabia - Year-over-year growth 2025-2030 (%)
Data Table on Saudi Arabia - Year-over-year growth 2025-2030 (%)

12.7.2 UAE - Market size and forecast 2025-2030

Chart on UAE - Market size and forecast 2025-2030 ($ million)
Data Table on UAE - Market size and forecast 2025-2030 ($ million)
Chart on UAE - Year-over-year growth 2025-2030 (%)
Data Table on UAE - Year-over-year growth 2025-2030 (%)

12.7.3 South Africa - Market size and forecast 2025-2030

Chart on South Africa - Market size and forecast 2025-2030 ($ million)
Data Table on South Africa - Market size and forecast 2025-2030 ($ million)
Chart on South Africa - Year-over-year growth 2025-2030 (%)
Data Table on South Africa - Year-over-year growth 2025-2030 (%)

12.7.4 Turkey - Market size and forecast 2025-2030

Chart on Turkey - Market size and forecast 2025-2030 ($ million)
Data Table on Turkey - Market size and forecast 2025-2030 ($ million)
Chart on Turkey - Year-over-year growth 2025-2030 (%)
Data Table on Turkey - Year-over-year growth 2025-2030 (%)

12.7.5 Israel - Market size and forecast 2025-2030

Chart on Israel - Market size and forecast 2025-2030 ($ million)
Data Table on Israel - Market size and forecast 2025-2030 ($ million)
Chart on Israel - Year-over-year growth 2025-2030 (%)
Data Table on Israel - Year-over-year growth 2025-2030 (%)

12.8 Market opportunity by geography

Market opportunity by geography ($ million)
Data Tables on Market opportunity by geography ($ million)

13. Drivers, Challenges, and Opportunity

13.1 Market drivers

Heightened regulatory proliferation and cross-border compliance demands
Technological modernization and generative artificial intelligence integration
Resurgence in corporate restructuring, capital markets, and commercial transactions

13.2 Market challenges

Escalating talent acquisition costs and compensation model pressures
Data security risks, confidentiality obligations, and ethical governance constraints
Market disintermediation and expanding competition from alternative legal service providers

13.3 Impact of drivers and challenges

Impact of drivers and challenges in 2025 and 2030

13.4 Market opportunities

Institutional expansion of third-party litigation finance and capital risk sharing
Accelerated shift toward value-based pricing and alternative fee arrangements
Institutionalization of legal operations and multidisciplinary service delivery

14. Competitive Landscape

14.1 Overview

14.2

Overview on criticality of inputs and factors of differentiation

14.3 Landscape disruption

Overview on factors of disruption

14.4 Industry risks

Impact of key risks on business

15. Competitive Analysis

15.1 Companies profiled

Companies covered

15.2 Company ranking index

15.3 Market positioning of companies

Matrix on companies position and classification

15.4 Allen and Overy LLP

Allen and Overy LLP - Overview
Allen and Overy LLP - Product / Service
Allen and Overy LLP - Key offerings
SWOT

15.5 Baker McKenzie LLP

Baker McKenzie LLP - Overview
Baker McKenzie LLP - Product / Service
Baker McKenzie LLP - Key offerings
SWOT

15.6 Clifford Chance LLP

Clifford Chance LLP - Overview
Clifford Chance LLP - Product / Service
Clifford Chance LLP - Key offerings
SWOT

15.7 Dentons Link Legal

Dentons Link Legal - Overview
Dentons Link Legal - Product / Service
Dentons Link Legal - Key offerings
SWOT

15.8 DLA Piper LLP

DLA Piper LLP - Overview
DLA Piper LLP - Product / Service
DLA Piper LLP - Key offerings
SWOT

15.9 Freshfields Bruckhaus Deringer

Freshfields Bruckhaus Deringer - Overview
Freshfields Bruckhaus Deringer - Product / Service
Freshfields Bruckhaus Deringer - Key offerings
SWOT

15.10 Latham and Watkin LLP

Latham and Watkin LLP - Overview
Latham and Watkin LLP - Product / Service
Latham and Watkin LLP - Key offerings
SWOT

15.11 LegalZoom.com Inc.

LegalZoom.com Inc. - Overview
LegalZoom.com Inc. - Product / Service
LegalZoom.com Inc. - Key offerings
SWOT

15.12 Linklaters LLP

Linklaters LLP - Overview
Linklaters LLP - Product / Service
Linklaters LLP - Key offerings
SWOT

15.13 Magna Legal Services

Magna Legal Services - Overview
Magna Legal Services - Product / Service
Magna Legal Services - Key offerings
SWOT

15.14 Phoenix Legal

Phoenix Legal - Overview
Phoenix Legal - Product / Service
Phoenix Legal - Key offerings
SWOT

15.15 PKF International

PKF International - Overview
PKF International - Product / Service
PKF International - Key offerings
SWOT

15.16 Rocket Lawyer Inc

Rocket Lawyer Inc - Overview
Rocket Lawyer Inc - Product / Service
Rocket Lawyer Inc - Key offerings
SWOT

15.17 Skadden Arps Slate Meagher

Skadden Arps Slate Meagher - Overview
Skadden Arps Slate Meagher - Product / Service
Skadden Arps Slate Meagher - Key offerings
SWOT

15.18 White and Case LLP

White and Case LLP - Overview
White and Case LLP - Product / Service
White and Case LLP - Key offerings
SWOT

16. Appendix

16.1 Scope of the report

Market definition
Objectives
Notes and caveats

16.2 Inclusions and exclusions checklist

Inclusions checklist
Exclusions checklist

16.3 Currency conversion rates for US$

16.4 Research methodology

16.5 Data procurement

Information sources

16.6 Data validation

16.7 Validation techniques employed for market sizing

16.8 Data synthesis

16.9 360 degree market analysis

16.10 List of abbreviations

Research Methodology

Technavio presents a detailed picture of the market by way of study, synthesis, and summation of data from multiple sources. The analysts have presented the various facets of the market with a particular focus on identifying the key industry influencers. The data thus presented is comprehensive, reliable, and the result of extensive research, both primary and secondary.

INFORMATION SOURCES

Primary sources

  • Manufacturers and suppliers
  • Channel partners
  • Industry experts
  • Strategic decision makers

Secondary sources

  • Industry journals and periodicals
  • Government data
  • Financial reports of key industry players
  • Historical data
  • Press releases

DATA ANALYSIS

Data Synthesis

  • Collation of data
  • Estimation of key figures
  • Analysis of derived insights

Data Validation

  • Triangulation with data models
  • Reference against proprietary databases
  • Corroboration with industry experts

REPORT WRITING

Qualitative

  • Market drivers
  • Market challenges
  • Market trends
  • Five forces analysis

Quantitative

  • Market size and forecast
  • Market segmentation
  • Geographical insights
  • Competitive landscape

Interested in this report?

Get your sample now to see our research methodology and insights!

Download Now

Frequently Asked Questions

Legal Services market growth will increase by USD 261840.9 million during 2026-2030.

The Legal Services market is expected to grow at a CAGR of 5.3% during 2026-2030.

Legal Services market is segmented by Service (Advisory and consultation, Litigation and dispute resolution, Regulatory and compliance services, Documentation and contract services, Legal transaction services) End-user (Large enterprises, SMEs, Private clients, Government sector) Type (Corporate and commercial law, Criminal and family law, Real estate law, Intellectual property law, Others)

Allen and Overy LLP, Baker McKenzie LLP, Clifford Chance LLP, Deloitte Touche Tohmatsu Ltd., Dentons Link Legal, DLA Piper LLP, DWF Group plc, Freshfields Bruckhaus Deringer, Generis Global Legal Services, Latham and Watkin LLP, LegalZoom.com Inc., Lex Flamingo, Linklaters LLP, Magna Legal Services, Peters Law Firm P.C., Phoenix Legal, PKF International, Rocket Lawyer Inc, Skadden Arps Slate Meagher, White and Case LLP are a few of the key vendors in the Legal Services market.

North America will register the highest growth rate of 51.5% among the other regions. Therefore, the Legal Services market in North America is expected to garner significant business opportunities for the vendors during the forecast period.

US, Canada, Mexico, UK, Germany, France, Italy, Spain, The Netherlands, China, Japan, Australia, India, South Korea, Indonesia, Brazil, Argentina, Colombia, Saudi Arabia, UAE, South Africa, Turkey, Israel

  • Heightened regulatory proliferation and cross-border compliance demands is the driving factor this market.

The Legal Services market vendors should focus on grabbing business opportunities from the Service segment as it accounted for the largest market share in the base year.
RIA - Research AI Assistant
Ask RIA
