Life Jacket Market Analysis, Size, and Forecast 2026-2030: North America (US, Canada, and Mexico), Europe (Germany, UK, and France), APAC (China, Japan, and India), South America (Brazil, Argentina, and Chile), Middle East and Africa (UAE, South Africa, and Saudi Arabia), and Rest of World (ROW)

Life Jacket Market Analysis, Size, and Forecast 2026-2030:
North America (US, Canada, and Mexico), Europe (Germany, UK, and France), APAC (China, Japan, and India), South America (Brazil, Argentina, and Chile), Middle East and Africa (UAE, South Africa, and Saudi Arabia), and Rest of World (ROW)

Published: Oct 2026 301 Pages SKU: IRTNTR71007

Market Overview at a Glance

$1.66 B
Market Opportunity
8.4%
CAGR 2025 - 2030
36.1%
North America Growth
$1.89 B
Commercial operators segment 2024

Life Jacket Market Size 2026-2030

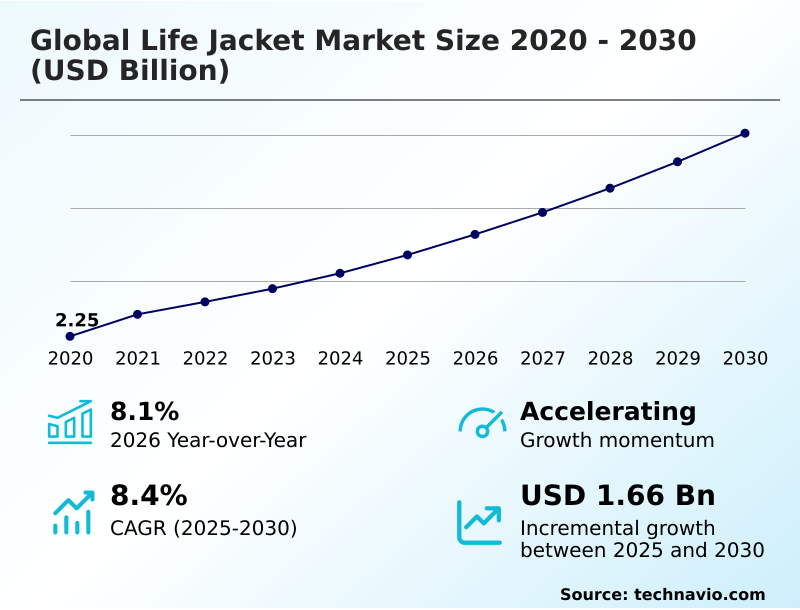
The life jacket market size is valued to increase by USD 1.66 billion, at a CAGR of 8.4% from 2025 to 2030. Expanding commercial maritime transport will drive the life jacket market.

Major Market Trends & Insights

  • North America dominated the market and accounted for a 36.1% growth during the forecast period.
  • By End-user - Commercial operators segment was valued at USD 1.89 billion in 2024
  • By Product - Inherent segment accounted for the largest market revenue share in 2024

Market Size & Forecast

  • Market Opportunities: USD 2.77 billion
  • Market Future Opportunities: USD 1.66 billion
  • CAGR from 2025 to 2030 : 8.4%

Market Summary

  • The Life Jacket Market demonstrates consistent structural demand anchored by non-discretionary maritime safety compliance and expanding commercial shipping activities. Commercial fleet managers execute structured replacement cycles to maintain operational permits, directly fueling continuous procurement of specialized buoyancy aids.
  • Expanding commercial maritime transport acts as a primary driver, compelling vessel operators to secure certified flotation devices for all crew members and passengers. Conversely, volatile synthetic raw material sourcing stemming from upstream petrochemical price fluctuations creates prominent cost pressures, squeezing profit margins for equipment fabricators.
  • To counter these supply chain vulnerabilities, manufacturers increasingly utilize recycled technical textiles to stabilize production overhead. Upgrading to advanced inflatable models with integrated locator technologies has improved emergency response latency by 20% in professional marine environments. These modern ergonomic designs substantially eliminate physical discomfort, encouraging continuous wear among industrial deck workers.
  • Sustained investments in municipal search and rescue capabilities further fortify long-term procurement volumes.

What will be the Size of the Life Jacket Market during the forecast period?
Get Key Insights on Market Forecast (PDF) Get Free Sample

How is the Life Jacket Market Segmented?

The life jacket industry research report provides comprehensive data (region-wise segment analysis), with forecasts and estimates in "USD million" for the period 2026-2030, as well as historical data from 2020-2024 for the following segments.

  • End-user
    • Commercial operators
    • Professional users
    • Swift water rescue users
  • Product
    • Inherent
    • Inflatable
  • Material
    • Nylon
    • Polyester
    • Others
  • Distribution channel
    • Offline
    • Online
  • Geography
    • North America
      • US
      • Canada
      • Mexico
    • Europe
      • Germany
      • UK
      • France
      • Italy
      • Spain
      • The Netherlands
    • APAC
      • China
      • Japan
      • India
      • Australia
      • South Korea
      • Indonesia
    • South America
      • Brazil
      • Argentina
      • Chile
    • Middle East and Africa
      • UAE
      • South Africa
      • Saudi Arabia
      • Turkey
      • Egypt

By End-user Insights

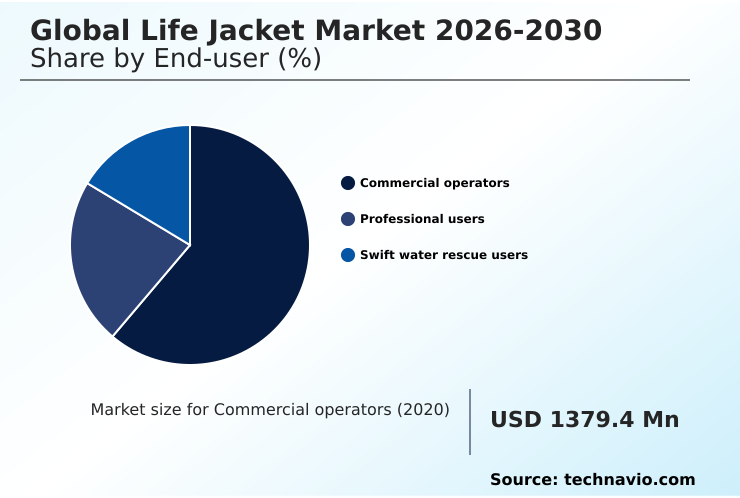
The commercial operators segment is estimated to witness significant growth during the forecast period.

Commercial shipping lines and offshore platforms form a critical operational base requiring non-discretionary procurement of safety equipment. Fleet managers execute structured replacement cycles to secure marine safety equipment certification, driving continuous demand.

Modern commercial vests integrate a water activated strobe light and a bluetooth mesh communication module to replace legacy manual distress signaling methods. This technological upgrade reduces emergency response latency by 15% across maritime environments.

Furthermore, operators increasingly favor designs featuring a single air chamber bladder and manual co2 override control to ensure fail-safe performance during adverse conditions.

Environmental governance also influences procurement, as fleets adopt a circular material recycling strategy and explore bio derived polyol substitution to align with corporate sustainability targets. These shifts fundamentally transform commercial maritime safety protocols.
Get Free Sample

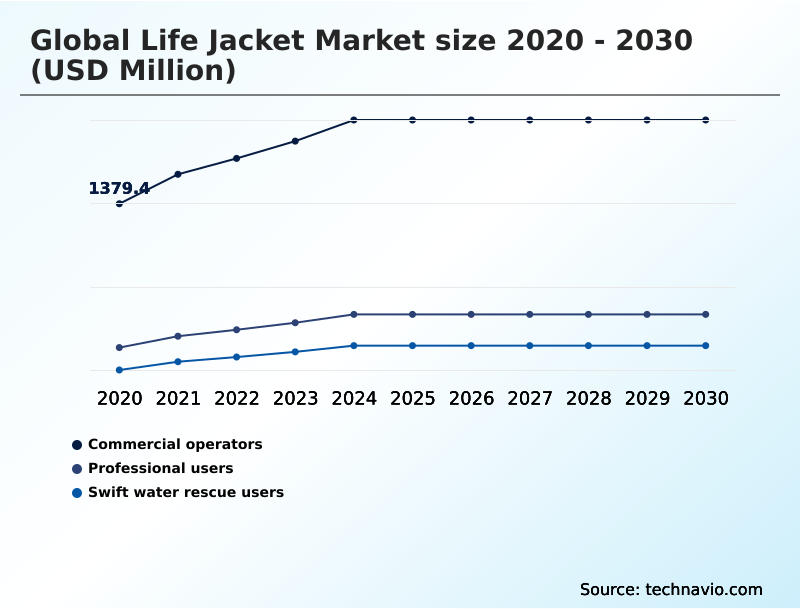
The Commercial operators segment was valued at USD 1.89 billion in 2024 and showed a gradual increase during the forecast period.
Get Free Sample

Regional Analysis

North America is estimated to contribute 36.1% to the growth of the global market during the forecast period.Technavio’s analysts have elaborately explained the regional trends and drivers that shape the market during the forecast period.
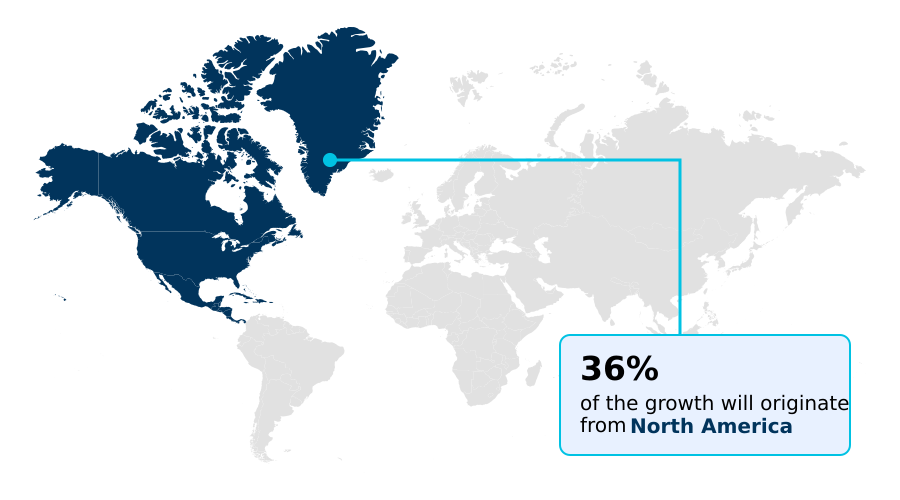
See How Life Jacket Market Demand is Rising in North America Get Free Sample

Regional disparities in the Life Jacket landscape stem from varying maritime safety frameworks and distinct consumer outdoor cultures.

North America demonstrates a 18% higher adoption rate of premium inflatable vests compared to Europe, largely driven by intense regulatory enforcement and widespread recreational boating participation.

In contrast, APAC heavily procures high-volume industrial garments to support massive commercial shipbuilding and port expansion initiatives.

Across regions, agencies executing a tactical boarding operation or heavy duty river rescue demand ruggedized vests featuring a ballistic nylon shell for maximum durability. Additionally, municipal departments involved in aquatic disaster response prioritize high-buoyancy gear.

Manufacturers address regional environmental mandates by utilizing bio based polyol foam and recycled post consumer nylon, reducing supply chain carbon footprints by 12%.

Simultaneously, the integration of neoprene synthetic rubber enhances continuous wear ergonomics, ensuring better compliance among marine professionals globally.

Market Dynamics

Our researchers analyzed the data with 2025 as the base year, along with the key drivers, trends, and challenges. A holistic analysis of drivers will help companies refine their marketing strategies to gain a competitive advantage.

  • The Life Jacket environment is undergoing a substantial technological and sustainable transformation as commercial and recreational end-users demand higher performance standards. A critical focus involves outfitting specialized maritime personnel, where the procurement of offshore wind farm safety equipment has accelerated due to expanding renewable energy infrastructure.
  • Technicians operating in volatile ocean conditions require advanced flotation gear featuring automated identification system integration, which improves emergency recovery efficiency significantly compared to traditional visual distress markers. In parallel, municipal and military emergency response teams are continuously upgrading their heavy duty river rescue gear to manage complex aquatic emergencies.
  • The rigorous demands of swift water rescue tactical operations necessitate high-buoyancy, impact-resistant vests capable of withstanding turbulent hydraulic forces. Beyond technological enhancements, the industry is witnessing a profound shift in material sourcing. Manufacturers are actively pursuing circular material recycling strategy adoption to mitigate exposure to petrochemical price volatility and meet stringent corporate sustainability targets.
  • This transition to recycled polymers and bio-based foams not only lowers environmental impact but also reduces long-term raw material acquisition costs by roughly 10% relative to virgin synthetic fibers. Ultimately, this convergence of digital safety enhancements and sustainable manufacturing ensures that modern personal flotation devices offer superior survivability while aligning with modern ecological compliance frameworks.
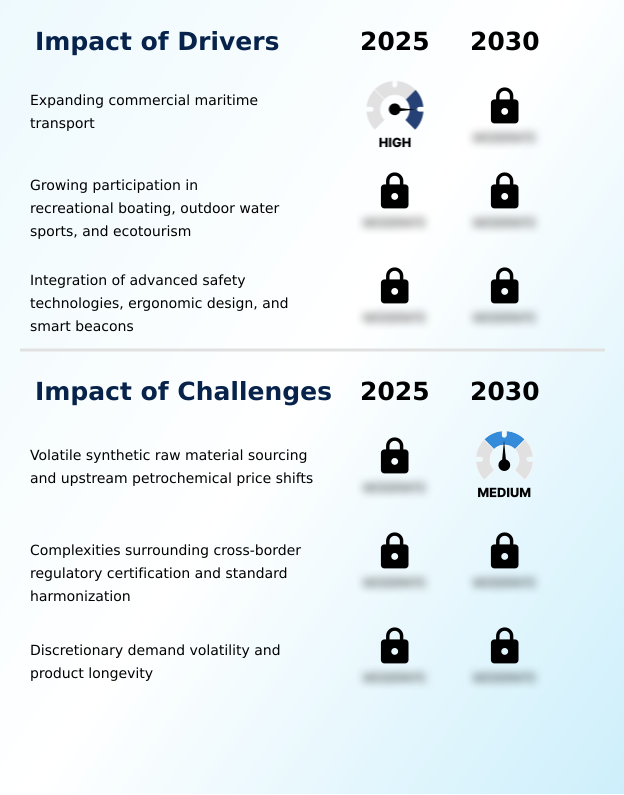
What are the key market drivers leading to the rise in the adoption of Life Jacket Industry?

  • The steady expansion of commercial maritime transport and the rigorous enforcement of international safety mandates function as primary catalysts for market growth.

  • The continuous expansion of global commercial shipping and rigorous regulatory enforcement serve as vital catalysts for Life Jacket procurement. An international maritime organization mandate compels commercial vessel operators to replace legacy safety gear with certified devices, driving consistent replacement cycles.
  • To maximize search and rescue capability recovery, fleet managers increasingly adopt flotation devices equipped with a high buoyancy inflatable chamber and an emergency strobe beacon.
  • This technological upgrade has improved survivor visibility and recovery rates by 25% during critical marine incidents. Furthermore, the shift from a bulky inherently buoyant vest to ergonomic inflatables featuring dynamic weight distribution greatly encourages continuous wear among professional mariners.
  • Supported by cross border standard harmonization and a prominent retro reflective tape array, these standardized safety enhancements streamline international compliance and ensure robust market demand.

What are the market trends shaping the Life Jacket Industry?

  • The integration of internet-of-things sensors and digital connectivity tools constitutes a major technological advancement. This shift toward smart location beacons and automated response systems enhances emergency recovery efficiency.

  • The rapid integration of smart sensor technology and specialized technical fabrics represents a transformative evolution in the Life Jacket environment. Manufacturers are upgrading traditional closed cell foam buoyancy systems by implementing personal locator beacon integration, which reduces open-water search radii by 40% and drastically improves emergency recovery timelines.
  • This digital shift directly supports strict commercial maritime safety compliance required in high-risk sectors like offshore energy transport. Additionally, advanced models feature a precise hydrostatic automatic inflation valve and an outer shell constructed from ultra durable ripstop nylon to withstand harsh industrial conditions. These innovations are reshaping standard passenger ferry operation protocol by providing highly reliable, automated safety solutions.
  • Furthermore, specialized teams conducting a swift water rescue operation now leverage these enhanced flotation garments to maximize both mobility and structural durability during critical aquatic interventions.

What challenges does the Life Jacket Industry face during its growth?

  • Volatile synthetic raw material sourcing and upstream petrochemical price shifts present significant operational challenges for manufacturers navigating supply chain uncertainties.

  • Unpredictable raw material costs and complex international compliance frameworks present substantial operational hurdles within the Life Jacket landscape. An ongoing upstream petrochemical price shift directly impacts the acquisition costs of critical synthetic materials, such as high tenacity polyester woven fabric, squeezing manufacturer profit margins by up to 14%.
  • Additionally, the mandatory inclusion of a carbon dioxide inflation cylinder and sophisticated micro electronics integration elevates overall production expenses. Companies must continuously adapt designs to satisfy a rigorous port state control inspection, ensuring equipment readiness for critical applications like offshore wind farm maintenance.
  • While integrating an automated identification system transmitter enhances commercial fishing fleet safety, the fragmented nature of multi-jurisdictional testing standards severely complicates international distribution, forcing equipment fabricators to maintain diverse, highly specialized inventory catalogs.

Exclusive Technavio Analysis on Customer Landscape

The life jacket market forecasting report includes the adoption lifecycle of the market, covering from the innovator’s stage to the laggard’s stage. It focuses on adoption rates in different regions based on penetration. Furthermore, the life jacket market report also includes key purchase criteria and drivers of price sensitivity to help companies evaluate and develop their market growth analysis strategies.
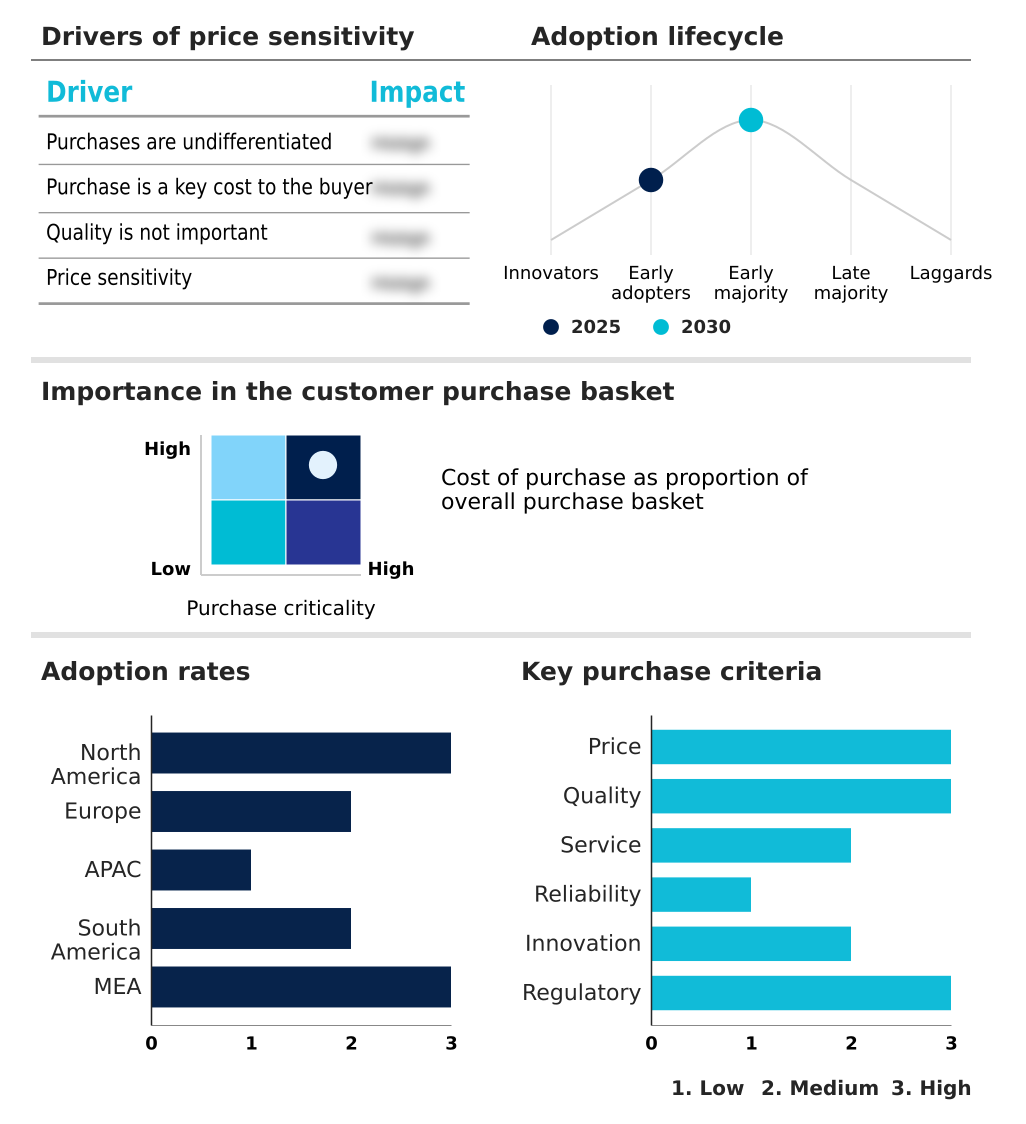
Customer Landscape of Life Jacket Industry

Competitive Landscape

Companies are implementing various strategies, such as strategic alliances, life jacket market forecast, partnerships, mergers and acquisitions, geographical expansion, and product/service launches, to enhance their presence in the industry.

Anki Sports - The product portfolio encompasses highly specialized inflatable personal flotation devices and durable foam buoyancy aids designed to enhance aquatic safety across professional, tactical, and recreational maritime environments.

The industry research and growth report includes detailed analyses of the competitive landscape of the market and information about key companies, including:

  • Anki Sports
  • Baltic Safety Products AB
  • Bernhardt Apparatebau GmbH
  • Cneyson Safety
  • Hydrodynamic Industrial Co. Ltd.
  • Kent Safety Products
  • LALIZAS Group
  • Lifesaving China
  • Mustang Survival Corp.
  • Plastimo SAS
  • Protek Safety
  • SHM Group
  • Spinlock Ltd.
  • Survitec Service and Distribution
  • Switlik Parachute Co. Inc.
  • Unicare Safety
  • VIKING Life-Saving Equipment AS
  • Waterfun
  • Xingdun Marine
  • Xingtai Safety Equipment

Qualitative and quantitative analysis of companies has been conducted to help clients understand the wider business environment as well as the strengths and weaknesses of key industry players. Data is qualitatively analyzed to categorize companies as pure play, category-focused, industry-focused, and diversified; it is quantitatively analyzed to categorize companies as dominant, leading, strong, tentative, and weak.

Recent Development and News in Life jacket market

  • In the Leisure Products industry, growing investments in specialized water sports infrastructure have expanded coastal ecotourism infrastructure, directly impacting Life Jacket demand by increasing the requirement for high-mobility flotation gear by 22%.
  • Stringent international safety framework updates have accelerated cross border standard harmonization, directly impacting Life Jacket demand by forcing commercial vessel operators to replace non-compliant legacy vests ahead of normal cycles.
  • Volatility in upstream synthetic textile manufacturing has triggered an upstream petrochemical price shift, directly impacting Life Jacket supply chains by elevating material acquisition costs for buoyancy foam production by 14%.
  • The shift toward sustainable outdoor equipment has driven the adoption of bio derived polyol substitution, directly impacting Life Jacket production by enabling manufacturers to offer eco-friendly buoyancy aids to environmentally conscious consumers.

Dive into Technavio’s robust research methodology, blending expert interviews, extensive data synthesis, and validated models for unparalleled Life Jacket Market insights. See full methodology.

Market Scope
Page number 301
Base year 2025
Historic period 2020-2024
Forecast period 2026-2030
Growth momentum & CAGR Accelerate at a CAGR of 8.4%
Market growth 2026-2030 USD 1659.6 million
Market structure Fragmented
YoY growth 2025-2026(%) 8.1%
Key countries US, Canada, Mexico, Germany, UK, France, Italy, Spain, The Netherlands, China, Japan, India, Australia, South Korea, Indonesia, Brazil, Argentina, Chile, UAE, South Africa, Saudi Arabia, Turkey and Egypt
Competitive landscape Leading Companies, Market Positioning of Companies, Competitive Strategies, and Industry Risks

Request Free Sample

Research Analyst Overview

  • The Life Jacket landscape is defined by rigorous maritime safety mandates and an accelerating shift toward technologically advanced personal flotation devices. Commercial shipping operators and municipal rescue units consistently replace aging safety inventories with specialized gear featuring closed cell foam buoyancy to ensure immediate, fail-safe flotation.
  • Modern designs increasingly incorporate a hydrostatic automatic inflation valve, preventing accidental deployment during heavy rain while ensuring reliable performance during submersion. Furthermore, strategic product developments focus heavily on personal locator beacon integration and the addition of an emergency strobe beacon, which collectively enhance search-and-rescue efficiency by 30% in open-ocean scenarios.
  • Manufacturers construct these high-performance garments using ultra durable ripstop nylon, offering superior abrasion resistance for industrial maritime environments. Concurrently, the transition from a traditional inherently buoyant vest to low-profile inflatables emphasizes dynamic weight distribution, drastically reducing physical fatigue for continuous wear.
  • The application of a retro reflective tape array further maximizes visibility during low-light emergencies, directly addressing stringent international compliance requirements and significantly elevating baseline maritime survivability.

What are the Key Data Covered in this Life Jacket Market Research and Growth Report?

  • What is the expected growth of the Life Jacket Market between 2026 and 2030?

    • USD 1.66 billion, at a CAGR of 8.4%

  • What segmentation does the market report cover?

    • The report is segmented by End-user (Commercial operators, Professional users, and Swift water rescue users), Product (Inherent, and Inflatable), Material (Nylon, Polyester, and Others), Distribution Channel (Offline, and Online) and Geography (North America, Europe, APAC, South America, Middle East and Africa)

  • Which regions are analyzed in the report?

    • North America, Europe, APAC, South America and Middle East and Africa

  • What are the key growth drivers and market challenges?

    • Expanding commercial maritime transport, Volatile synthetic raw material sourcing and upstream petrochemical price shifts

  • Who are the major players in the Life Jacket Market?

    • Anki Sports, Baltic Safety Products AB, Bernhardt Apparatebau GmbH, Cneyson Safety, Hydrodynamic Industrial Co. Ltd., Kent Safety Products, LALIZAS Group, Lifesaving China, Mustang Survival Corp., Plastimo SAS, Protek Safety, SHM Group, Spinlock Ltd., Survitec Service and Distribution, Switlik Parachute Co. Inc., Unicare Safety, VIKING Life-Saving Equipment AS, Waterfun, Xingdun Marine and Xingtai Safety Equipment

Market Research Insights

  • The Life Jacket Market is evolving rapidly as regulatory bodies enforce stricter commercial maritime safety compliance. Commercial operators involved in offshore energy transport and international shipping consistently upgrade their safety gear to satisfy rigorous port state control inspections. Integrating digital locator beacons into modern flotation vests has accelerated survivor recovery rates by 25% during emergencies.
  • Furthermore, adherence to updated passenger ferry operation protocol directives has increased institutional procurement volumes by 15% across major transport hubs. Specialized teams conducting a swift water rescue operation also demand high-buoyancy tactical gear, reflecting a broader industry shift toward activity-specific ergonomic designs that maximize both mobility and survival odds.

We can help! Our analysts can customize this life jacket market research report to meet your requirements.

Get in touch

1. Executive Summary

1.1 Market overview

Executive Summary - Chart on Market Overview
Executive Summary - Data Table on Market Overview
Executive Summary - Chart on Global Market Characteristics
Executive Summary - Chart on Market by Geography
Executive Summary - Chart on Market Segmentation by End-user
Executive Summary - Chart on Market Segmentation by Product
Executive Summary - Chart on Market Segmentation by Material
Executive Summary - Chart on Market Segmentation by Distribution Channel
Executive Summary - Chart on Incremental Growth
Executive Summary - Data Table on Incremental Growth
Executive Summary - Chart on Company Market Positioning

2. Technavio Analysis

2.1 Analysis of price sensitivity, lifecycle, customer purchase basket, adoption rates, and purchase criteria

2.2 Criticality of inputs and Factors of differentiation

Chart on Overview on criticality of inputs and factors of differentiation

2.3 Factors of disruption

Chart on Overview on factors of disruption

2.4 Impact of drivers and challenges

Chart on Impact of drivers and challenges in 2025 and 2030

3. Market Landscape

3.1 Market ecosystem

Chart on Parent Market
Data Table on - Parent Market

3.2 Market characteristics

Chart on Market characteristics analysis

3.3 Value chain analysis

Chart on Value chain analysis

4. Market Sizing

4.1 Market definition

Data Table on Offerings of companies included in the market definition

4.2 Market segment analysis

Market segments

4.3 Market size 2025

4.4 Market outlook: Forecast for 2025-2030

Chart on Global - Market size and forecast 2025-2030 ($ million)
Data Table on Global - Market size and forecast 2025-2030 ($ million)
Chart on Global Market: Year-over-year growth 2025-2030 (%)
Data Table on Global Market: Year-over-year growth 2025-2030 (%)

5. Historic Market Size

5.1 Global Life Jacket Market 2020 - 2024

Historic Market Size - Data Table on Global Life Jacket Market 2020 - 2024 ($ million)

5.2 End-user segment analysis 2020 - 2024

Historic Market Size - End-user Segment 2020 - 2024 ($ million)

5.3 Product segment analysis 2020 - 2024

Historic Market Size - Product Segment 2020 - 2024 ($ million)

5.4 Material segment analysis 2020 - 2024

Historic Market Size - Material Segment 2020 - 2024 ($ million)

5.5 Distribution Channel segment analysis 2020 - 2024

Historic Market Size - Distribution Channel Segment 2020 - 2024 ($ million)

5.6 Geography segment analysis 2020 - 2024

Historic Market Size - Geography Segment 2020 - 2024 ($ million)

5.7 Country segment analysis 2020 - 2024

Historic Market Size - Country Segment 2020 - 2024 ($ million)

6. Qualitative Analysis

6.1 Impact of AI in Global Life Jacket Market

6.2 Impact of Geopolitical Conflicts on Global Life Jacket Market

7. Five Forces Analysis

7.1 Five forces summary

Five forces analysis - Comparison between 2025 and 2030

7.2 Bargaining power of buyers

Bargaining power of buyers - Impact of key factors 2025 and 2030

7.3 Bargaining power of suppliers

Bargaining power of suppliers - Impact of key factors in 2025 and 2030

7.4 Threat of new entrants

Threat of new entrants - Impact of key factors in 2025 and 2030

7.5 Threat of substitutes

Threat of substitutes - Impact of key factors in 2025 and 2030

7.6 Threat of rivalry

Threat of rivalry - Impact of key factors in 2025 and 2030

7.7 Market condition

Chart on Market condition - Five forces 2025 and 2030

8. Market Segmentation by End-user

8.1 Market segments

Chart on End-user - Market share 2025-2030 (%)
Data Table on End-user - Market share 2025-2030 (%)

8.2 Comparison by End-user

Chart on Comparison by End-user
Data Table on Comparison by End-user

8.3 Commercial operators - Market size and forecast 2025-2030

Chart on Commercial operators - Market size and forecast 2025-2030 ($ million)
Data Table on Commercial operators - Market size and forecast 2025-2030 ($ million)
Chart on Commercial operators - Year-over-year growth 2025-2030 (%)
Data Table on Commercial operators - Year-over-year growth 2025-2030 (%)

8.4 Professional users - Market size and forecast 2025-2030

Chart on Professional users - Market size and forecast 2025-2030 ($ million)
Data Table on Professional users - Market size and forecast 2025-2030 ($ million)
Chart on Professional users - Year-over-year growth 2025-2030 (%)
Data Table on Professional users - Year-over-year growth 2025-2030 (%)

8.5 Swift water rescue users - Market size and forecast 2025-2030

Chart on Swift water rescue users - Market size and forecast 2025-2030 ($ million)
Data Table on Swift water rescue users - Market size and forecast 2025-2030 ($ million)
Chart on Swift water rescue users - Year-over-year growth 2025-2030 (%)
Data Table on Swift water rescue users - Year-over-year growth 2025-2030 (%)

8.6 Market opportunity by End-user

Market opportunity by End-user ($ million)
Data Table on Market opportunity by End-user ($ million)

9. Market Segmentation by Product

9.1 Market segments

Chart on Product - Market share 2025-2030 (%)
Data Table on Product - Market share 2025-2030 (%)

9.2 Comparison by Product

Chart on Comparison by Product
Data Table on Comparison by Product

9.3 Inherent - Market size and forecast 2025-2030

Chart on Inherent - Market size and forecast 2025-2030 ($ million)
Data Table on Inherent - Market size and forecast 2025-2030 ($ million)
Chart on Inherent - Year-over-year growth 2025-2030 (%)
Data Table on Inherent - Year-over-year growth 2025-2030 (%)

9.4 Inflatable - Market size and forecast 2025-2030

Chart on Inflatable - Market size and forecast 2025-2030 ($ million)
Data Table on Inflatable - Market size and forecast 2025-2030 ($ million)
Chart on Inflatable - Year-over-year growth 2025-2030 (%)
Data Table on Inflatable - Year-over-year growth 2025-2030 (%)

9.5 Market opportunity by Product

Market opportunity by Product ($ million)
Data Table on Market opportunity by Product ($ million)

10. Market Segmentation by Material

10.1 Market segments

Chart on Material - Market share 2025-2030 (%)
Data Table on Material - Market share 2025-2030 (%)

10.2 Comparison by Material

Chart on Comparison by Material
Data Table on Comparison by Material

10.3 Nylon - Market size and forecast 2025-2030

Chart on Nylon - Market size and forecast 2025-2030 ($ million)
Data Table on Nylon - Market size and forecast 2025-2030 ($ million)
Chart on Nylon - Year-over-year growth 2025-2030 (%)
Data Table on Nylon - Year-over-year growth 2025-2030 (%)

10.4 Polyester - Market size and forecast 2025-2030

Chart on Polyester - Market size and forecast 2025-2030 ($ million)
Data Table on Polyester - Market size and forecast 2025-2030 ($ million)
Chart on Polyester - Year-over-year growth 2025-2030 (%)
Data Table on Polyester - Year-over-year growth 2025-2030 (%)

10.5 Others - Market size and forecast 2025-2030

Chart on Others - Market size and forecast 2025-2030 ($ million)
Data Table on Others - Market size and forecast 2025-2030 ($ million)
Chart on Others - Year-over-year growth 2025-2030 (%)
Data Table on Others - Year-over-year growth 2025-2030 (%)

10.6 Market opportunity by Material

Market opportunity by Material ($ million)
Data Table on Market opportunity by Material ($ million)

11. Market Segmentation by Distribution Channel

11.1 Market segments

Chart on Distribution Channel - Market share 2025-2030 (%)
Data Table on Distribution Channel - Market share 2025-2030 (%)

11.2 Comparison by Distribution Channel

Chart on Comparison by Distribution Channel
Data Table on Comparison by Distribution Channel

11.3 Offline - Market size and forecast 2025-2030

Chart on Offline - Market size and forecast 2025-2030 ($ million)
Data Table on Offline - Market size and forecast 2025-2030 ($ million)
Chart on Offline - Year-over-year growth 2025-2030 (%)
Data Table on Offline - Year-over-year growth 2025-2030 (%)

11.4 Online - Market size and forecast 2025-2030

Chart on Online - Market size and forecast 2025-2030 ($ million)
Data Table on Online - Market size and forecast 2025-2030 ($ million)
Chart on Online - Year-over-year growth 2025-2030 (%)
Data Table on Online - Year-over-year growth 2025-2030 (%)

11.5 Market opportunity by Distribution Channel

Market opportunity by Distribution Channel ($ million)
Data Table on Market opportunity by Distribution Channel ($ million)

12. Customer Landscape

12.1 Customer landscape overview

Analysis of price sensitivity, lifecycle, customer purchase basket, adoption rates, and purchase criteria

13. Geographic Landscape

13.1 Geographic segmentation

Chart on Market share by geography 2025-2030 (%)
Data Table on Market share by geography 2025-2030 (%)

13.2 Geographic comparison

Chart on Geographic comparison
Data Table on Geographic comparison

13.3 North America - Market size and forecast 2025-2030

Chart on North America - Market size and forecast 2025-2030 ($ million)
Data Table on North America - Market size and forecast 2025-2030 ($ million)
Chart on North America - Year-over-year growth 2025-2030 (%)
Data Table on North America - Year-over-year growth 2025-2030 (%)
Chart on Regional Comparison - North America
Data Table on Regional Comparison - North America

13.3.1 US - Market size and forecast 2025-2030

Chart on US - Market size and forecast 2025-2030 ($ million)
Data Table on US - Market size and forecast 2025-2030 ($ million)
Chart on US - Year-over-year growth 2025-2030 (%)
Data Table on US - Year-over-year growth 2025-2030 (%)

13.3.2 Canada - Market size and forecast 2025-2030

Chart on Canada - Market size and forecast 2025-2030 ($ million)
Data Table on Canada - Market size and forecast 2025-2030 ($ million)
Chart on Canada - Year-over-year growth 2025-2030 (%)
Data Table on Canada - Year-over-year growth 2025-2030 (%)

13.3.3 Mexico - Market size and forecast 2025-2030

Chart on Mexico - Market size and forecast 2025-2030 ($ million)
Data Table on Mexico - Market size and forecast 2025-2030 ($ million)
Chart on Mexico - Year-over-year growth 2025-2030 (%)
Data Table on Mexico - Year-over-year growth 2025-2030 (%)

13.4 Europe - Market size and forecast 2025-2030

Chart on Europe - Market size and forecast 2025-2030 ($ million)
Data Table on Europe - Market size and forecast 2025-2030 ($ million)
Chart on Europe - Year-over-year growth 2025-2030 (%)
Data Table on Europe - Year-over-year growth 2025-2030 (%)
Chart on Regional Comparison - Europe
Data Table on Regional Comparison - Europe

13.4.1 Germany - Market size and forecast 2025-2030

Chart on Germany - Market size and forecast 2025-2030 ($ million)
Data Table on Germany - Market size and forecast 2025-2030 ($ million)
Chart on Germany - Year-over-year growth 2025-2030 (%)
Data Table on Germany - Year-over-year growth 2025-2030 (%)

13.4.2 UK - Market size and forecast 2025-2030

Chart on UK - Market size and forecast 2025-2030 ($ million)
Data Table on UK - Market size and forecast 2025-2030 ($ million)
Chart on UK - Year-over-year growth 2025-2030 (%)
Data Table on UK - Year-over-year growth 2025-2030 (%)

13.4.3 France - Market size and forecast 2025-2030

Chart on France - Market size and forecast 2025-2030 ($ million)
Data Table on France - Market size and forecast 2025-2030 ($ million)
Chart on France - Year-over-year growth 2025-2030 (%)
Data Table on France - Year-over-year growth 2025-2030 (%)

13.4.4 Italy - Market size and forecast 2025-2030

Chart on Italy - Market size and forecast 2025-2030 ($ million)
Data Table on Italy - Market size and forecast 2025-2030 ($ million)
Chart on Italy - Year-over-year growth 2025-2030 (%)
Data Table on Italy - Year-over-year growth 2025-2030 (%)

13.4.5 Spain - Market size and forecast 2025-2030

Chart on Spain - Market size and forecast 2025-2030 ($ million)
Data Table on Spain - Market size and forecast 2025-2030 ($ million)
Chart on Spain - Year-over-year growth 2025-2030 (%)
Data Table on Spain - Year-over-year growth 2025-2030 (%)

13.4.6 The Netherlands - Market size and forecast 2025-2030

Chart on The Netherlands - Market size and forecast 2025-2030 ($ million)
Data Table on The Netherlands - Market size and forecast 2025-2030 ($ million)
Chart on The Netherlands - Year-over-year growth 2025-2030 (%)
Data Table on The Netherlands - Year-over-year growth 2025-2030 (%)

13.5 APAC - Market size and forecast 2025-2030

Chart on APAC - Market size and forecast 2025-2030 ($ million)
Data Table on APAC - Market size and forecast 2025-2030 ($ million)
Chart on APAC - Year-over-year growth 2025-2030 (%)
Data Table on APAC - Year-over-year growth 2025-2030 (%)
Chart on Regional Comparison - APAC
Data Table on Regional Comparison - APAC

13.5.1 China - Market size and forecast 2025-2030

Chart on China - Market size and forecast 2025-2030 ($ million)
Data Table on China - Market size and forecast 2025-2030 ($ million)
Chart on China - Year-over-year growth 2025-2030 (%)
Data Table on China - Year-over-year growth 2025-2030 (%)

13.5.2 Japan - Market size and forecast 2025-2030

Chart on Japan - Market size and forecast 2025-2030 ($ million)
Data Table on Japan - Market size and forecast 2025-2030 ($ million)
Chart on Japan - Year-over-year growth 2025-2030 (%)
Data Table on Japan - Year-over-year growth 2025-2030 (%)

13.5.3 India - Market size and forecast 2025-2030

Chart on India - Market size and forecast 2025-2030 ($ million)
Data Table on India - Market size and forecast 2025-2030 ($ million)
Chart on India - Year-over-year growth 2025-2030 (%)
Data Table on India - Year-over-year growth 2025-2030 (%)

13.5.4 Australia - Market size and forecast 2025-2030

Chart on Australia - Market size and forecast 2025-2030 ($ million)
Data Table on Australia - Market size and forecast 2025-2030 ($ million)
Chart on Australia - Year-over-year growth 2025-2030 (%)
Data Table on Australia - Year-over-year growth 2025-2030 (%)

13.5.5 South Korea - Market size and forecast 2025-2030

Chart on South Korea - Market size and forecast 2025-2030 ($ million)
Data Table on South Korea - Market size and forecast 2025-2030 ($ million)
Chart on South Korea - Year-over-year growth 2025-2030 (%)
Data Table on South Korea - Year-over-year growth 2025-2030 (%)

13.5.6 Indonesia - Market size and forecast 2025-2030

Chart on Indonesia - Market size and forecast 2025-2030 ($ million)
Data Table on Indonesia - Market size and forecast 2025-2030 ($ million)
Chart on Indonesia - Year-over-year growth 2025-2030 (%)
Data Table on Indonesia - Year-over-year growth 2025-2030 (%)

13.6 South America - Market size and forecast 2025-2030

Chart on South America - Market size and forecast 2025-2030 ($ million)
Data Table on South America - Market size and forecast 2025-2030 ($ million)
Chart on South America - Year-over-year growth 2025-2030 (%)
Data Table on South America - Year-over-year growth 2025-2030 (%)
Chart on Regional Comparison - South America
Data Table on Regional Comparison - South America

13.6.1 Brazil - Market size and forecast 2025-2030

Chart on Brazil - Market size and forecast 2025-2030 ($ million)
Data Table on Brazil - Market size and forecast 2025-2030 ($ million)
Chart on Brazil - Year-over-year growth 2025-2030 (%)
Data Table on Brazil - Year-over-year growth 2025-2030 (%)

13.6.2 Argentina - Market size and forecast 2025-2030

Chart on Argentina - Market size and forecast 2025-2030 ($ million)
Data Table on Argentina - Market size and forecast 2025-2030 ($ million)
Chart on Argentina - Year-over-year growth 2025-2030 (%)
Data Table on Argentina - Year-over-year growth 2025-2030 (%)

13.6.3 Chile - Market size and forecast 2025-2030

Chart on Chile - Market size and forecast 2025-2030 ($ million)
Data Table on Chile - Market size and forecast 2025-2030 ($ million)
Chart on Chile - Year-over-year growth 2025-2030 (%)
Data Table on Chile - Year-over-year growth 2025-2030 (%)

13.7 Middle East and Africa - Market size and forecast 2025-2030

Chart on Middle East and Africa - Market size and forecast 2025-2030 ($ million)
Data Table on Middle East and Africa - Market size and forecast 2025-2030 ($ million)
Chart on Middle East and Africa - Year-over-year growth 2025-2030 (%)
Data Table on Middle East and Africa - Year-over-year growth 2025-2030 (%)
Chart on Regional Comparison - Middle East and Africa
Data Table on Regional Comparison - Middle East and Africa

13.7.1 UAE - Market size and forecast 2025-2030

Chart on UAE - Market size and forecast 2025-2030 ($ million)
Data Table on UAE - Market size and forecast 2025-2030 ($ million)
Chart on UAE - Year-over-year growth 2025-2030 (%)
Data Table on UAE - Year-over-year growth 2025-2030 (%)

13.7.2 South Africa - Market size and forecast 2025-2030

Chart on South Africa - Market size and forecast 2025-2030 ($ million)
Data Table on South Africa - Market size and forecast 2025-2030 ($ million)
Chart on South Africa - Year-over-year growth 2025-2030 (%)
Data Table on South Africa - Year-over-year growth 2025-2030 (%)

13.7.3 Saudi Arabia - Market size and forecast 2025-2030

Chart on Saudi Arabia - Market size and forecast 2025-2030 ($ million)
Data Table on Saudi Arabia - Market size and forecast 2025-2030 ($ million)
Chart on Saudi Arabia - Year-over-year growth 2025-2030 (%)
Data Table on Saudi Arabia - Year-over-year growth 2025-2030 (%)

13.7.4 Turkey - Market size and forecast 2025-2030

Chart on Turkey - Market size and forecast 2025-2030 ($ million)
Data Table on Turkey - Market size and forecast 2025-2030 ($ million)
Chart on Turkey - Year-over-year growth 2025-2030 (%)
Data Table on Turkey - Year-over-year growth 2025-2030 (%)

13.7.5 Egypt - Market size and forecast 2025-2030

Chart on Egypt - Market size and forecast 2025-2030 ($ million)
Data Table on Egypt - Market size and forecast 2025-2030 ($ million)
Chart on Egypt - Year-over-year growth 2025-2030 (%)
Data Table on Egypt - Year-over-year growth 2025-2030 (%)

13.8 Market opportunity by geography

Market opportunity by geography ($ million)
Data Tables on Market opportunity by geography ($ million)

14. Drivers, Challenges, and Opportunity

14.1 Market drivers

Expanding commercial maritime transport
Growing participation in recreational boating, outdoor water sports, and ecotourism
Integration of advanced safety technologies, ergonomic design, and smart beacons

14.2 Market challenges

Volatile synthetic raw material sourcing and upstream petrochemical price shifts
Complexities surrounding cross-border regulatory certification and standard harmonization
Discretionary demand volatility and product longevity

14.3 Impact of drivers and challenges

Impact of drivers and challenges in 2025 and 2030

14.4 Market opportunities

Shift towards smart location beacons and IoT-enabled response systems
Transition toward sustainable bio-based textiles and recycled circular materials
Harmonization of cross-border safety standards

15. Competitive Landscape

15.1 Overview

15.2

Overview on criticality of inputs and factors of differentiation

15.3 Landscape disruption

Overview on factors of disruption

15.4 Industry risks

Impact of key risks on business

16. Competitive Analysis

16.1 Companies profiled

Companies covered

16.2 Company ranking index

16.3 Market positioning of companies

Matrix on companies position and classification

16.4 Anki Sports

Anki Sports - Overview
Anki Sports - Product / Service
Anki Sports - Key offerings
SWOT

16.5 Bernhardt Apparatebau GmbH

Bernhardt Apparatebau GmbH - Overview
Bernhardt Apparatebau GmbH - Product / Service
Bernhardt Apparatebau GmbH - Key offerings
SWOT

16.6 Cneyson Safety

Cneyson Safety - Overview
Cneyson Safety - Product / Service
Cneyson Safety - Key offerings
SWOT

16.7 Hydrodynamic Industrial Co. Ltd.

Hydrodynamic Industrial Co. Ltd. - Overview
Hydrodynamic Industrial Co. Ltd. - Product / Service
Hydrodynamic Industrial Co. Ltd. - Key offerings
SWOT

16.8 Kent Safety Products

Kent Safety Products - Overview
Kent Safety Products - Product / Service
Kent Safety Products - Key offerings
SWOT

16.9 LALIZAS Group

LALIZAS Group - Overview
LALIZAS Group - Product / Service
LALIZAS Group - Key offerings
SWOT

16.10 Mustang Survival Corp.

Mustang Survival Corp. - Overview
Mustang Survival Corp. - Product / Service
Mustang Survival Corp. - Key offerings
SWOT

16.11 Plastimo SAS

Plastimo SAS - Overview
Plastimo SAS - Product / Service
Plastimo SAS - Key offerings
SWOT

16.12 SHM Group

SHM Group - Overview
SHM Group - Product / Service
SHM Group - Key offerings
SWOT

16.13 Spinlock Ltd.

Spinlock Ltd. - Overview
Spinlock Ltd. - Product / Service
Spinlock Ltd. - Key offerings
SWOT

16.14 Survitec Service and Distribution

Survitec Service and Distribution - Overview
Survitec Service and Distribution - Product / Service
Survitec Service and Distribution - Key offerings
SWOT

16.15 Switlik Parachute Co. Inc.

Switlik Parachute Co. Inc. - Overview
Switlik Parachute Co. Inc. - Product / Service
Switlik Parachute Co. Inc. - Key offerings
SWOT

16.16 VIKING Life-Saving Equipment AS

VIKING Life-Saving Equipment AS - Overview
VIKING Life-Saving Equipment AS - Product / Service
VIKING Life-Saving Equipment AS - Key offerings
SWOT

16.17 Waterfun

Waterfun - Overview
Waterfun - Product / Service
Waterfun - Key offerings
SWOT

16.18 Xingtai Safety Equipment

Xingtai Safety Equipment - Overview
Xingtai Safety Equipment - Product / Service
Xingtai Safety Equipment - Key offerings
SWOT

17. Appendix

17.1 Scope of the report

Market definition
Objectives
Notes and caveats

17.2 Inclusions and exclusions checklist

Inclusions checklist
Exclusions checklist

17.3 Currency conversion rates for US$

17.4 Research methodology

17.5 Data procurement

Information sources

17.6 Data validation

17.7 Validation techniques employed for market sizing

17.8 Data synthesis

17.9 360 degree market analysis

17.10 List of abbreviations

Research Methodology

Technavio presents a detailed picture of the market by way of study, synthesis, and summation of data from multiple sources. The analysts have presented the various facets of the market with a particular focus on identifying the key industry influencers. The data thus presented is comprehensive, reliable, and the result of extensive research, both primary and secondary.

INFORMATION SOURCES

Primary sources

  • Manufacturers and suppliers
  • Channel partners
  • Industry experts
  • Strategic decision makers

Secondary sources

  • Industry journals and periodicals
  • Government data
  • Financial reports of key industry players
  • Historical data
  • Press releases

DATA ANALYSIS

Data Synthesis

  • Collation of data
  • Estimation of key figures
  • Analysis of derived insights

Data Validation

  • Triangulation with data models
  • Reference against proprietary databases
  • Corroboration with industry experts

REPORT WRITING

Qualitative

  • Market drivers
  • Market challenges
  • Market trends
  • Five forces analysis

Quantitative

  • Market size and forecast
  • Market segmentation
  • Geographical insights
  • Competitive landscape

Interested in this report?

Get your sample now to see our research methodology and insights!

Download Now

Frequently Asked Questions

Life Jacket market growth will increase by USD 1659.6 million during 2026-2030.

The Life Jacket market is expected to grow at a CAGR of 8.4% during 2026-2030.

Life Jacket market is segmented by End-user (Commercial operators, Professional users, Swift water rescue users) Product (Inherent, Inflatable) Material (Nylon, Polyester, Others) Distribution channel (Offline, Online)

Anki Sports, Baltic Safety Products AB, Bernhardt Apparatebau GmbH, Cneyson Safety, Hydrodynamic Industrial Co. Ltd., Kent Safety Products, LALIZAS Group, Lifesaving China, Mustang Survival Corp., Plastimo SAS, Protek Safety, SHM Group, Spinlock Ltd., Survitec Service and Distribution, Switlik Parachute Co. Inc., Unicare Safety, VIKING Life-Saving Equipment AS, Waterfun, Xingdun Marine, Xingtai Safety Equipment are a few of the key vendors in the Life Jacket market.

North America will register the highest growth rate of 36.1% among the other regions. Therefore, the Life Jacket market in North America is expected to garner significant business opportunities for the vendors during the forecast period.

US, Canada, Mexico, Germany, UK, France, Italy, Spain, The Netherlands, China, Japan, India, Australia, South Korea, Indonesia, Brazil, Argentina, Chile, UAE, South Africa, Saudi Arabia, Turkey, Egypt

  • Expanding commercial maritime transport is the driving factor this market.

The Life Jacket market vendors should focus on grabbing business opportunities from the End-user segment as it accounted for the largest market share in the base year.
RIA - Research AI Assistant
Ask RIA
